Inside NVIDIA's 39% Revenue Concentration and Alphabet's Historic Cash Deficit: Deconstructing CoreWeave's $640M Interest Burden, Oracle's $288B Uncommenced Leases, and the 6-Year Depreciation Stretch
As annual information processing investments hit $1.65T, SEC filings reveal deep circular vendor financing, Alphabet’s first quarterly cash burn since IPO, and structural duration mismatches between 1-year GPU cycles and 19-year lease liabilities.
Published: October 28, 2026 | Read time: ~10 min | Watch Video (Japanese)
Executive Summary: The Structural Liquidity Paradox of the $1.65 Trillion AI Boom
Global markets operate under a common assumption: Because artificial intelligence represents a multi-decade technological revolution, the balance sheets of leading semiconductor designers, hyperscalers, and specialized GPU operators remain financially unassailable.
However, a forensic audit of SEC Form 10-K and 10-Q filings, alongside macroeconomic data from the Federal Reserve Bank of St. Louis (FRED), demonstrates that AI infrastructure expansion is generating severe financial strains. Behind headline revenue growth, three structural realities define the ecosystem:
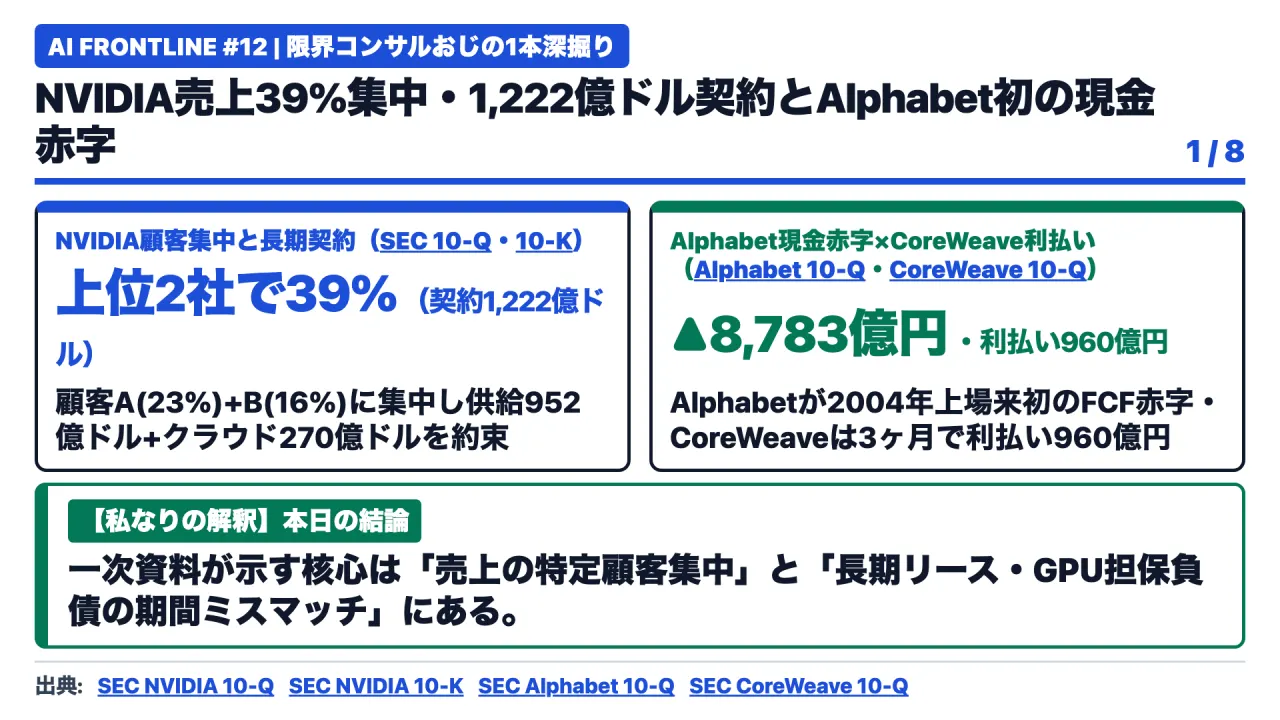
- Extreme Revenue and Commitment Concentration: NVIDIA Corporation generated 39 percent of its $46.7 billion in quarterly revenue from just two direct customers, while accumulating $122.2 billion in off-balance-sheet manufacturing and multi-year cloud commitments. Simultaneously, specialized GPU cloud operators like CoreWeave accumulated $51.6 billion in total debt and lease obligations, incurring $640 million in quarterly net interest expenses against $2.58 billion in revenue.
- First-Ever Cash Deficits and Hidden Balance Sheet Liabilities: Alphabet Inc. logged a negative free cash flow deficit of -$5.86 billion in the second quarter of 2026—its first quarterly cash burn since its 2004 initial public offering (IPO)—as quarterly CapEx doubled to $44.92 billion. Concurrently, Oracle Corporation accumulated up to $288 billion in off-balance-sheet, uncommenced data center leases with durations of 15 to 19 years, driving full-year free cash flow to negative $23.7 billion and prompting credit rating downgrades to BBB-.
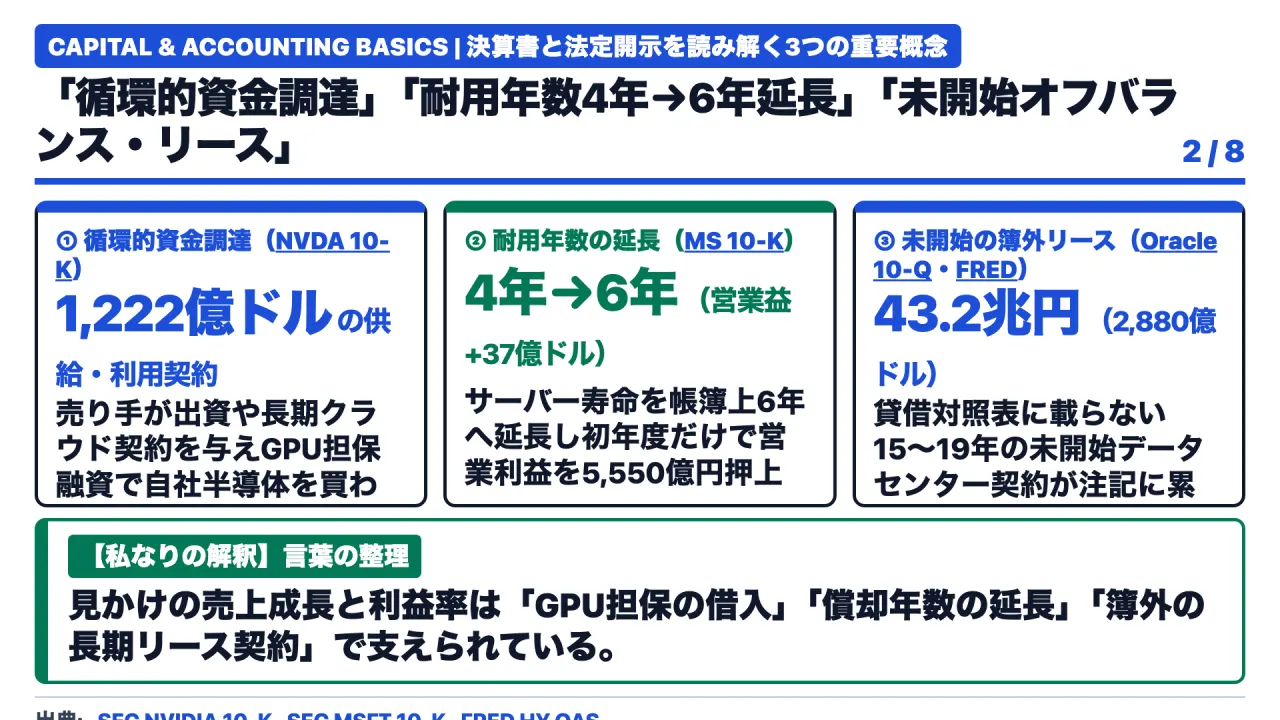
- Accounting Depreciation Stretches vs. Silicon Obsolescence: Hyperscalers extended server and networking accounting lives from four years to six years, artificially depressing annual depreciation expenses and boosting operating income by billions. Yet physical GPU architectures (Hopper, Blackwell, Rubin) cycle every 12 to 18 months, creating a severe duration mismatch between accounting assumptions and technological reality.
1. Primary Data on the Capital Loop: NVIDIA’s Customer Concentration and CoreWeave’s Debt Load
The contemporary AI financing engine connects four primary participants: hyperscale cloud providers, semiconductor designers, specialized neo-cloud infrastructure operators, and frontier foundation model labs.
NVIDIA’s 39 Percent Customer Concentration and $122.2B Commitments
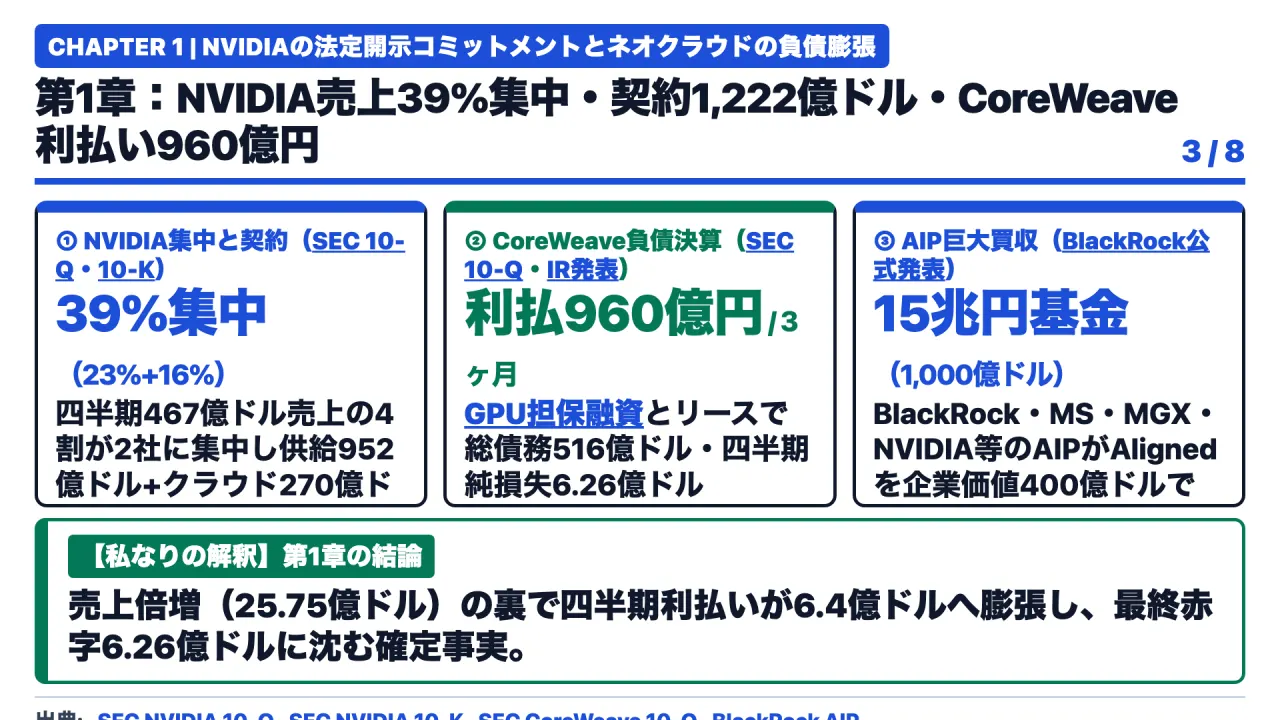
In NVIDIA’s Form 10-Q for the second quarter of fiscal 2026 (ended July 27, 2025, Note 13), the company disclosed that out of $46.7 billion in quarterly revenue, Customer A represented 23 percent and Customer B accounted for 16 percent. Together, just two direct enterprise purchasers generated 39 percent of consolidated revenues (up from 25 percent in the prior-year period), exclusively within the Compute & Networking segment.
Furthermore, Note 12 of NVIDIA’s Form 10-K reveals massive contractual obligations:
- Manufacturing and Long-Term Supply Commitments: $95.2 billion to secure fab capacity, advanced packaging (CoWoS), and high-bandwidth memory (HBM).
- Multi-Year Cloud Services Commitments: $27.0 billion payable to cloud providers through 2030 ($7.0 billion in FY2027, $6.0 billion in FY2028, and $5.0 billion annually in FY2029-FY2030).
- Aggregate Contractual Commitments: $122.2 billion, structured as mandatory obligations outside baseline balance sheet liabilities.
CoreWeave: $51.6 Billion in Obligations and $640 Million Quarterly Interest
The primary borrower scaling GPU-backed debt facilities is specialized cloud operator CoreWeave (SEC CIK: 0001769628):
- Debt Facilities: Secured a $2.3 billion facility in August 2023, followed by a $7.5 billion GPU-collateralized asset-based facility led by Blackstone in May 2024. In March 2026, CoreWeave closed an $8.5 billion Delayed Draw Term Loan (DDTL 4.0) collateralized by long-term customer contracts with Meta Platforms, priced at SOFR plus 2.25 percent (variable) and 5.9 percent (fixed).
- Financial Results (Q2 2026 Form 10-Q): Quarterly revenue grew 112 percent year-over-year to $2.58 billion. However, direct balance sheet borrowings reached $35.1 billion to $35.6 billion, and uncommenced data center lease liabilities added $16.3 billion to $16.5 billion, creating a total debt load of $51.6 billion.
- Net Interest Expense: Quarterly net interest expense jumped 2.4x from $267 million to $640 million. Consequently, CoreWeave posted a quarterly net loss of -$626 million (widening from -$290 million in the prior-year period).
Similarly, competitor Lambda Labs secured a $926 million GPU-collateralized Term Loan B in August 2026 (Moody’s Baa2, priced at SOFR plus 3.00 percent, due December 2030), demonstrating systemic reliance on debt-financed silicon acquisition.
2. Macroeconomic Overheating and Hyperscaler Financial Strain
Exceeding the 2000 Dot-Com Peak
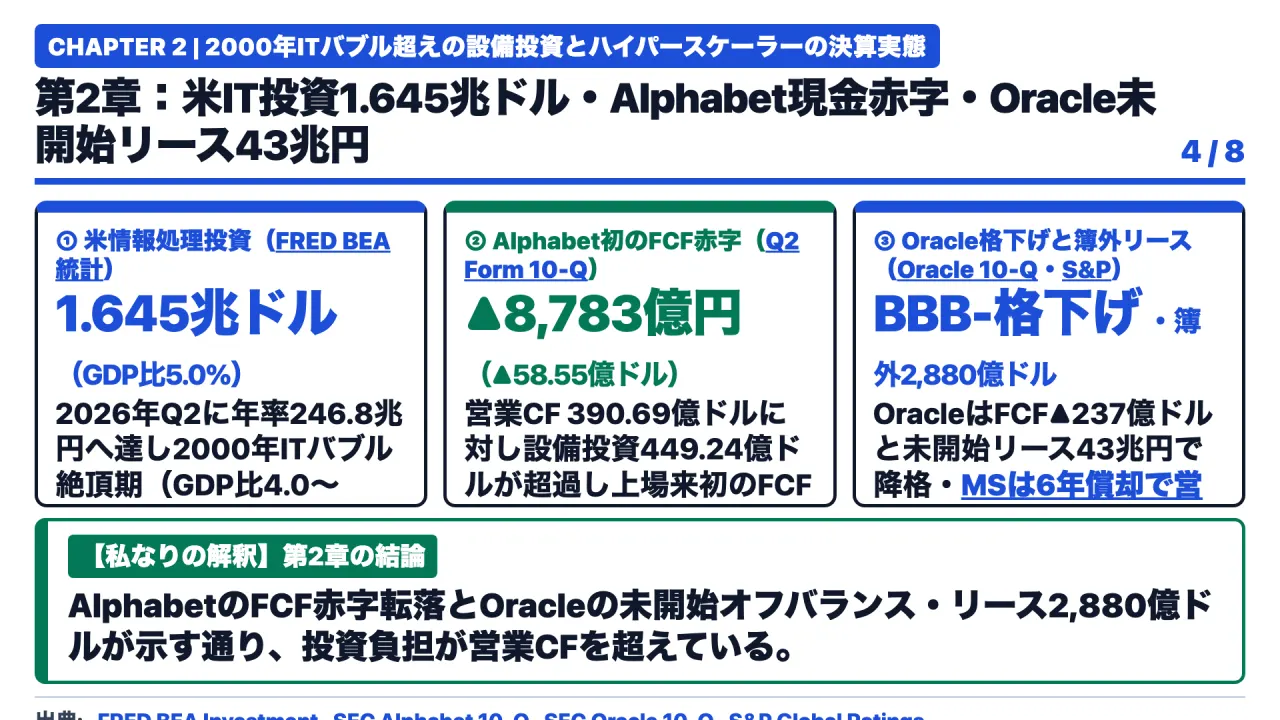
Data published by the U.S. Bureau of Economic Analysis (BEA) and Federal Reserve Bank of St. Louis (series A679RC1Q027SBEA: Private Fixed Investment in Information Processing Equipment and Software) documents an unprecedented macroeconomic expansion:
- Q2 2025: $1.375 trillion (seasonally adjusted annual rate).
- Q4 2025: $1.495 trillion.
- Q1 2026: $1.586 trillion.
- Q2 2026: $1.646 trillion.
Information processing investment surpassed 5.0 percent of nominal U.S. GDP, officially exceeding the peak of the 2000 telecommunications and dot-com bubble (which reached between 4.0 and 4.4 percent of GDP).
+---------------------------------------------------------------------------------------------------+
|               Comparative Macroeconomic & Enterprise Capital Metrics                              |
+------------------------------------+--------------------------+-----------------------------------+
| Indicator / Metric Dimension       | Value / Filing Reference | Structural Economic Implication   |
+------------------------------------+--------------------------+-----------------------------------+
| US Info Processing Investment/GDP  | 5.0% ($1.646T Run-Rate)  | Surpasses 2000 telecom peak (4.4%)|
| NVIDIA Top-2 Customer Share        | 39% ($18.2B / $46.7B)    | Severe counterparty concentration |
| NVIDIA Supply & Cloud Commitments  | $122.2B Total Off-Balance| Unprecedented purchase liabilities|
| CoreWeave Total Debt & Leases      | $51.6B Total Debt        | Incurring $640M quarterly interest|
| Alphabet Q2 2026 Free Cash Flow    | -$5.86B Net Cash Deficit | First quarterly deficit since IPO |
| Oracle Uncommenced Lease Backlog   | $288B (Note 9, 15-19 Yrs)| Off-balance debt exceeds total assets|
| Oracle Long-Term Credit Rating     | BBB- (Downgraded by S&P) | One step above speculative grade  |
+------------------------------------+--------------------------+-----------------------------------+
Alphabet’s Historic Cash Deficit
In Alphabet Inc.’s Form 10-Q for the quarter ended June 30, 2026, operating cash flow grew to $39.07 billion. However, quarterly capital expenditures surged 100 percent year-over-year from $22.45 billion to $44.92 billion. As a result, Alphabet generated negative free cash flow of -$5.86 billion—the company’s first quarterly cash deficit since listing on public exchanges in 2004.
Oracle’s $288 Billion in Off-Balance-Sheet Leases
Oracle Corporation’s fiscal 2026 Form 10-K and Q1 FY2027 Form 10-Q reveal acute balance sheet leverage:
- Remaining Performance Obligations (RPO): Surged 363 percent to $638 billion, with roughly 45 percent concentrated in OpenAI.
- Capital Outlays: Full-year FY2026 CapEx jumped from $21.2 billion to $55.7 billion, producing a free cash flow deficit of -$23.7 billion. Projected FY2027 gross CapEx stands at $90 billion to $95 billion.
- Uncommenced Leases (Note 9): Beyond the $37.9 billion in recorded lease liabilities, Oracle holds $288 billion in uncommenced data center leases with terms ranging from 15 to 19 years. Because these facilities remain under construction, these liabilities are excluded from the main balance sheet, even though they exceed Oracle’s total recognized assets ($261.8 billion).
- Credit Downgrade: S&P Global Ratings downgraded Oracle’s senior debt to BBB- (the lowest investment-grade tier), warning that CapEx-to-operating-cash-flow ratios exceeded sustainable levels.
The Accounting Lifeline: Server Life Extensions
To buffer operating income against these capital commitments, hyperscalers adjusted fundamental accounting estimates. Microsoft’s Form 10-K (Note 1) reveals that extending the estimated useful life of server and networking assets from four years to six years reduced annual depreciation expense by $3.7 billion, boosting operating income by $3.7 billion and net income by $3.0 billion.
However, accelerated hardware cycles render older GPU architectures economically obsolete within two to three years, creating a major divergence between accounting book value and commercial utility.
3. Industry Warnings: Circular Revenue and the Telecom Bubble Analogy
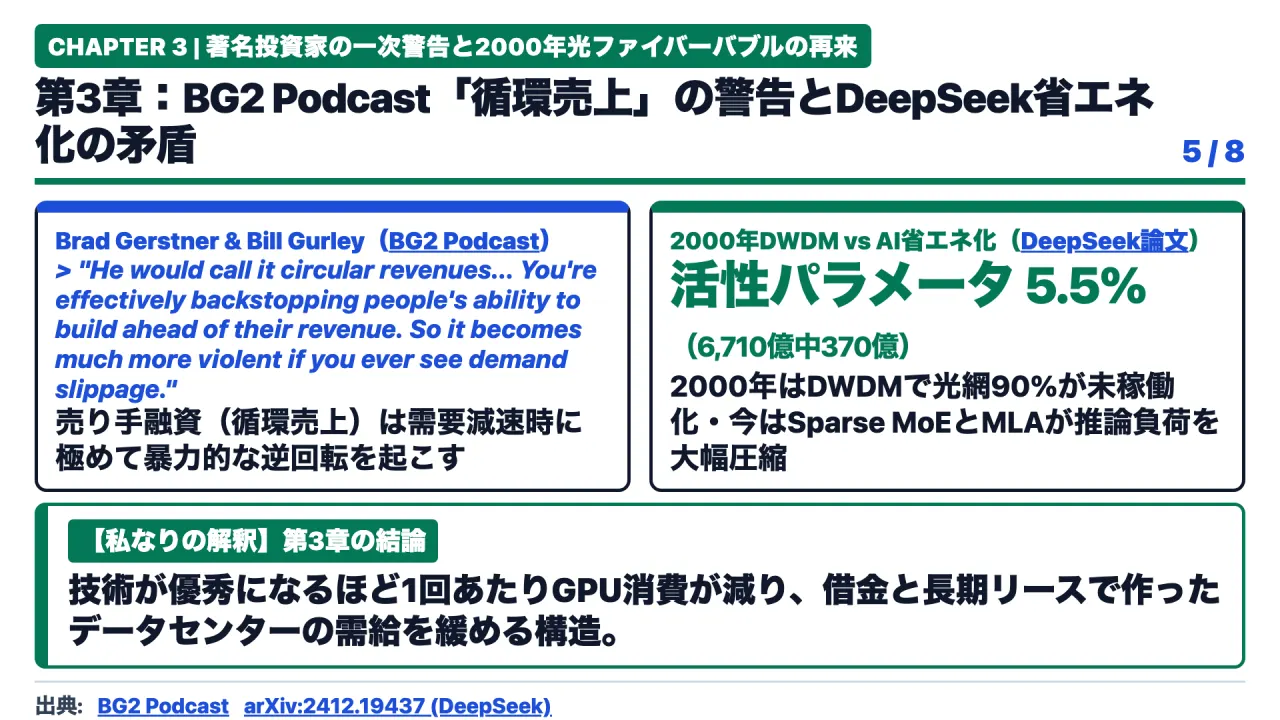
On the venture podcast BG2, seasoned technology investors Brad Gerstner and Bill Gurley issued severe warnings regarding the mechanics of vendor financing:
“It is unbelievable that market participants accept this scale of seller financing so casually. It is circular revenue. It injects synthetic leverage across the entire technology ecosystem by backstopping infrastructure construction for startups before commercial demand materializes. If end-user demand softens, the correction will be violent.”
Gurley drew direct historical parallels to the 1999-2001 telecommunications collapse. During that era, equipment vendors like Lucent and Nortel extended vendor financing to emerging carriers (Global Crossing, WorldCom), funding $500 billion in debt-financed optical networks.
When Dense Wavelength Division Multiplexing (DWDM) expanded data transmission efficiency tenfold, bandwidth prices collapsed. Over 90 percent of newly laid fiber became dormant “dark fiber,” triggering historic corporate bankruptcies.
A parallel dynamic is emerging in AI software. As detailed in the DeepSeek-V3 Technical Report (arXiv:2412.19437), algorithmic innovations—such as Sparse Mixture-of-Experts (MoE) activating only 37 billion out of 671 billion parameters and Multi-head Latent Attention (MLA)—drastically lower compute requirements per inference token. As software efficiency advances exponentially, hardware capacity requirements may decelerate, challenging debt-financed capacity projections.
4. Analytical Takeaways: Deconstructing the Duration Mismatch
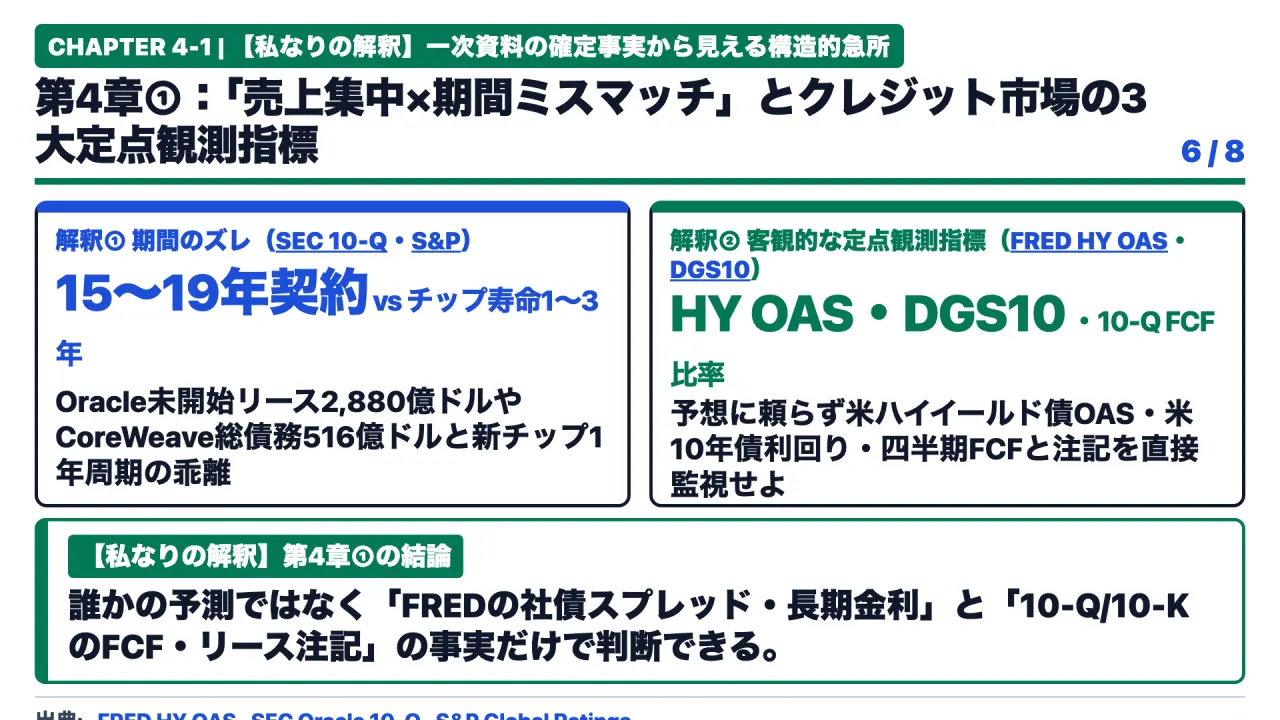
Synthesizing verified SEC disclosures and macroeconomic indicators reveals that the central risk in the AI ecosystem is not technological invalidity, but a fundamental duration mismatch:
- Liability Duration (5 to 19 Years): Operators sign non-cancellable, 15- to 19-year data center master leases and multi-year credit agreements at fixed rates or SOFR-pegged floating spreads.
- Asset Utility Duration (1 to 2 Years): Physical computing platforms turn over rapidly (NVIDIA Hopper to Blackwell to Rubin), degrading the rental pricing power of prior-generation clusters.
- Counterparty Cash Flow Duration (Short-Term & Subsidized): Foundation model laboratories fund operational compute consumption through venture equity injections and commercial equity-for-compute credits, lacking proven self-sustaining cash conversion.
The Three Leading Credit Indicators
Enterprise leadership should track three objective public indicators to monitor systemic capital conditions:
- FRED High-Yield Spread (BAMLH0A0HYM2): Tracks the option-adjusted spread on U.S. high-yield corporate credit. Widening spreads signal contracting liquidity for debt-dependent infrastructure operators.
- Benchmark Cost of Capital (DGS10 & SOFR): The 10-Year Treasury Yield and Secured Overnight Financing Rate dictate interest burdens for debt facilities like CoreWeave’s SOFR+2.25% loan.
- Hyperscaler CapEx-to-OCF Ratios and Note 9 Disclosures: Track quarterly Form 10-Q filings for Alphabet, Microsoft, and Oracle to monitor when capital spending overtakes operating cash generation.
5. Enterprise Action Framework and the Impact of Global Rate Adjustments
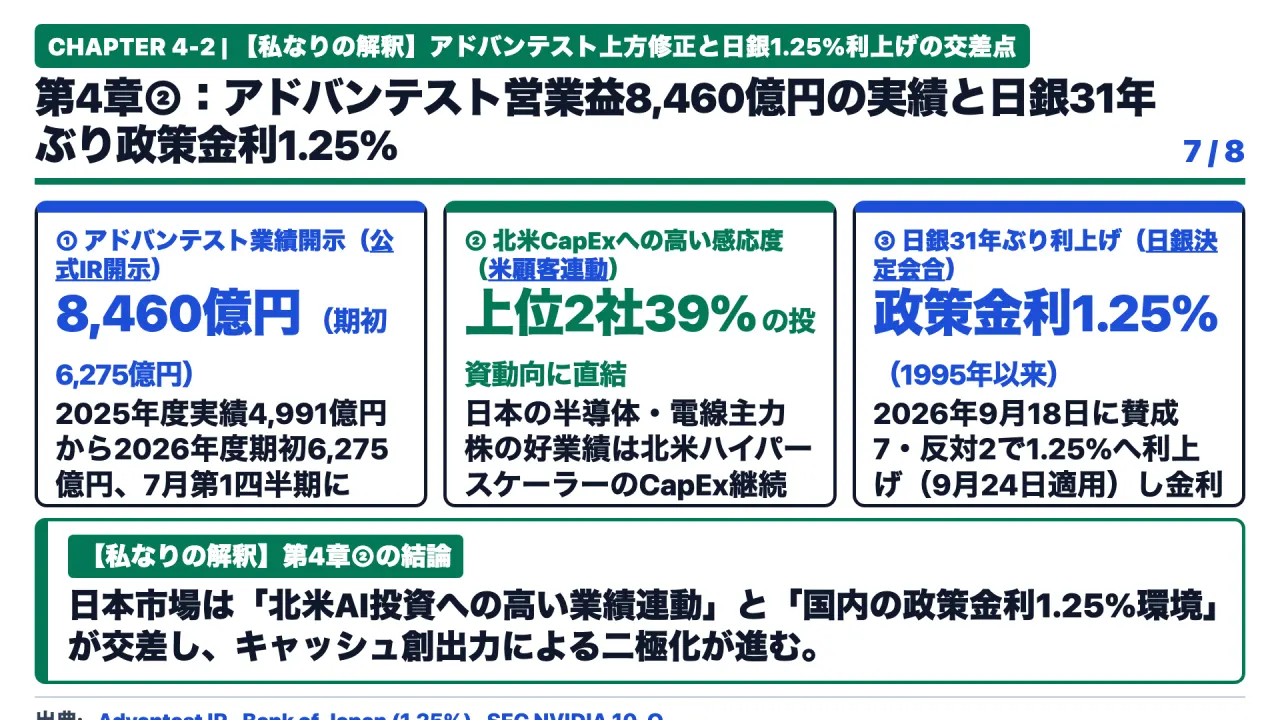

While North American hyperscalers expand debt obligations, international monetary environments are shifting. On September 18, 2026, the Bank of Japan raised its uncollateralized overnight call rate target from 1.0 percent to 1.25 percent (effective September 24, 2026)—its highest policy rate since April 1995.
In this macro environment, Japanese semiconductor supply chain leaders like Advantest (6857) have seen fiscal 2026 operating income estimates revised upward from 499.1 billion yen to 846.0 billion yen, directly capturing North American hyperscaler CapEx. However, rising domestic borrowing costs demand rigorous corporate cash flow selectivity.
Enterprise infrastructure teams should execute three strategic actions:
1. Mandate Free Cash Flow and Lease Diligence on Cloud Vendors
Look past headline non-GAAP earnings. Scrutinize cloud vendor balance sheets for free cash flow deficits, uncommenced lease liabilities, and debt maturities to gauge supplier insolvency risks and impending price escalations.
2. Diversify Portfolios Across Cash-Rich Domestic Balance Sheets
Capital allocation must balance exposure to capital-intensive AI suppliers with investments in cash-rich, low-debt corporate enterprises that benefit directly from normalized interest rate regimes.
3. Deploy Open, High-Efficiency Architectures to Prevent Infrastructure Lock-In
Architect internal AI applications using open-weights models and modular inference frameworks. Decoupling corporate software from single-cloud proprietary APIs ensures organizations can switch to cost-effective on-premises clusters or efficient open-weight models as cloud token prices fluctuate.
Primary Sources and References
- US SEC EDGAR: NVIDIA Corporation Form 10-Q (Q2 FY2026 Note 13)
- US SEC EDGAR: NVIDIA Corporation Form 10-K (FY2026 Note 12 Commitments and Contingencies)
- US SEC EDGAR: CoreWeave, Inc. Form 10-Q (Q2 2026)
- CoreWeave: $8.5B Delayed Draw Term Loan (DDTL 4.0) & Q2 2026 Financial Results
- Blackstone: CoreWeave $2.3B & $7.5B Debt Financing Facilities
- Lambda Labs: $926M GPU-Backed Financing
- BlackRock: AI Infrastructure Partnership (AIP) $100B Mobilization & Aligned Data Centers Acquisition
- US SEC EDGAR: Alphabet Inc. Form 10-Q (Q2 2026)
- Alphabet Investor Relations: Q2 2026 Earnings Release
- US SEC EDGAR: Oracle Corporation Form 10-Q & 10-K (Note 9 Leases & RPO)
- S&P Global Ratings: Oracle Corp. Downgraded To ‘BBB-’ On Heavy AI CapEx
- US SEC EDGAR: Microsoft Corporation Form 10-K (Server Useful Life Extension 4 to 6 Years)
- FRED / US BEA: Private Fixed Investment in Information Processing Equipment and Software (A679RC1Q027SBEA)
- FRED: 10-Year Treasury Constant Maturity Rate (DGS10)
- FRED: ICE BofA US High Yield Index Option-Adjusted Spread (BAMLH0A0HYM2)
- Bank of Japan: Statement on Monetary Policy (September 18, 2026 Policy Rate Decision to 1.25%)
- Advantest Investor Relations: FY2026 Consolidated Financial Results
- BG2 Podcast (Brad Gerstner & Bill Gurley): AI CapEx, Seller Financing & Circular Revenues
- DeepSeek-AI: DeepSeek-V3 Technical Report (arXiv:2412.19437)