Why Alphabet Lost $470B in Market Cap Despite Surpassing a $500B Revenue Run-Rate and Doubling Google Cloud ── Inside Search "AI Mode" RPM Dilution and TPU Inventory Accounting
YouTube (Japanese audio): https://youtu.be/yRJpyfA_aoM
Executive Summary & Key Takeaways
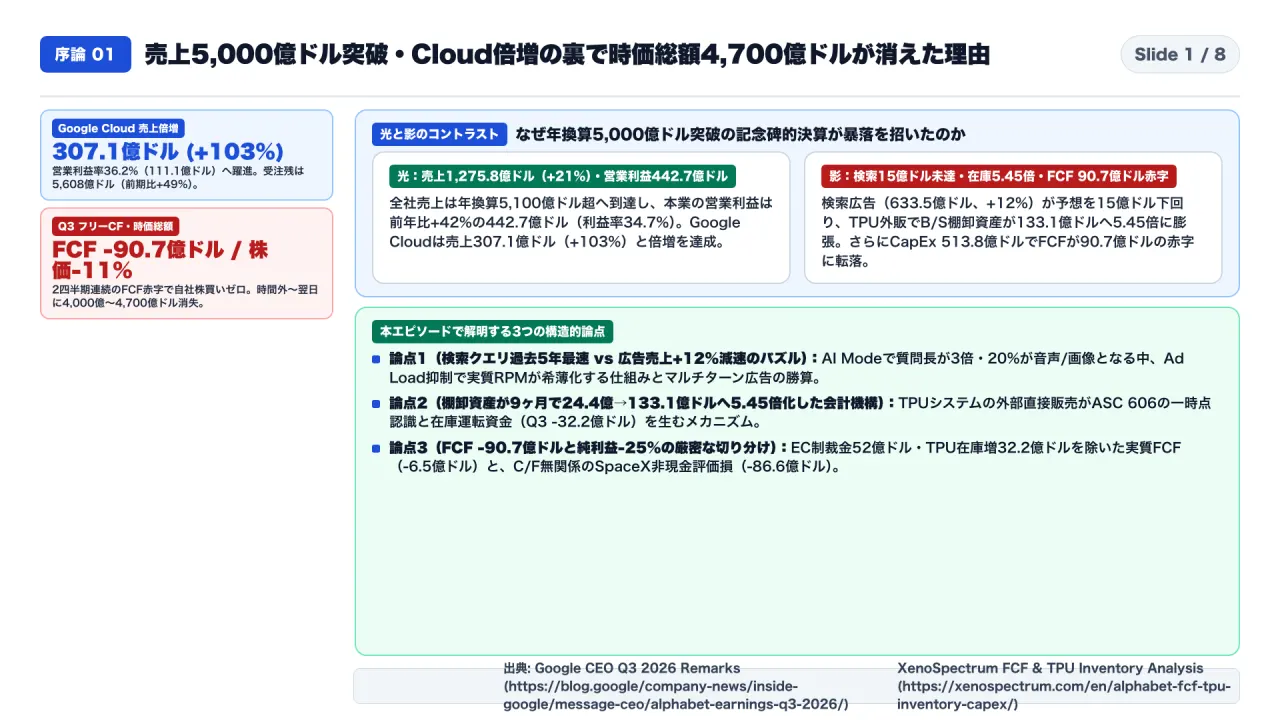
- Core Thesis: On October 28, 2026, Alphabet (NASDAQ: GOOGL) reported a historic milestone in its Q3 2026 results: quarterly revenue reached $127.577 billion (+16% YoY)—crossing the $500 billion annualized revenue run-rate for the first time—while Google Cloud revenue more than doubled (+103% YoY) to $30.709 billion with a record 36.2% operating margin ($11.116B operating income) and a $560.8 billion backlog (+148% YoY). Yet instead of celebrating, Wall Street wiped out $400 billion to $470 billion in Alphabet’s market capitalization from its recent peak. A forensic audit of Alphabet’s Q3 Form 10-Q and earnings call transcript reveals three structural culprits behind the sell-off: (1) Search “AI Mode” RPM Dilution, where query volume grew at its fastest pace in 5 years (with 3x longer prompts and 20% multimodal inputs), but deliberate ad-load restraint held Google Search & Other revenue to $63.35 billion (+12% YoY = +8% paid clicks × +4% CPC), missing consensus by $1.5 billion; (2) ASC 606 TPU Inventory Working-Capital Drain, where selling custom TPU clusters directly to external customers (such as Anthropic) required capitalizing hardware into Balance Sheet Inventories—which exploded 5.45x in 9 months from $2.439B to $13.310B—draining -$3.22 billion from Q3 operating cash flow before a single dollar of point-in-time revenue could be recognized upon physical customer acceptance; and (3) Two Consecutive Quarters of Negative Free Cash Flow (-$9.07 billion in Q3) on $51.4 billion in cash CapEx, forcing Alphabet to pause share buybacks ($0 in Q3), issue $12.4 billion in new equity via an At-The-Market (ATM) program, and raise $14 billion in USD/EUR bonds.
- Who Should Read This: Search and digital advertising strategists, AI hardware and cloud infrastructure architects, CPA/financial analysts covering Big Tech accounting under ASC 606 / ASC 321, and institutional tech investors.
- Key Architectural & Financial Takeaways:
- Why conversational AI Mode queries (averaging 3x traditional keyword length) break the 25-year “10 blue links” auction model, and how Google’s new Multi-Turn Contextual Ads aim to close the RPM gap.
- The exact accounting divergence between internal TPUs (CapEx on Cash Flow from Investing) and external TPU sales (Inventory on Cash Flow from Operations under ASC 606 Point-in-Time recognition).
- How to separate Alphabet’s -$9.07B headline FCF deficit into one-off/timing items ($5.2B EC fine + $3.22B TPU inventory build = -$0.65B normalized FCF) versus its -$8.66B non-cash equity markdown (SpaceX valuation adjustment = -$0.55 EPS impact, $0 cash impact).
Background & Primary Sources Verified
This investigation cross-verifies 11 primary SEC filings, earnings releases, and institutional analyses from October 28–30, 2026:
- 1. Alphabet Q3 2026 Form 10-Q & Earnings Release (Oct 28, 2026): Alphabet Investor Relations / SEC EDGAR Filings
- 2. Financial & Cloud Segment Breakdown: NextGComm: Alphabet Q3 2026 Financial Results Analysis / VLSI Research: Alphabet & Microsoft Q3 2026 — 13 Facts
- 3. Free Cash Flow, $51.4B CapEx & Balance Sheet Inventory Analysis: InsiderFinance: Alphabet Free Cash Flow Sinks to -$9.1B After $51.4B CapEx Surge
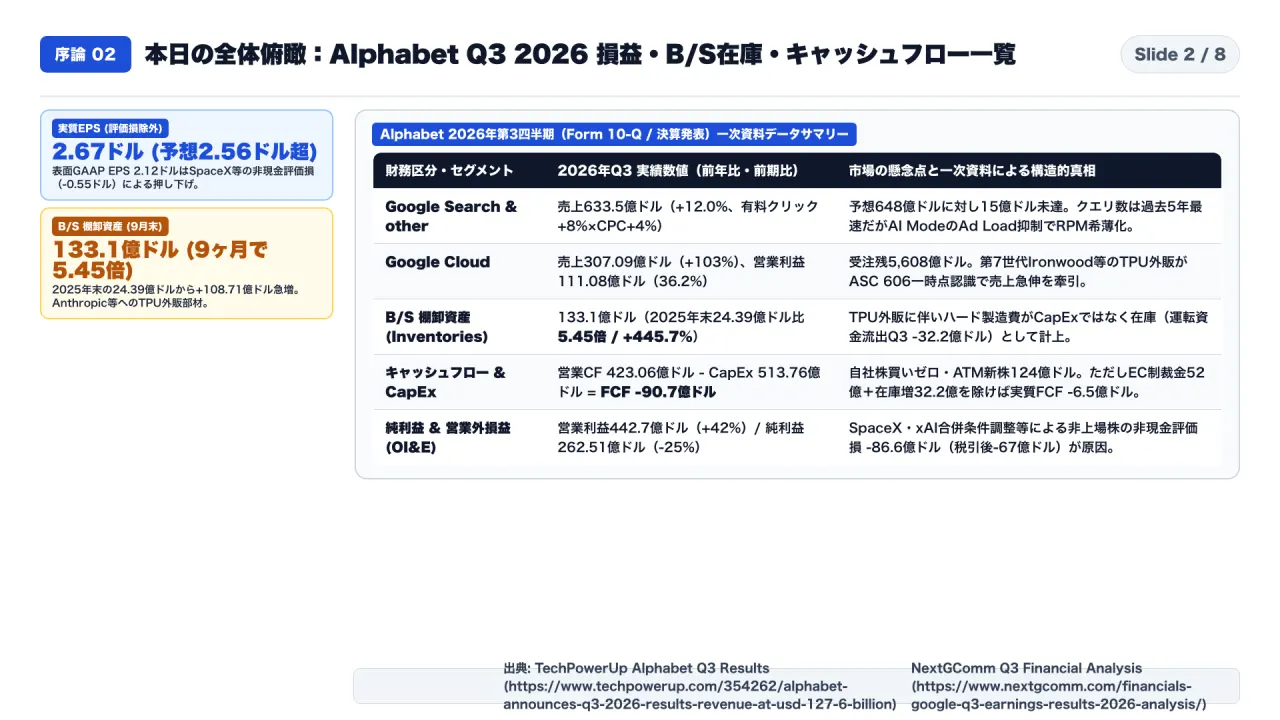
| Financial / Operational Dimension | Q3 2026 Reported Figure | Market Expectation / Prior Baseline | Structural Mechanism & Accounting Reality |
|---|---|---|---|
| Consolidated Revenue & Run-Rate | $127.577B (+16% YoY) (> $500B/yr run-rate) | Beat consolidated top-line | Driven by Cloud doubling (+103%), offset by Search & YouTube ad misses |
| Google Search & Other Revenue | $63.35B (+12% YoY) (Paid Clicks +8% × CPC +4%) | $64.85B consensus (-$1.5B miss); down from +15% YoY in Q2 | Query volume grew at 5-year high via AI Mode, but deliberately lower Ad Load diluted effective RPM |
| YouTube Advertising Revenue | $11.38B (+10.9% YoY) | -$390M below consensus | Tough YoY political ad comps plus living-room CTV interactive ad transition |
| Google Cloud Revenue & Backlog | $30.709B (+103% YoY) / Op Inc $11.116B (36.2% margin) | RPO backlog surged +148% YoY to $560.8B | Massive AI infrastructure & Workspace uptake plus multi-gigawatt external TPU system sales |
| B/S Inventories (TPU Hardware) | $13.310B (as of Sep 30, 2026) | Up 5.45x from $2.439B (Dec 31, 2025); -$3.22B Q3 OCF hit | External TPU clusters must be carried as Inventory until physical delivery & customer acceptance under ASC 606 |
| Free Cash Flow & Capital Financing | -$9.07B FCF (OCF $42.3B − CapEx $51.4B) | 2nd consecutive negative FCF quarter (FY26 CapEx $125B–$135B) | Normalized FCF is -$0.65B ex-$5.2B EC fine & $3.22B TPU inventory; funded via $12.4B ATM equity + $14B bonds |
| Non-Cash Equity Security Loss | -$8.66B (OI&E) → Net Income $29.58B ($2.45 EPS) | Ex-markdown Net Income $36.32B ($3.00 EPS) | Unrealized mark-to-market adjustment on private holdings (SpaceX) under ASC 321; zero cash impact |
1. The Search “AI Mode” RPM Paradox: Why 5-Year Record Query Growth Produced a $1.5 Billion Revenue Miss
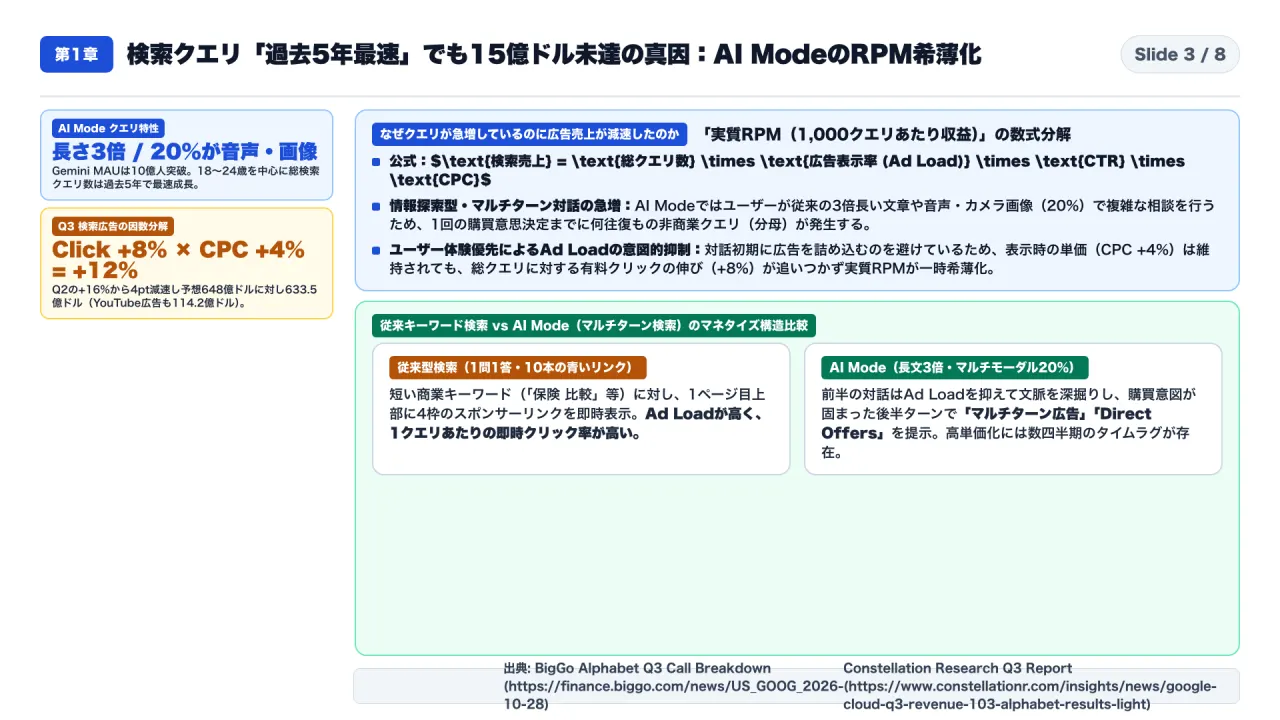
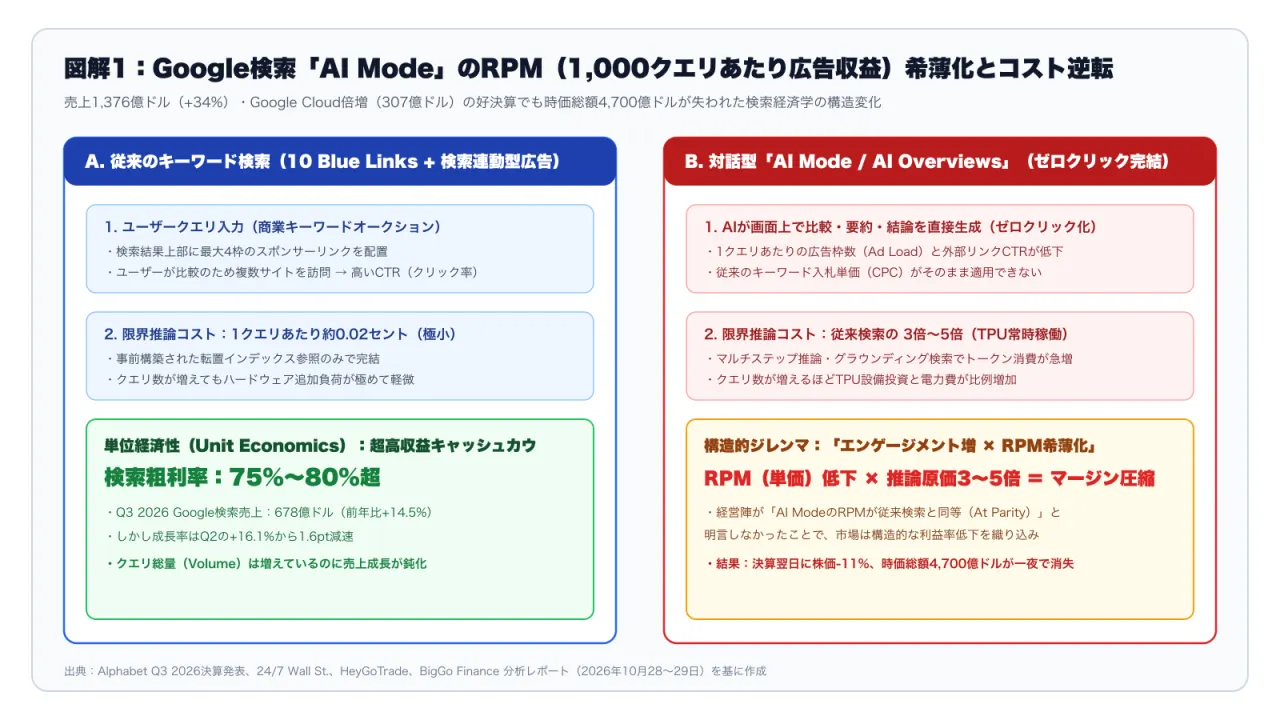
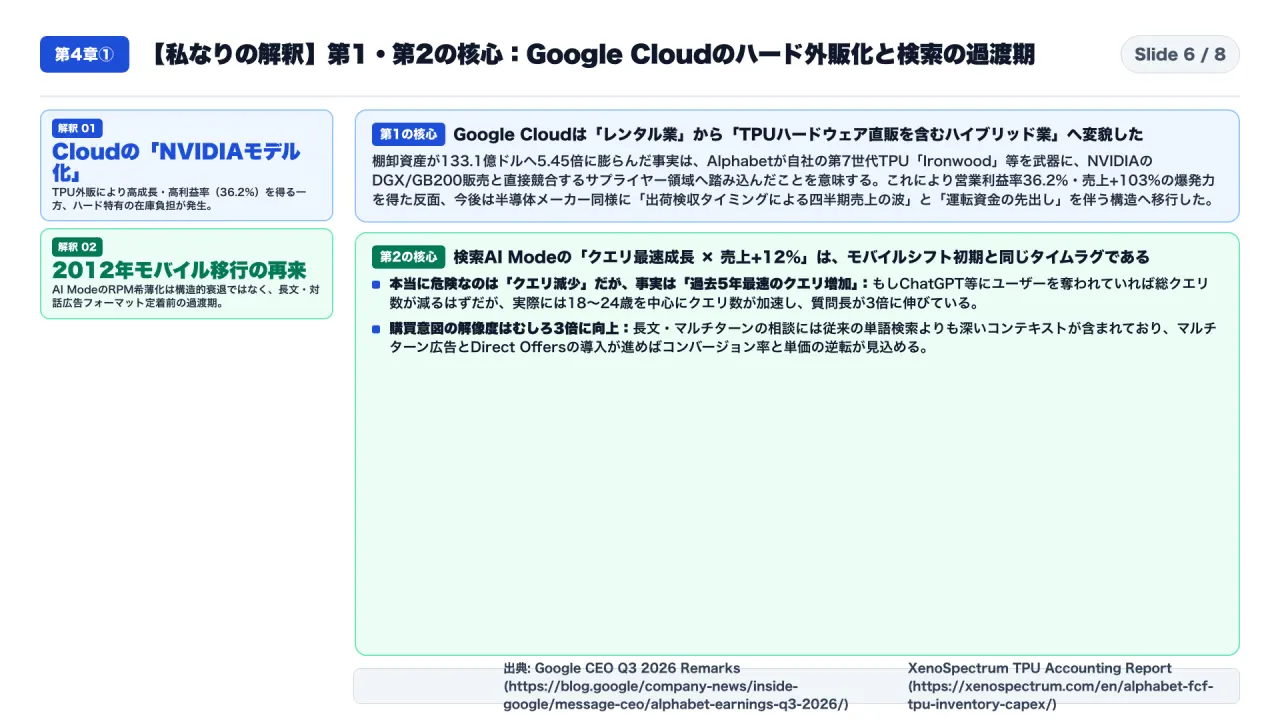
On the Q3 earnings call, CEO Sundar Pichai emphasized that AI Overviews (now reaching over 2 billion monthly users) and the conversational AI Mode drove the fastest search query volume growth in 5 years. Specifically, users in AI Mode submit prompts that are 3x longer than traditional keyword searches, and roughly 20% of AI Mode queries are multimodal (combining voice, camera images via Google Lens, and complex follow-up questions).
Why, then, did Google Search & Other revenue decelerate from +15% YoY in Q2 to +12% YoY in Q3 ($63.35B), missing Wall Street consensus by $1.5 billion?
1-1. Decomposing the Revenue Equation: Search Revenue = Queries × Ad Load × CTR × CPC
- Paid Clicks (+8% YoY) × Cost-Per-Click (+4% YoY) = +12% Revenue: While query volume surged—especially among younger users aged 18–24—the percentage of queries displaying commercial ad slots (Ad Load) was intentionally throttled inside AI Mode to prevent degrading user trust during early rollout.
- Zero-Click Resolution vs. High-Intent Commercial Auctions: In the classic “10 blue links” interface, a user researching software, travel, or insurance clicked 3 to 4 sponsored links to synthesize an answer. In AI Mode, Gemini synthesizes the comparison table directly inside the viewport. Even when commercial intent is higher, fewer external clicks occur on the initial turn—diluting Revenue Per Thousand Queries (RPM).
- Google’s Counter-Strategy (Multi-Turn Contextual Ads): Management outlined a roadmap to embed native sponsored recommendations inside multi-turn follow-up dialogues (e.g., when a user asks an informational question first and narrows down to a purchase decision on turn 3). Until multi-turn ad load scales in 1H 2027, Search growth faces a near-term monetization air pocket.
2. The ASC 606 TPU Inventory Trap: Why Google Cloud’s +103% Boom Drained $3.22B from Operating Cash Flow
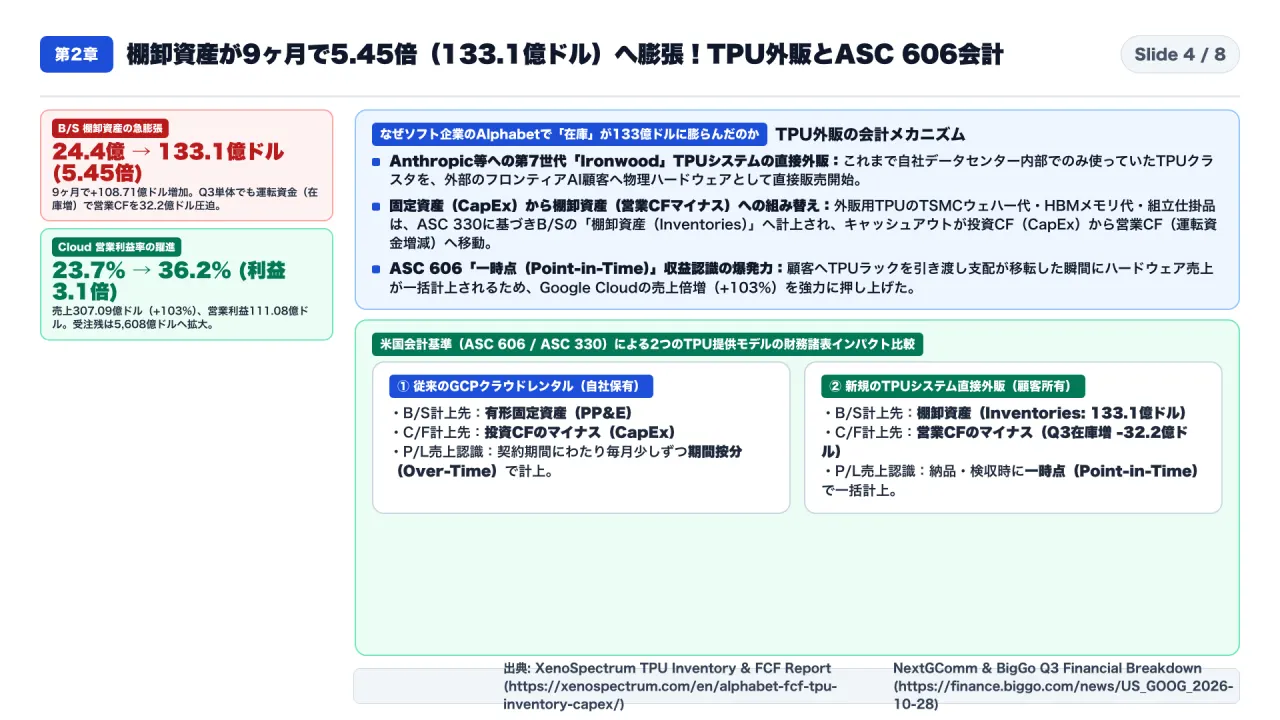
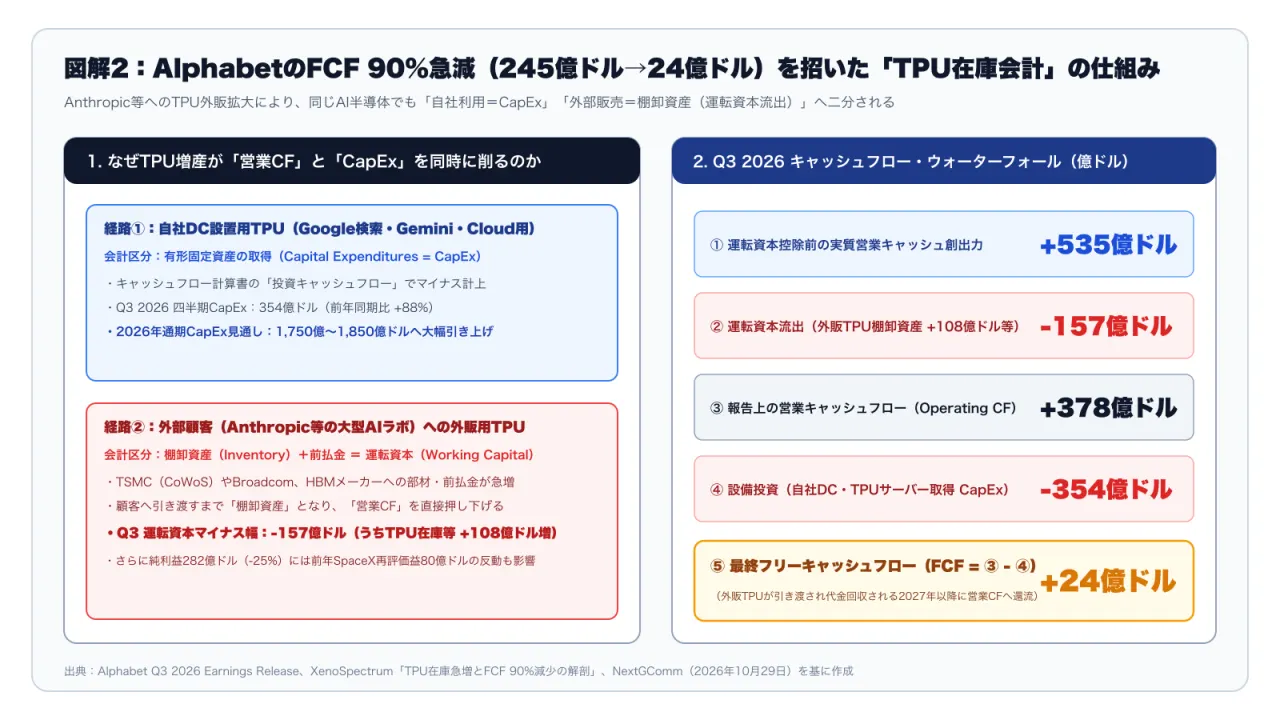
The most misunderstood line item in Alphabet’s Q3 2026 Form 10-Q sits on the Balance Sheet: Inventories skyrocketed 5.45x in just nine months, rising from $2.439 billion (December 31, 2025) to $13.310 billion (September 30, 2026)—consuming -$3.22 billion in operating cash flow in Q3 alone.
2-1. Internal Cloud TPUs (CapEx / Investing CF) vs. External Customer TPU Sales (Inventory / Operating CF)
Why does a cloud company suddenly carry $13.31 billion in physical inventory? Because Alphabet has expanded beyond renting TPU compute by the hour on Google Cloud to selling multi-gigawatt custom TPU hardware systems directly to frontier AI labs (such as Anthropic) and sovereign/enterprise data centers:
- Case A: TPUs Deployed Inside Google’s Own Data Centers: Accounted for as Property and Equipment (CapEx, $51.4B in Q3) under Cash Flows from Investing Activities. They do not reduce Operating Cash Flow (OCF).
- Case B: TPU Systems Manufactured for Direct Sale to External Customers: Under U.S. GAAP, HBM memory stacks, optical interconnects, liquid-cooling racks, and TSMC wafer costs for external TPU orders must be capitalized as Work-in-Process / Finished Goods Inventory on the Balance Sheet, which is a direct cash outflow inside Cash Flows from Operating Activities (Working Capital) as components are procured.
- The ASC 606 Point-in-Time Recognition Lag: Under ASC 606 (Revenue from Contracts with Customers), revenue and customer cash collection for hardware system sales cannot be recognized over time during assembly; they are recognized at a Point in Time—only after the entire multi-rack TPU cluster is physically delivered, installed, and formally accepted at the customer’s site. Thus, Q3 absorbed the full cash outflow of building the TPU inventory, while the corresponding revenue and cash inflow are deferred into Q4 2026 and 1H 2027.
3. Forensic Cash Flow & P/L Reconciliation: Separating the -$9.07B FCF Deficit from the -$8.66B SpaceX Markdown
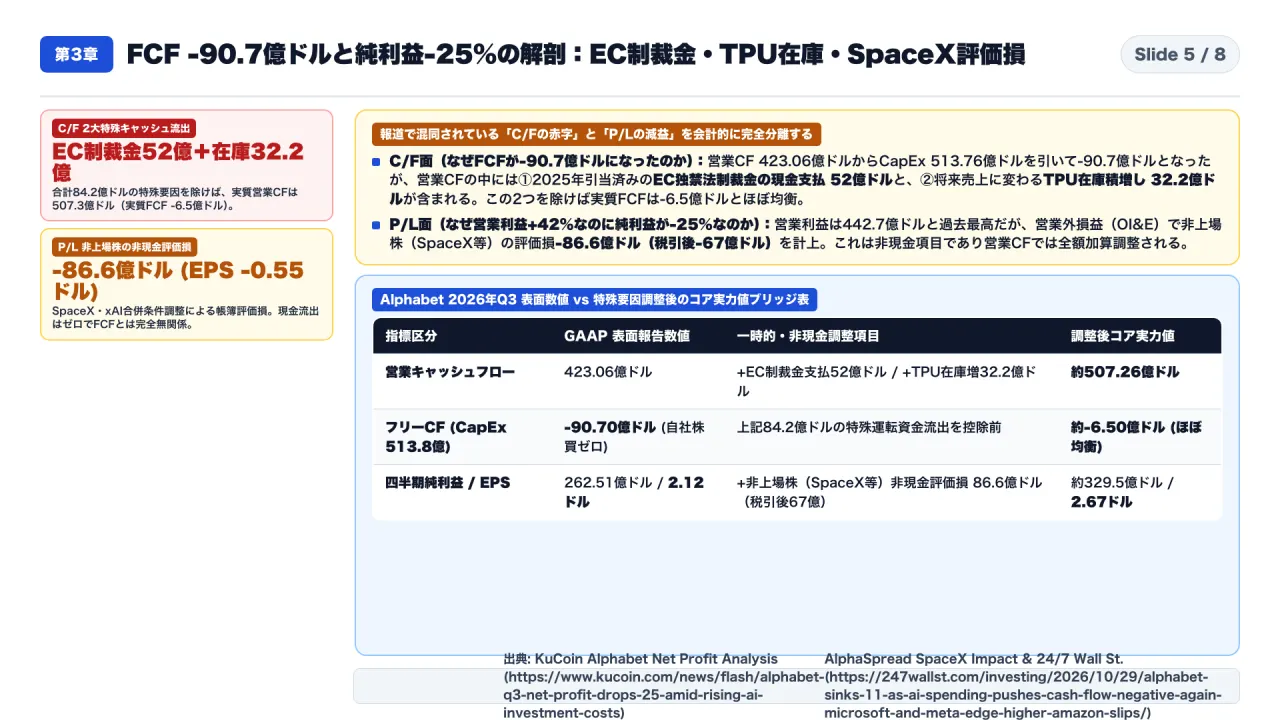
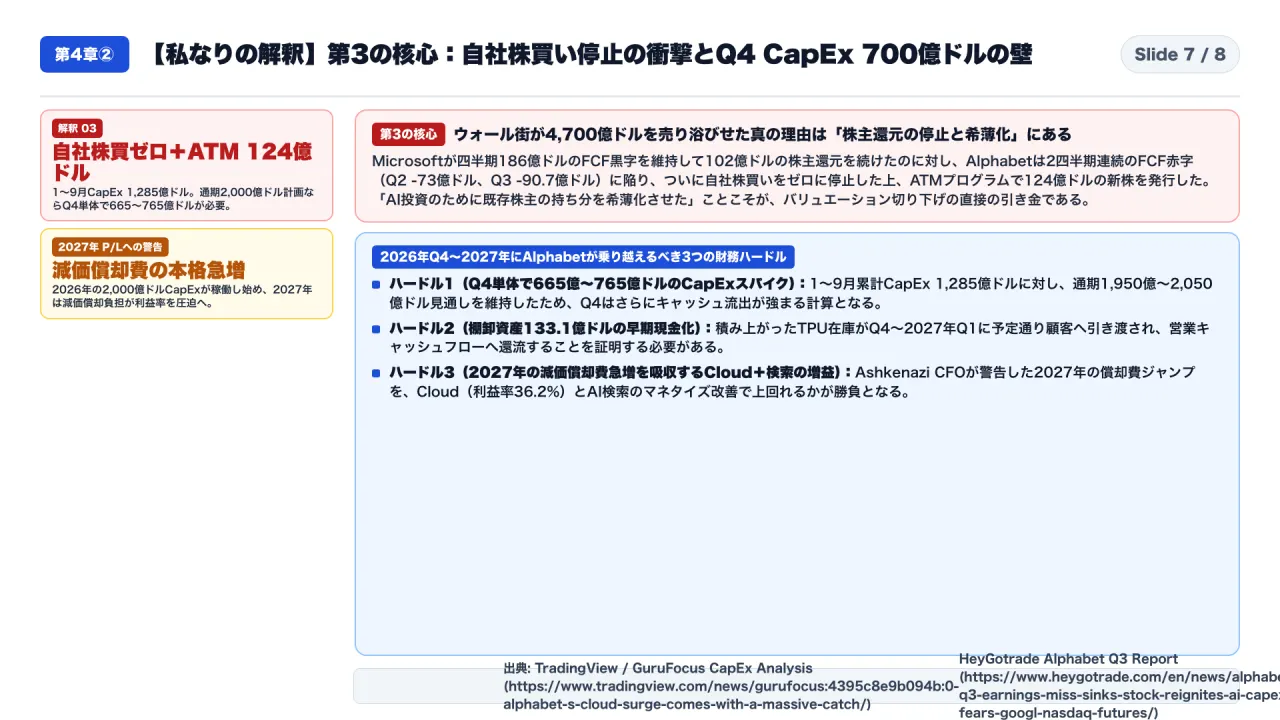
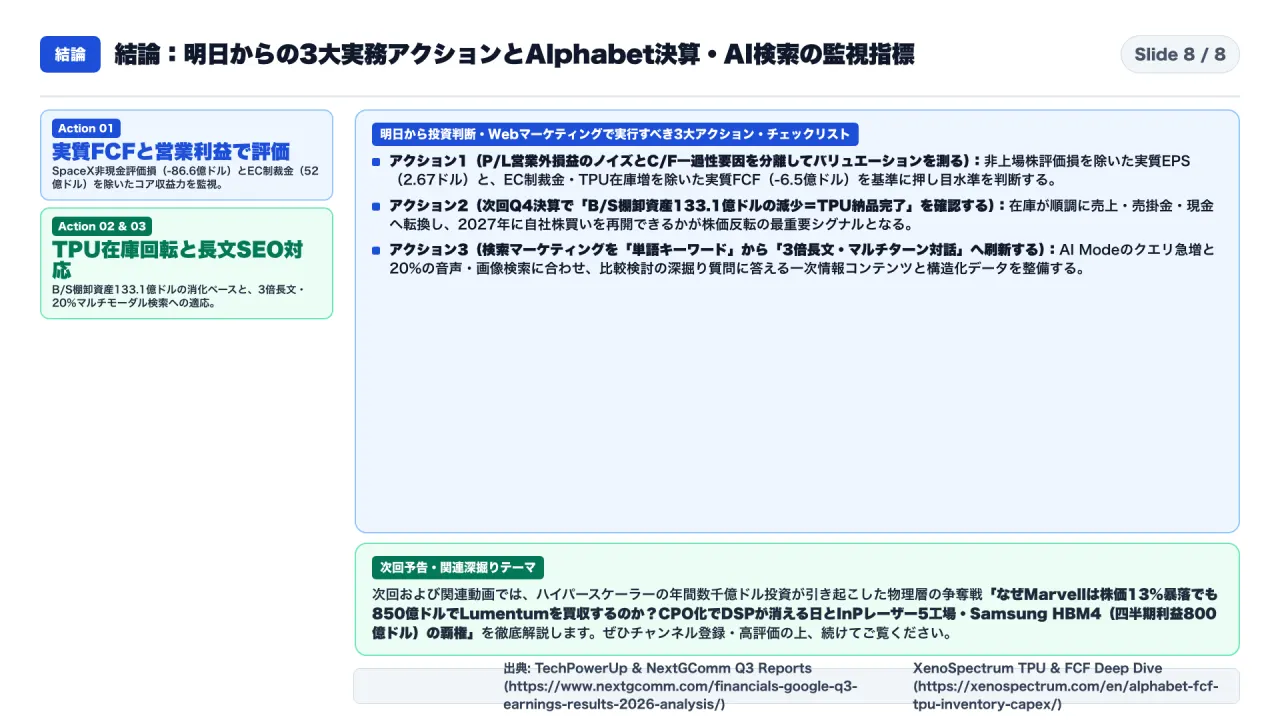
To avoid conflating temporary accounting lags with structural cash burn, separate Alphabet’s Q3 numbers into three buckets:
- 1. Headline FCF (-$9.07B) vs. Normalized Operational FCF (-$0.65B):
- Reported Q3 Operating Cash Flow ($42.3B) minus Cash CapEx ($51.4B) equals -$9.07B FCF.
- However, Q3 OCF was depressed by two non-recurring/timing outflows: the $5.20B European Commission antitrust fine payment and -$3.22B in TPU inventory buildup. Adding back those $8.42B yields a normalized operational FCF of -$0.65B—virtually break-even even while funding a $200B+ annualized CapEx run-rate.
- 2. The -$8.66B Non-Cash Marketable/Non-Marketable Equity Markdown (SpaceX):
- On the Income Statement, Other Income & Expense (OI&E) recorded a -$8.66 billion loss (primarily an unrealized mark-to-market valuation adjustment on Alphabet’s private stake in SpaceX under ASC 321).
- This reduced GAAP Net Income from $36.32B ($3.00 EPS) to $29.58B ($2.45 EPS, a -$0.55/share hit)—but had zero impact ($0) on Operating Cash Flow or Free Cash Flow.
- 3. Three Concrete Checkpoints for Q4 2026 & 2027:
- Checkpoint 1 (Inventory Turnover): Watch whether B/S Inventories ($13.31B) peak and convert into Accounts Receivable and cash collections as external TPU clusters pass customer acceptance.
- Checkpoint 2 (Search Paid Clicks × CPC Spread): Monitor whether multi-turn ad formats in AI Mode lift Search revenue growth back above +13%–14% YoY.
- Checkpoint 3 (Share Dilution vs. Buyback Resumption): Track whether Alphabet resumes share repurchases after pausing them at $0 in Q3 while issuing $12.4B in ATM equity.
Primary Sources & References
- Alphabet Investor Relations: Q3 2026 Earnings Release & Form 10-Q (Oct 28, 2026)
- NextGComm: Alphabet Q3 2026 Financial Results Analysis (Cloud +103%, TPUs & AI CapEx)
- VLSI Research: Alphabet & Microsoft Q3 2026 Earnings — 13 Facts (Cloud +103%, Search AI Mode & FCF)
- InsiderFinance: Alphabet Free Cash Flow Sinks to -$9.1B After $51.4B Q3 CapEx Surge