Why Multi-Million-Dollar GPU Clusters Sit Idle Waiting on CPU Instructions: Inside PyTorch CUDA Graph Replay and 4,096-GPU Scaling
By capturing entire kernel dispatch sequences and NCCL collectives into pre-allocated memory graphs, CUDA Graphs bypass host CPU latency to compress Mask R-CNN backbones from 31 ms to 6 ms and power MLPerf world records.
Published: October 30, 2026 | Read time: ~10 min | Watch Video (Japanese)
Executive Summary: The CPU Dispatch Bottleneck at Frontier Scale
When deep learning training or large language model (LLM) inference lags, engineering teams reflexively upgrade to faster accelerators or add more GPUs. However, in small-batch workloads—such as auto-regressive token generation—and strong scaling across thousands of nodes, this strategy fails.
Technical benchmarks published by NVIDIA and Meta engineers reveal a counterintuitive structural bottleneck: as accelerators grow faster and workloads are partitioned across more devices, individual GPU kernel runtimes shrink to mere microseconds. Consequently, host CPU dispatch overhead—traversing Python, C++ metadata validation, and the CUDA driver—cannot keep pace, leaving multi-million-dollar GPU clusters idle for substantial fractions of total execution time.
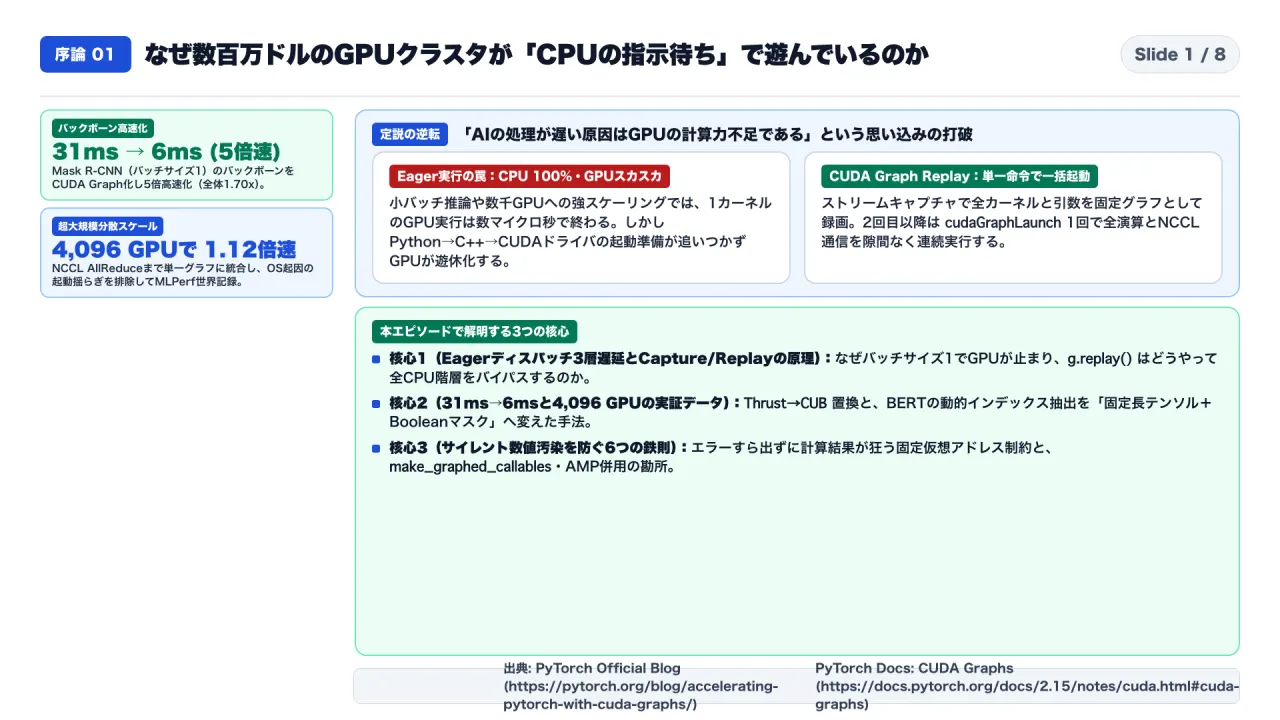
The primary solution embedded within modern inference engines (including vLLM, SGLang, and TensorRT-LLM) is CUDA Graphs (torch.cuda.CUDAGraph). By capturing an entire execution graph—including compute kernels, memory allocations, and NCCL communication—during an initial warmup pass, CUDA Graphs enable subsequent iterations to replay the sequence via a single host invocation (cudaGraphLaunch).
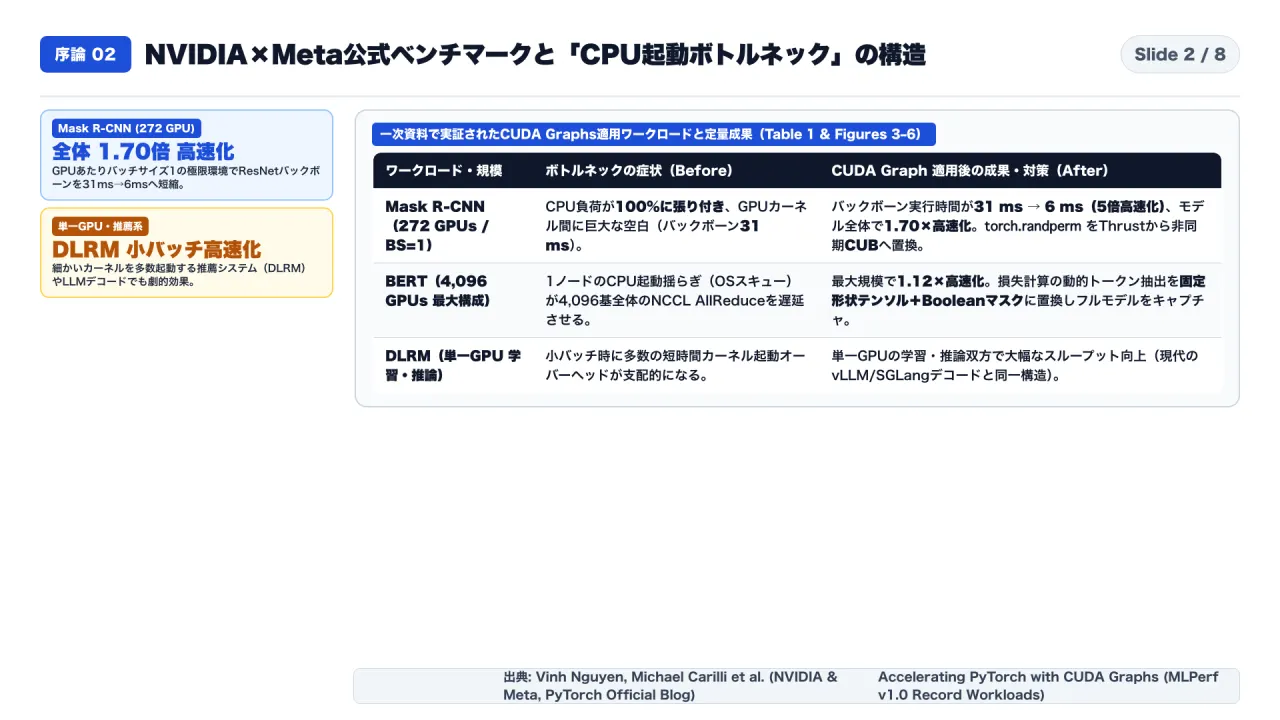
Empirical results from NVIDIA and Meta establish the quantitative impact of eliminating host dispatch overhead across representative production workloads:
| Workload | Scale & Batch Setting | Baseline Bottleneck | Acceleration via CUDA Graphs |
|---|---|---|---|
| Mask R-CNN (ResNet Backbone) | Batch Size = 1 per GPU | CPU saturated at 100% utilization while GPU sat idle between kernels (runtime 31 ms). | Backbone compressed from 31 ms to 6 ms (5.16x speedup); GPU idle gaps eliminated. |
| Mask R-CNN (Full Model) | 272 GPUs (MLPerf v1.0) | Synchronous Thrust operations forced CPU-GPU sync, fragmenting graph scope. |
Replaced torch.randperm with asynchronous CUB; achieved 1.70x end-to-end speedup. |
| BERT (Large Language Model) | 4,096 GPUs (Max Scale) | Host OS scheduling skew delayed collectives; dynamic masked token gather broke capture. | Bundled forward, backward, and NCCL AllReduce into a single graph via Boolean masking (1.12x speedup). |
| DLRM (Recommendation) | Single GPU (Train & Infer) | Extreme dominance of short-duration embedding lookup kernels under small batches. | Substantial latency reductions across training and inference, matching LLM decode profiles. |
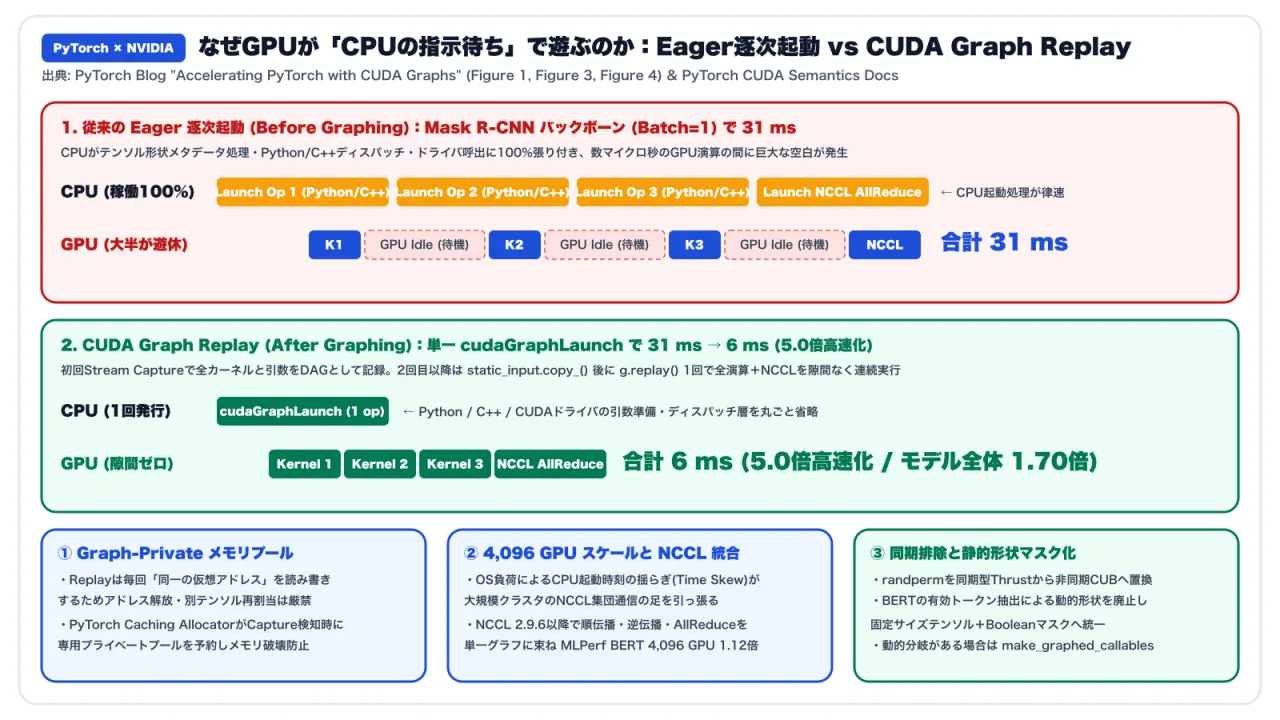
1. Anatomy of the Bottleneck: Eager Dispatch vs. Stream Capture & Replay
To understand why GPUs sit idle, one must examine the execution path of standard PyTorch eager execution.
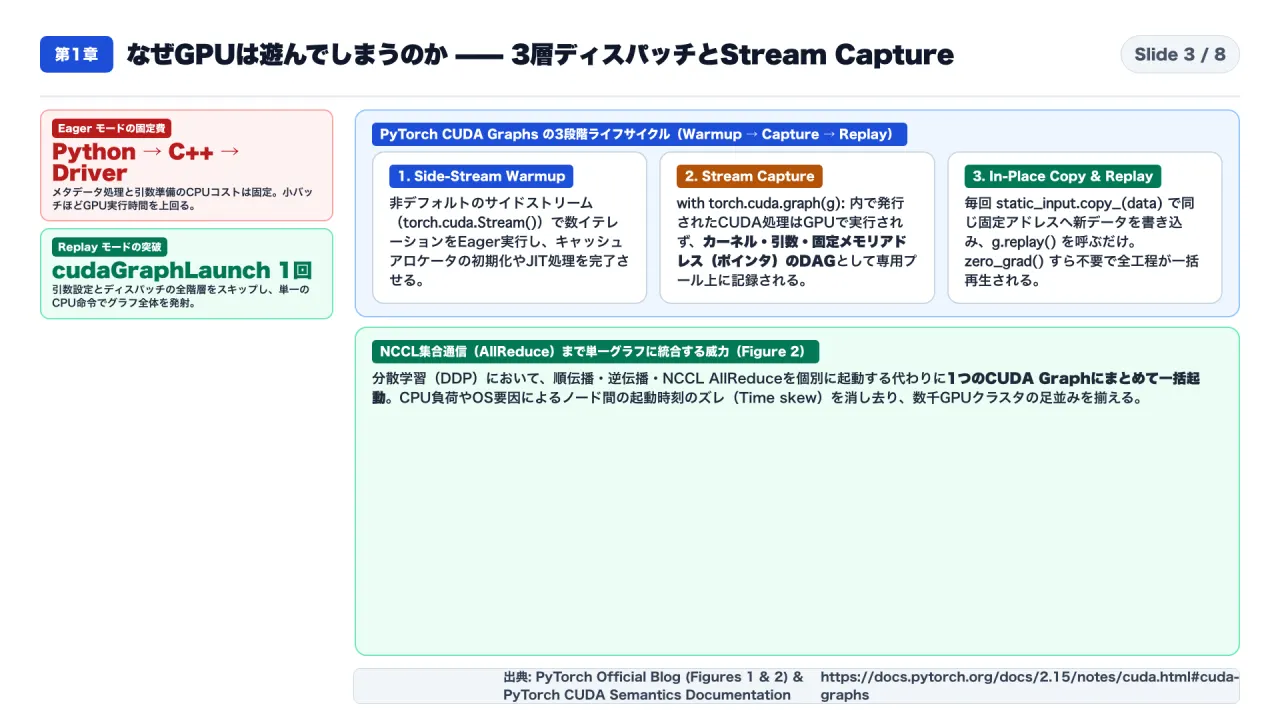
1-1. The Inverse Scaling Paradox
In PyTorch eager mode, every mathematical operation (Linear, LayerNorm, Dropout) traverses three software layers on the host CPU:
- Python Interpreter: Resolves dynamic object types and function calls.
- PyTorch C++ Dispatcher: Validates tensor shapes, strides, and layouts before selecting concrete kernels.
- CUDA Driver Layer: Enqueues arguments into command rings and issues hardware launch commands.
This architecture creates a fundamental scaling paradox: CPU dispatch latency is largely fixed per operation, whereas GPU execution duration scales directly with tensor volume.
- Large Batch Regimes: Computations take hundreds of microseconds, allowing the CPU to enqueue subsequent kernels well ahead of GPU execution.
- Small Batch / Auto-regressive Regimes: With batch size 1 or thousands of distributed GPUs, individual kernels execute in 2 to 5 microseconds. The CPU takes 10 to 15 microseconds to dispatch a kernel that executes in 3 microseconds. The CPU saturates at 100% while the GPU spends over 60% of its timeline waiting.
1-2. Stream Capture and Single-Invocation Replay
Introduced natively in PyTorch, CUDA Graphs resolve this mismatch by replacing per-kernel dispatch with an ahead-of-time execution plan.
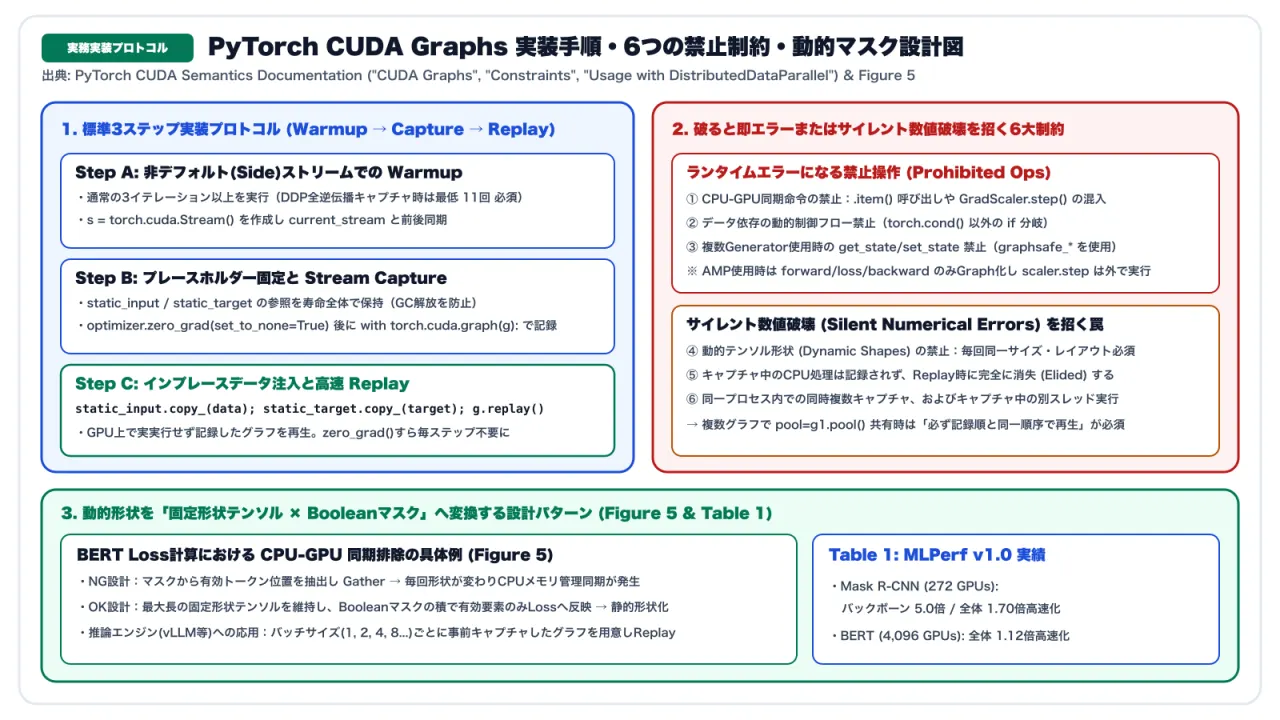
# 1. Allocate static placeholder tensors at fixed virtual addresses
static_input = torch.randn(N, D_in, device='cuda')
static_target = torch.randn(N, D_out, device='cuda')

# 2. Execute warmup iterations on a dedicated side-stream
s = torch.cuda.Stream()
s.wait_stream(torch.cuda.current_stream())
with torch.cuda.stream(s):
    for _ in range(3):
        optimizer.zero_grad(set_to_none=True)
        y_pred = model(static_input)
        loss = loss_fn(y_pred, static_target)
        loss.backward()
        optimizer.step()
torch.cuda.current_stream().wait_stream(s)

# 3. Capture execution DAG (kernels recorded, not executed)
g = torch.cuda.CUDAGraph()
optimizer.zero_grad(set_to_none=True)
with torch.cuda.graph(g):
    static_y_pred = model(static_input)
    static_loss = loss_fn(static_y_pred, static_target)
    static_loss.backward()
    optimizer.step()

# 4. Production replay loop using in-place copy
for real_data, real_targets in data_loader:
    static_input.copy_(real_data)       # Update memory in-place
    static_target.copy_(real_targets)   # Never re-assign variables
    g.replay()                          # Single driver launch for entire iteration
During stream capture, kernels are recorded into an immutable Directed Acyclic Graph (DAG) in driver memory. On subsequent iterations, calling g.replay() bypasses Python, C++, and driver validation, issuing a single cudaGraphLaunch directly onto hardware queues.
2. Empirical Case Studies: 5x Backbone Acceleration and 4,096-GPU Scale
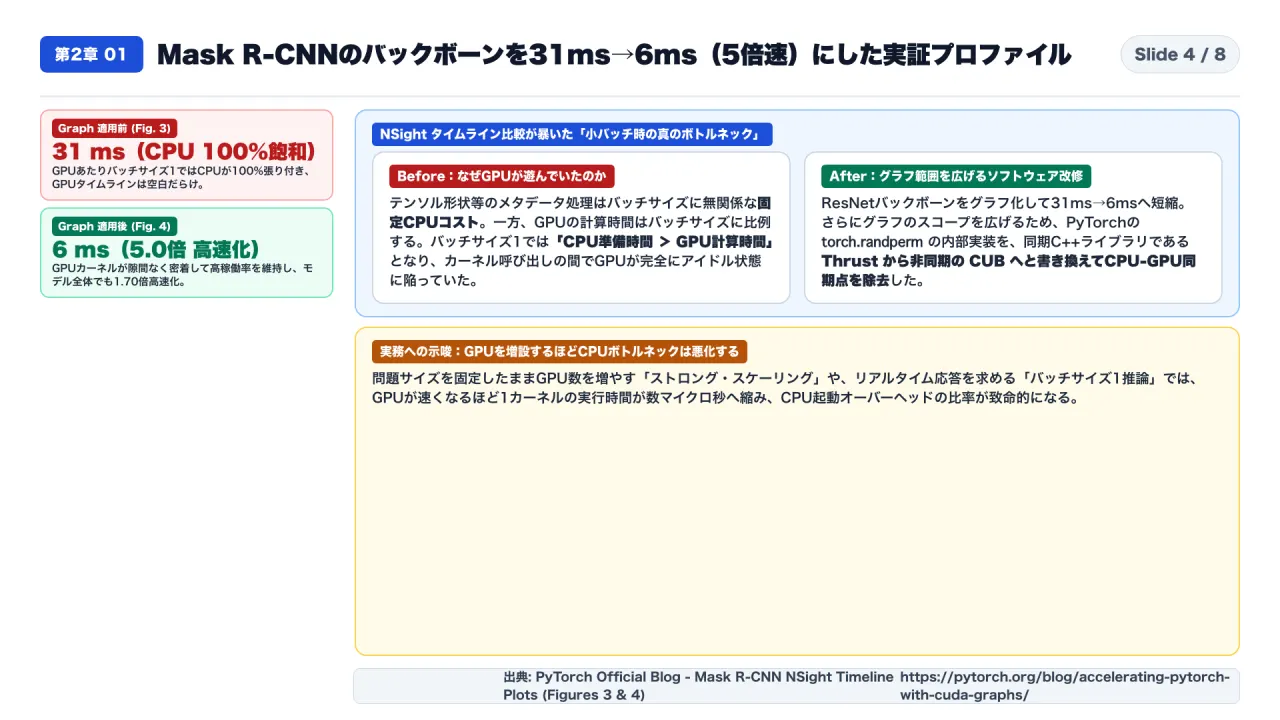
2-1. Case Study 1: Mask R-CNN Backbone (31 ms to 6 ms)
In NSight Systems profiles, executing the ResNet backbone of Mask R-CNN at batch size 1 demonstrated severe CPU starvation:
- Eager Baseline: Host CPU operated at 100% saturation, yet execution required 31 ms due to idle gaps between short-lived kernels.
- CUDA Graph Replay: Graph execution eliminated launch gaps, compressing backbone latency to 6 ms (a 5.16x speedup) with near-100% active compute density.
- Eliminating Sync via CUB: Expanding graph capture across Mask R-CNN initially failed due to internal CPU-GPU synchronizations within
torch.randperm(usingThrust). ReplacingThrustwith asynchronous primitives from NVIDIA’s CUB library eliminated host synchronization, delivering a 1.70x end-to-end speedup across 272 GPUs.
2-2. Case Study 2: 4,096-GPU BERT Pre-Training
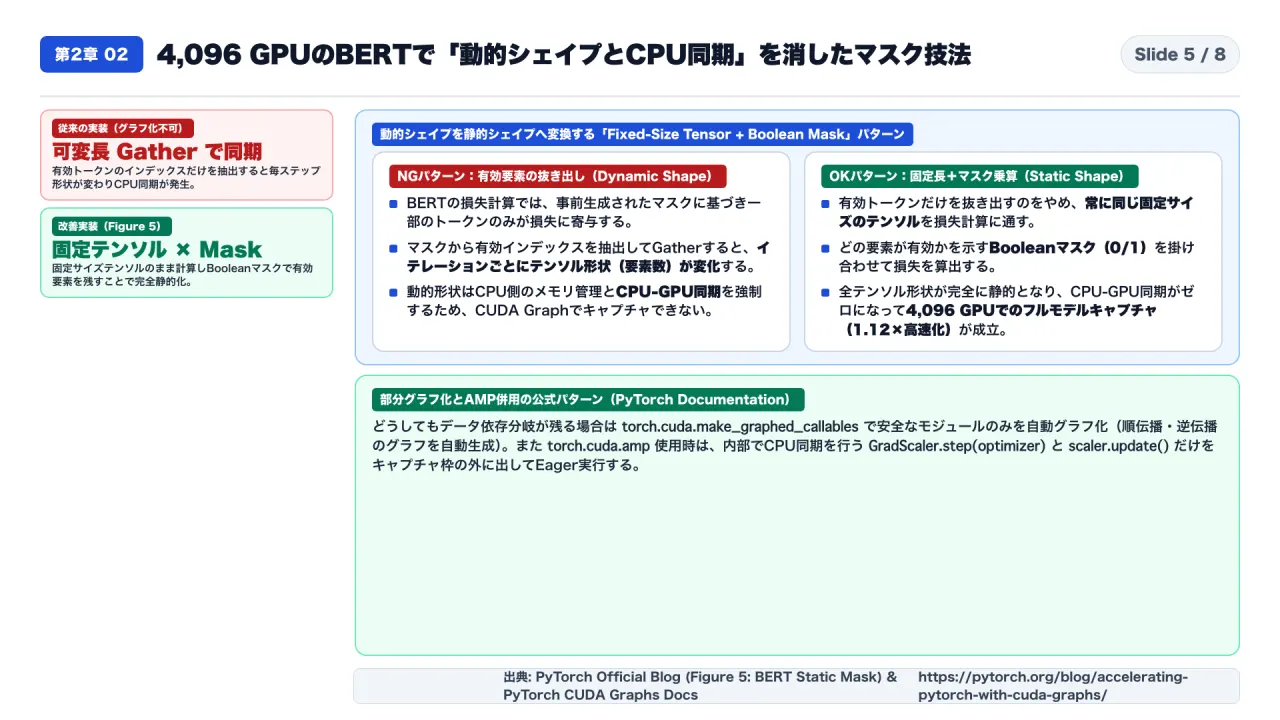
Scaling BERT across 4,096 GPUs presented two obstacles that eager execution could not overcome:
- Host OS Jitter and Collective Tail Latency: In Distributed Data Parallel (DDP), every GPU executes backward passes before synchronizing via
NCCL AllReduce. When 4,096 host CPUs independently launch kernels, OS interrupts introduce scheduling skew. A minor delay on one host stalls all 4,095 other GPUs at the collective barrier. Bundling forward compute, backward compute, and NCCL AllReduce into a single unified CUDA Graph eliminated host OS scheduling skew, synchronizing execution across all nodes. - Eliminating Dynamic Shapes via Boolean Masking: Standard BERT loss implementations extract variable counts of masked tokens using index gathers (
nonzero()). Because active masked token counts fluctuate across batches, tensor dimensions vary dynamically, forcing host allocations and breaking graph immutability.
Engineers rewrote the loss pipeline: instead of dynamically gathering active tokens, the model computes losses across a fixed-size padded tensor, multiplying outputs by a Boolean mask (1 for active tokens, 0 for padding). Maintaining fixed dimensions across iterations allowed full-model graph capture, securing a 1.12x throughput improvement at 4,096-GPU scale.
3. Capture Invariants: Runtime Errors vs. Silent Numerical Corruption
CUDA Graphs trade eager flexibility for execution density. PyTorch categorizes graph constraints into two severity classes.
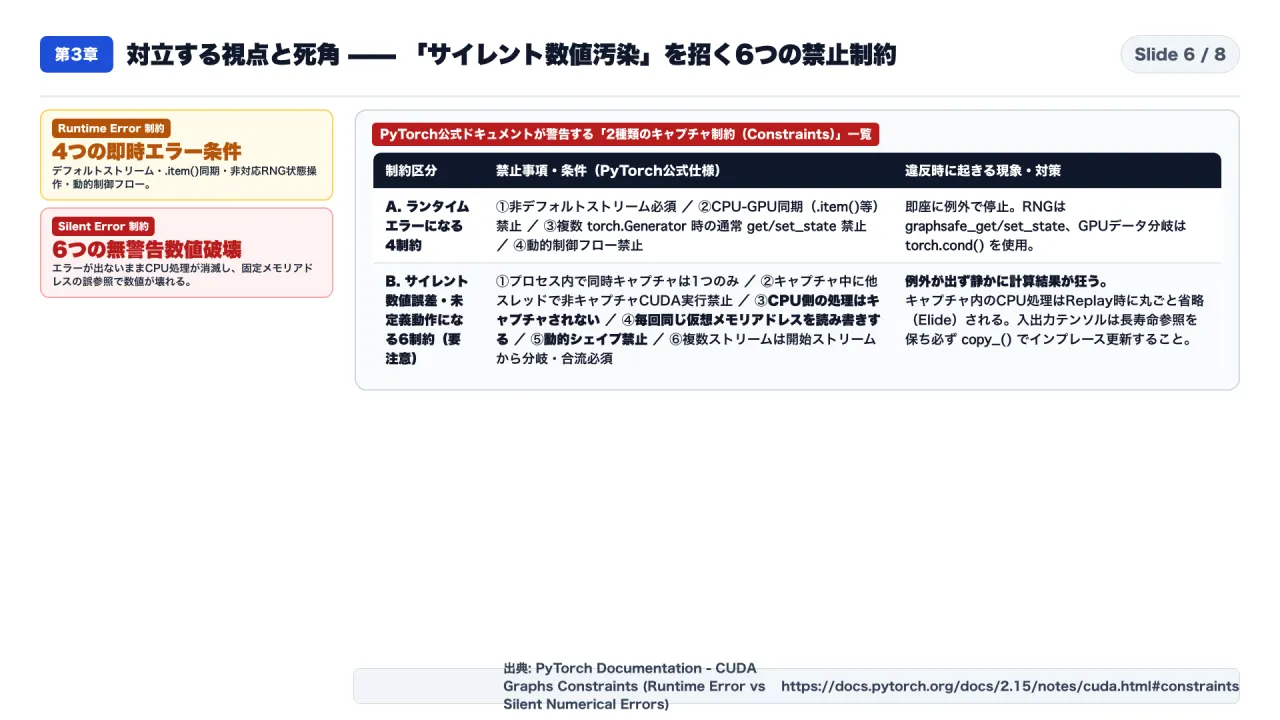
3-1. Category A: Constraints That Raise Runtime Errors
Violations in this category halt execution with explicit exceptions during capture:
- Non-Default Stream Requirement: Capture must occur on a non-default stream (managed by
torch.cuda.graph). - Prohibition of Host-Device Synchronization: Operations that force the CPU to await GPU state (
.item(),.tolist()) are invalid within capture blocks. - Random Number Generator State Management: Standard generator state inspection (
get_state/set_state) fails inside graphs. Code must employGenerator.graphsafe_get_stateandGenerator.graphsafe_set_state. - Prohibition of Dynamic Host Control Flow: Branching conditioned on tensor values is prohibited unless expressed via device primitives like
torch.cond().
3-2. Category B: Constraints Triggering Silent Numerical Corruption
Violations in this category execute without throwing errors, silently invalidating model weights:
| Rule | Mechanism of Silent Failure | Mandatory Engineering Mitigation |
|---|---|---|
| 1. Capture Mutual Exclusion | Parallel captures within a single process corrupt stream recording state. | Enforce single-threaded capture per process via locks. |
| 2. Prohibition of Concurrent CUDA Work | Foreign threads issuing CUDA commands inject external operations into the recorded DAG. | Suspend background asynchronous GPU threads until capture finishes. |
| 3. CPU Operation Elision | CPU calculations inside a capture block run once during recording and are omitted during replay. | Relocate metric logging and Python counters outside replay loops. |
| 4. Fixed Virtual Address Immobility | Replay reads the exact virtual addresses captured. Variable reassignment (static_input = data) causes replay to process stale memory. |
Retain permanent references to static tensors and update buffers in-place via static_input.copy_(data). |
| 5. Absolute Dimension Invariance | Changing tensor shapes alters memory offsets, causing silent buffer overruns or misaligned math. | Pad variable inputs to fixed bucket sizes with Boolean masks. |
| 6. Stream DAG Convergence | Captures using multiple streams must branch from and rejoin the primary capture stream before exit. | Enforce strict DAG branch-and-rejoin topology using wait_stream. |
3-3. Partial Graphs and Mixed Precision Integration
When models contain unavoidable data-dependent branches, PyTorch provides two integration patterns:
- Partial Graphing via
make_graphed_callables: Developers wrap capture-safe submodules (module1,module3) intorch.cuda.make_graphed_callables, leaving intermediate dynamic logic (module2with.item()branching) in eager mode. - Automatic Mixed Precision (
torch.cuda.amp) Integration: BecauseGradScaler.step(optimizer)performs host-device synchronization to detect Inf/NaN values, it cannot execute inside graph capture. The standard pattern captures forward, loss, andscaler.scale(loss).backward()within the graph, while executingscaler.step(optimizer)andscaler.update()in eager mode immediately followingg.replay().
4. Structural Insights: LLM Decoding and Distributed Execution
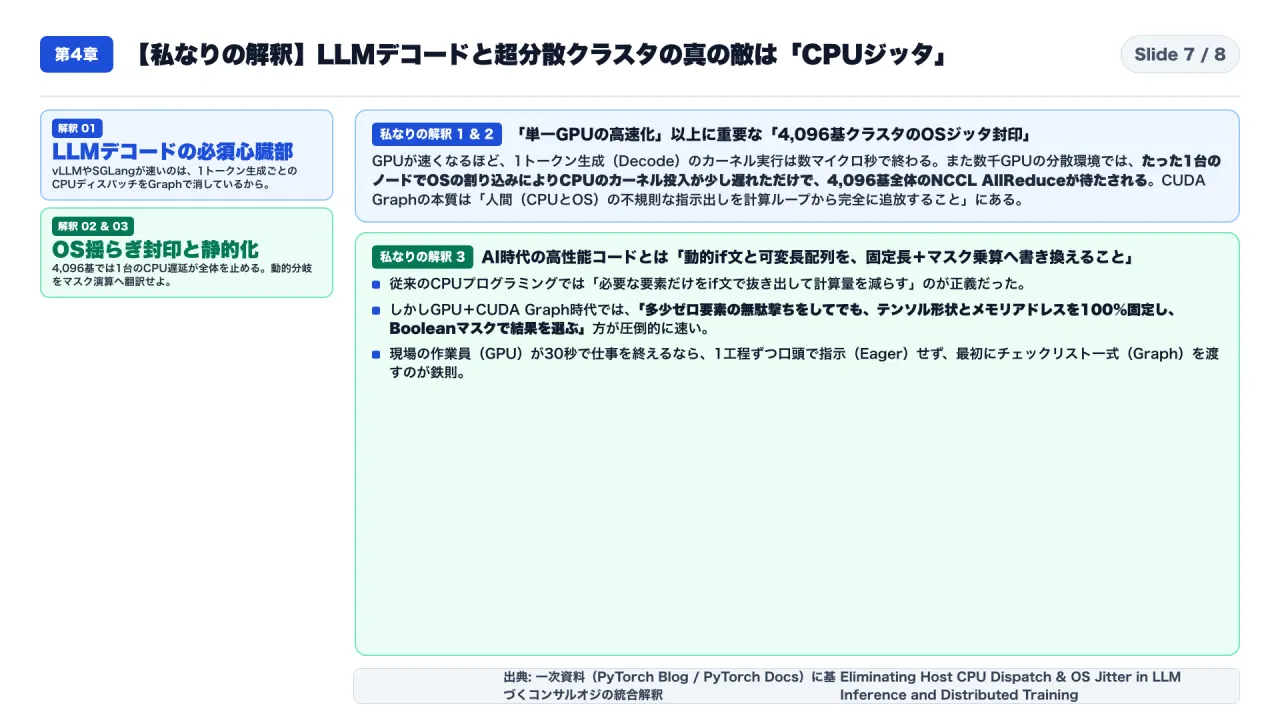
Synthesizing these findings establishes three architectural principles:
4-1. CUDA Graph Coverage Dictates LLM Decode Performance
Prompt prefill processes large token matrices that saturate GPU compute cores. In contrast, the token decode phase processes batch-size-1 operations across individual sequence states.
Running decode in eager mode replicates the Mask R-CNN profile: host CPU dispatch latency dominates the timeline. Modern inference engines (vLLM, SGLang) pre-capture CUDA Graphs across discrete batch buckets (1, 2, 4, 8, 16). Decode throughput is determined by graph coverage; dropping back to eager execution degrades generation speed.
4-2. Banishing Host OS Jitter in Ultra-Scale Clusters
In distributed training, CUDA Graphs transform system economics. When 4,096 GPUs execute thousands of NCCL AllReduce barriers per training step, synchronization latency is governed by the slowest host processor.
By locking forward compute, backward compute, and collective communication into a compiled hardware graph, CUDA Graphs eliminate host CPU scheduling variability and OS interrupts from the execution path.
4-3. The Paradigm Shift: Trading Arithmetic for Memory Invariance
Classical software optimization emphasizes pruning computations through conditional branching. In hardware-accelerated deep learning, this logic inverts. Introducing conditional execution induces dynamic tensor shapes and host-device synchronization, destroying hardware efficiency. Performing matrix math across fixed padded allocations using Boolean masks is orders of magnitude faster than evaluating dynamic branches.
5. Practical Implementation Checklist for AI Infrastructure Teams

Teams operating PyTorch training or inference infrastructure can apply these techniques using the following audit framework:
| Audit Domain | Concrete Inspection Item | Production Standard |
|---|---|---|
| 1. Bottleneck Profiling | Is low GPU utilization caused by memory bandwidth limits or CPU launch overhead? | Capture NSight Systems traces; verify whether CPU hits 100% while GPU exhibits idle gaps. |
| 2. Synchronization Elimination | Are host-device synchronizations (.item(), print(), Thrust) present in execution paths? |
Eliminate sync calls; replace synchronous libraries with asynchronous CUB routines or use make_graphed_callables. |
| 3. Shape Invariance Auditing | Do dynamic token gathers or variable batch dimensions alter tensor layouts across steps? | Pad inputs to fixed bucketing thresholds and apply Boolean masks to stabilize tensor dimensions. |
| 4. AMP Boundary Configuration | Are optimizer updates and GradScaler operations placed inside capture blocks? |
Capture forward and backward passes inside the graph; execute scaler.step(optimizer) and scaler.update() in eager mode post-replay. |
| 5. Silent Corruption Regression Testing | Does CI verify that graph outputs match eager numerical results? | Implement side-stream warmups, enforce static_input.copy_(), and validate g.replay() outputs against eager baselines. |
Frequently Asked Questions
Why does GPU utilization plummet during batch size 1 inference or distributed training?
GPU execution duration scales with data volume, while host CPU dispatch latency remains constant. In batch-size-1 workloads or strong-scaling setups where work per GPU is minimal, kernels finish in microseconds. The host CPU cannot dispatch commands fast enough, forcing the GPU to remain idle between operations.
Why does assigning static_input = new_data cause silent numerical corruption during replay?
CUDA Graphs record the exact virtual memory addresses of buffers during capture. Reassigning the Python variable points it to a new location without altering the address stored in the graph. The graph continues reading the original buffer, processing stale data without raising an error. Developers must update buffers in-place using static_input.copy_(new_data).
Why must CUDA Graph capture be preceded by side-stream warmup iterations?
Initial PyTorch operations trigger deferred initialization, including CUDA allocator reservations and cuDNN kernel tuning. Running warmup iterations on a dedicated side-stream stabilizes memory allocations, ensuring capture records only pure mathematical execution.
How do LLM inference engines use CUDA Graphs when prompt lengths fluctuate?
Inference engines pre-capture distinct graphs for predefined batch sizes and sequence buckets. Inputs are padded to the nearest bucket and evaluated using Boolean masks, eliminating dynamic shapes while preserving graph acceleration.
Primary Sources and References
- PyTorch Official Blog: Accelerating PyTorch with CUDA Graphs — Vinh Nguyen, Michael Carilli, Sukru Burc Eryilmaz, Vartika Singh, Michelle Lin, Natalia Gimelshein, Alban Desmaison, Edward Yang (NVIDIA & Meta)
- PyTorch Official Documentation: CUDA Semantics — CUDA Graphs (API Specifications and Constraints)
- NVIDIA Developer Documentation: CUDA C++ Programming Guide — CUDA Graphs
- MLPerf Training v1.0 Results: NVIDIA and Meta Benchmark Submissions