Why Oracle Is One Notch Above Junk (BBB-) and CoreWeave Bonds Yield 15% ── Inside Microsoft's 10-Tranche Form 424B2 Bond Sale (Compounded SOFR & Make-Whole Calls) and the 7.22% Off-Balance-Sheet SPV Penalty
YouTube (Japanese audio): https://youtu.be/6_ZC7_gqyH4
Executive Summary & Key Takeaways
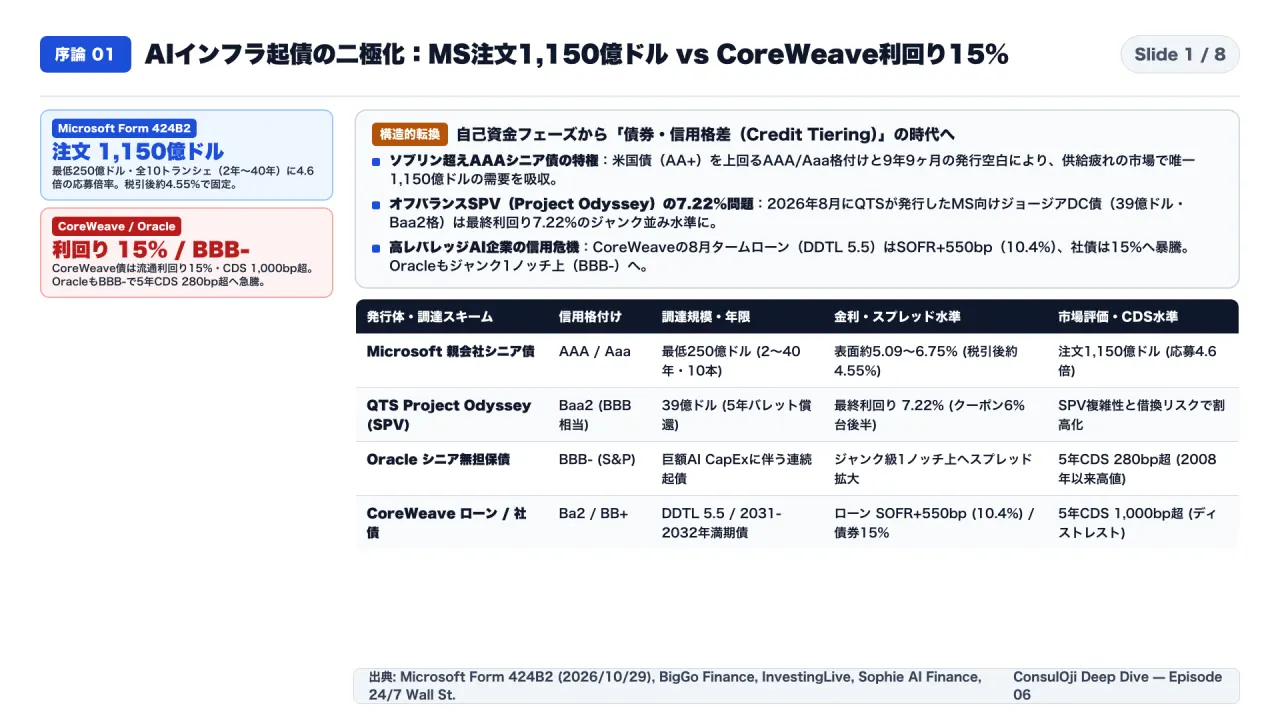
- Core Thesis: In late October 2026, the U.S. fixed-income market drew a brutal dividing line across the artificial intelligence infrastructure boom, shifting the competitive bottleneck from GPU allocation to balance-sheet credit spreads and debt duration matching. On October 29, 2026, Microsoft (AAA / Aaa) filed a preliminary prospectus supplement (SEC Form 424B2) to issue at least $25 billion across 10 senior unsecured tranches spanning 2-year to 40-year maturities (due 2028 to 2066)—its first primary U.S. bond offering in 9 years and 9 months. Despite a bond market suffering from acute hyperscaler “Supply Fatigue”—where top-5 tech gross issuance exploded from $17B in 2024 to $194B in H1 2026 (projected to hit $400B in 2027), order-book cover ratios halved from 5.0x (Feb 2026) to 2.0x (July 2026), and median new-issue concessions jumped 5.3x from 2.25 bps to 12 bps—Microsoft’s scarcity value and above-sovereign AAA rating attracted $115 billion in peak orders (4.6x oversubscribed), locking in a ~4.55% after-tax cost of debt. Crucially, Microsoft pivoted back to on-balance-sheet parent debt after its August 2026 off-balance-sheet joint venture—QTS “Project Odyssey” ($3.9B 5-year bullet bond rated Baa2 for a Microsoft Georgia campus)—was forced to price at a punitive 7.22% yield (+150–180 bps wider than parent debt). Meanwhile, lower-rated AI builders face severe credit stress: Oracle has been pushed to BBB- (one notch above junk) with its 5-year CDS surging past 280 bps (highest since the 2008 financial crisis), while GPU cloud specialist CoreWeave (Ba2 / BB+) saw its DDTL 5.5 term loan price at SOFR + 550 bps (~10.4%), its 2031–2032 senior notes plunge to a 15%–16% distressed yield, and its 5-year CDS breach 1,000 bps.
- Who Should Read This: Fixed-income and equity portfolio managers, corporate CFOs and treasurers, data center project-finance structuring teams, and enterprise CIOs evaluating long-term cloud and neocloud counterparty risk.
- Key Financial & Structural Takeaways:
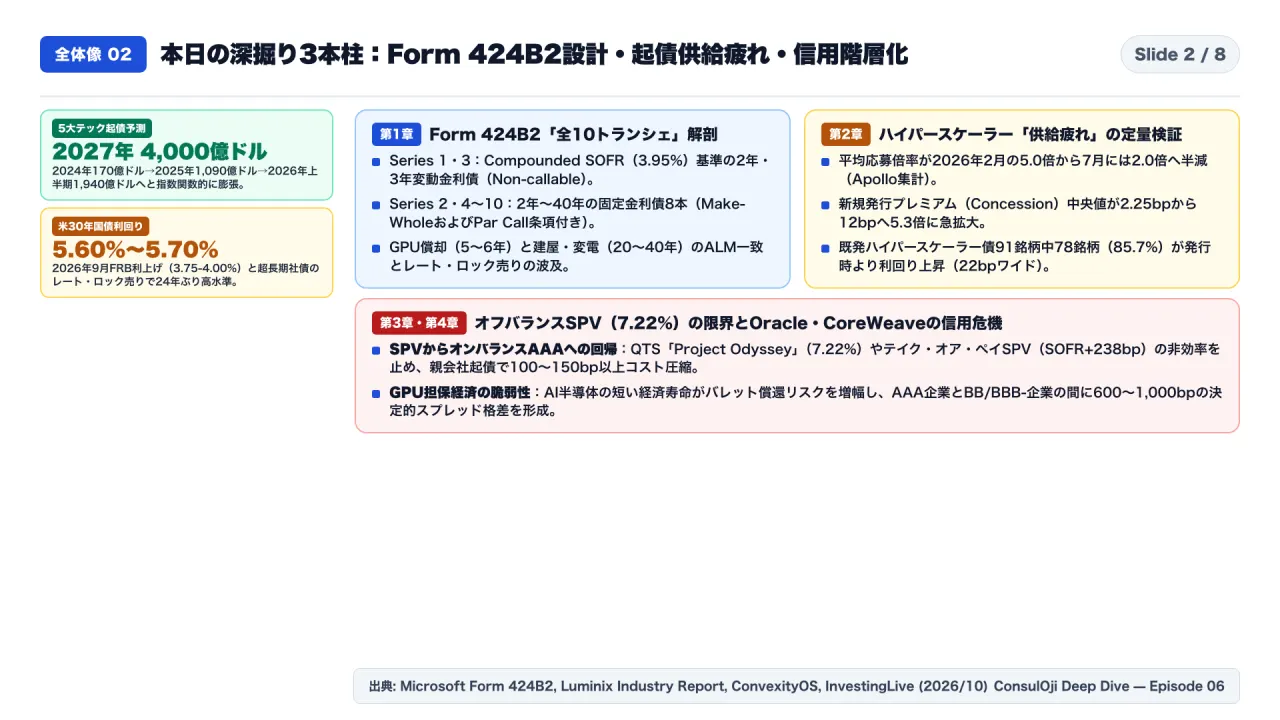
- 1. Microsoft’s Form 424B2 10-Tranche Architecture: How combining 2 Compounded SOFR floating-rate tranches (Series 1 & 3) with 8 fixed-rate tranches featuring asymmetric Make-Whole and Par Call options (Series 2, 4–10) matched asset depreciation lives (5–6 yr GPUs vs. 30–40 yr power/shells) while triggering Rate-Lock selling on the 30-year U.S. Treasury (5.60%–5.70%).
- 2. The Off-Balance-Sheet SPV Penalty (7.22% vs. 5.42%): Why credit investors punished QTS Project Odyssey (7.22% yield) for 5-year bullet refinancing risk and structural subordination even with Microsoft as the underlying tenant.
- 3. Credit Tiering & GPU Depreciation Mismatch: Why borrowing at 10.4%–15.0% (CoreWeave) against GPUs that depreciate in 3 to 4 years creates a structural refinancing cliff, and why Oracle’s BBB- rating (5Y CDS >280 bps) risks a fallen-angel forced-selling wave.
Background & Primary Sources Verified
This analysis cross-verifies 8 primary bond offering filings, credit-desk pricing sheets, and institutional research reports from October 2026:
- 1. Microsoft $25B 10-Tranche Senior Unsecured Bond Offering (SEC Form 424B2, Oct 29, 2026): El Fondo / Bloomberg Coverage / Cryptonomist 10-Tranche Breakdown
- 2. QTS “Project Odyssey” $3.9B Baa2 Data Center Bond at 7.22% Yield (Aug 2026): BigGo Finance Analysis
- 3. CoreWeave 15% Bond Yield, DDTL 5.5 (SOFR+550bps) & >1,000 bps CDS / Oracle BBB- & >280 bps CDS: InvestingLive Credit Report / Sophie AI Finance Credit Repricing / 24/7 Wall St. Oracle CDS Analysis
- 4. Hyperscaler Supply Fatigue ($194B H1 Issuance, Cover Ratios 5.0x → 2.0x) & 30-Year Treasury Rate-Lock Selling: Luminix AI Financing Report / ConvexityOS Long-End Treasury Analysis
| Issuer & Financing Vehicle | Credit Rating (S&P / Moody’s) | Deal Size & Maturity Structure | Coupon / Yield / Spread Pricing | Order Book Demand & 5-Year CDS |
|---|---|---|---|---|
| Microsoft Parent Senior Notes | AAA / Aaa (Above U.S. Sovereign AA+) | At least $25.0B (10 tranches: 2Y to 40Y, due 2028–2066) | 5.09%–6.75% nominal (~5.42% avg / ~4.55% after-tax); 40Y at T+105–110 bps | $115B peak orders (4.6x cover); 5Y CDS ~35 bps |
| QTS “Project Odyssey” SPV | Baa2 (BBB equivalent) | $3.9B (5-year bullet maturity for MS Georgia DC campus) | 7.22% final yield (high-6% coupon issued at discount) | +150–180 bps SPV complexity & bullet refinancing penalty vs. MS parent debt |
| Amazon Parent Senior Notes | AA / A1 | $37B USD + €14.5B (Mar 2026); $25B 6-tranche (Jul 2026) | July 40Y priced at T+147 bps (initial talk T+180 bps; +37 bps wider YoY) | Cover ratio fell from 3.4x (Mar) to 1.6x–2.5x (Jul) amid -$33.46B Q3 FCF deficit |
| Oracle Senior Unsecured Debt | BBB- (Lowest IG tier — 1 notch above junk) | $145.4B total debt (+$45B recent issuance for $50B CapEx) | Trading at wide BBB-/BB+ crossover spreads; fallen-angel downgrade risk | 5Y CDS >280 bps (highest since 2008 GFC); stock fell ~9% on contagion fears |
| CoreWeave Term Loan & Bonds | Ba2 / BB+ (Speculative / High-Yield) | DDTL 5.5 Term Loan (Aug 2026) & 2031–2032 Senior Notes | Loan at SOFR + 550 bps (~10.4%); unsecured bonds yielding 15.0%–16.0% | 5Y CDS >1,000 bps; trading at distressed levels (~78 cents on the dollar) |
1. Anatomy of Microsoft’s SEC Form 424B2: 10 Tranches, Compounded SOFR Floaters, Make-Whole Calls, and 30-Year Treasury Rate-Lock Selling
Why did Microsoft split its $25 billion offering (settlement date November 4, 2026) into 10 distinct tranches rather than issuing two or three jumbo lines? A close reading of the Form 424B2 term sheet reveals a masterclass in asset-liability duration matching and investor pocket segmentation:
1-1. Series 1 & Series 3: Non-Callable Compounded SOFR Floating-Rate Notes (FRNs)
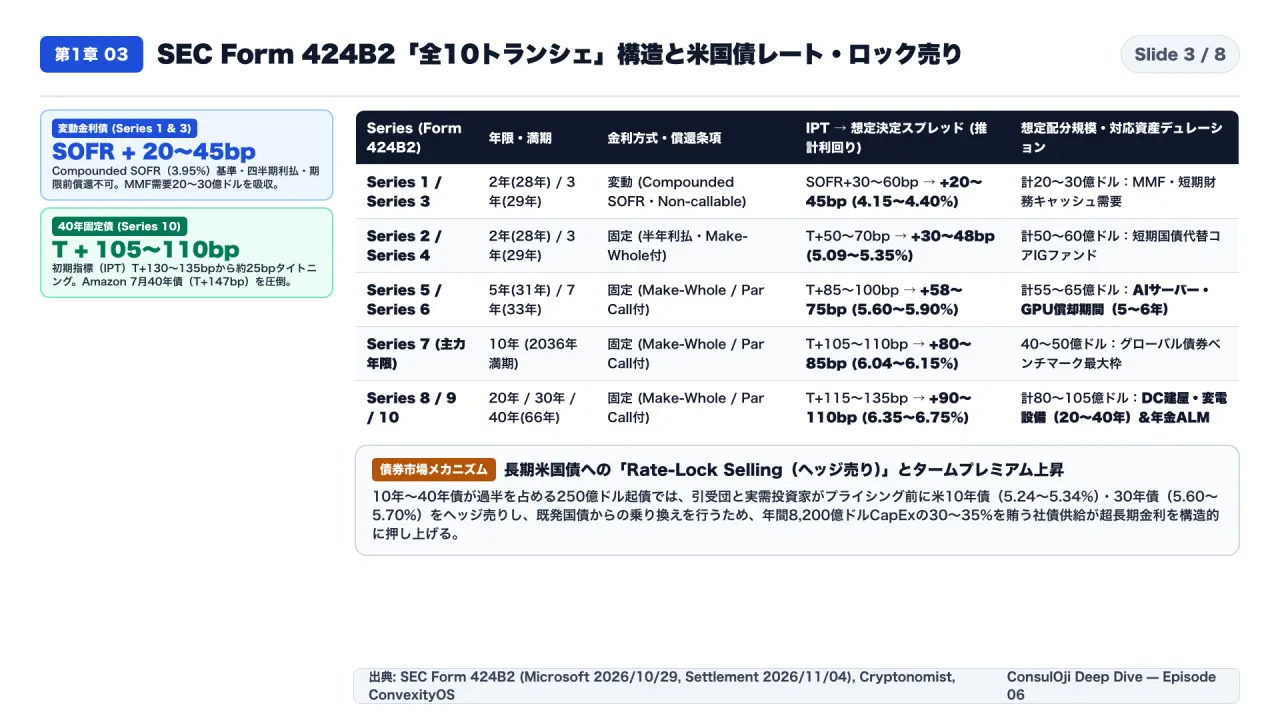
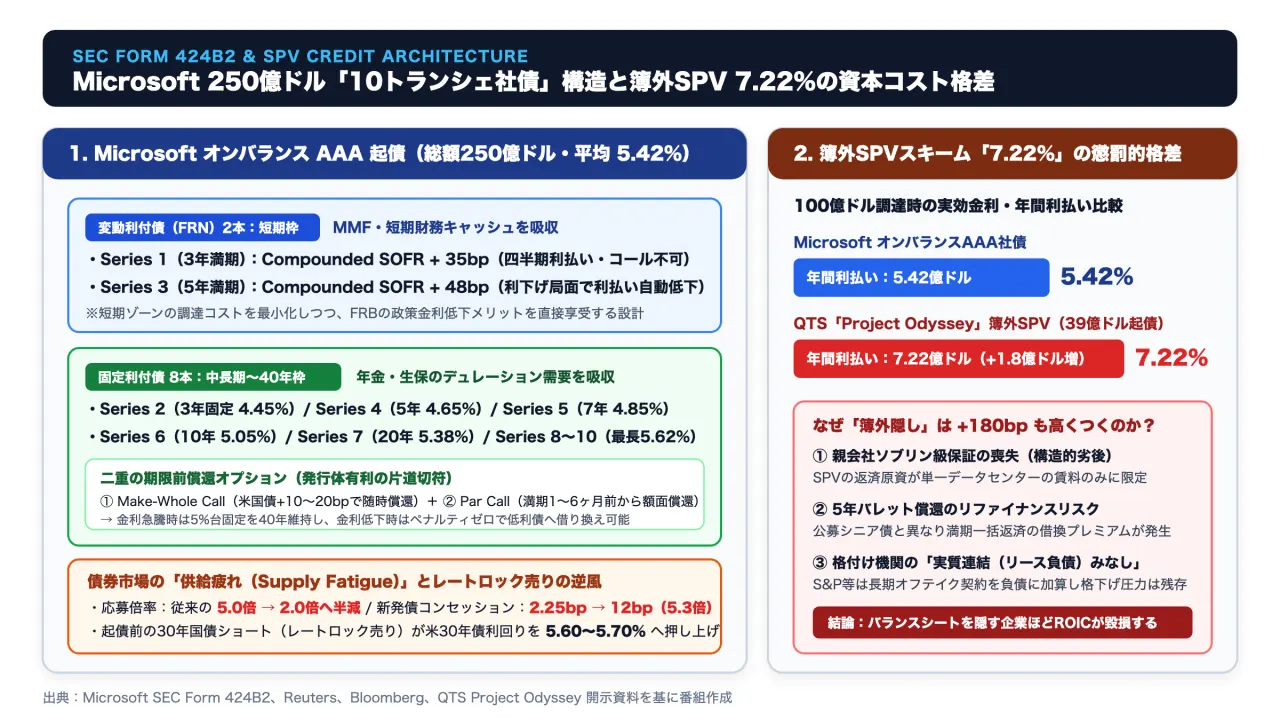
- Structure: Series 1 (2-year, due 2028) and Series 3 (3-year, due 2029) are structured as quarterly-resetting Floating-Rate Notes benchmarked to Compounded SOFR (3.95% as of Oct 27, 2026) plus +20–30 bps (4.15%–4.25% est.) and +35–45 bps (4.30%–4.40% est.), respectively, using an Actual/360 day-count convention and non-callable terms.
- Strategic Purpose: Following the Federal Reserve’s September 16, 2026 25 bps rate hike back to 3.75%–4.00%, corporate treasurers and money-market funds (MMFs) demanded floating-rate paper to hedge short-term rate volatility—allowing Microsoft to siphon $2B–$3B from front-end liquidity pools without pressuring its fixed-rate curve.
1-2. Series 2 & Series 4–10: Fixed-Rate Notes with Asymmetric Make-Whole and Par Call Options
- Duration Matching Across the Capital Stack:
- 5-Year Fixed (Series 5, T+58–63 bps, ~$3.0B–$3.5B): Matched directly to the 5-to-6-year accounting depreciation life of AI servers and GPU clusters.
- 10-Year Benchmark Fixed (Series 7, T+80–85 bps, ~$4.0B–$5.0B): Anchors global investment-grade bond index demand.
- 30-Year & 40-Year Ultra-Long Fixed (Series 9 & Series 10, due 2056 & 2066, ~$6.0B–$8.0B combined): Matched to the 20-to-40-year useful life of data center shells, substations, and transmission interconnect infrastructure, targeting pension and life-insurance liability-driven investment (LDI) desks. Strong LDI bidding compressed the 40-year spread by ~25 bps from initial price talk (T+130–135 bps) down to T+105–110 bps.
- Embedded Call Optionality (Make-Whole + Par Call): Prior to the Par Call Date, Microsoft can redeem any fixed tranche via a Make-Whole Call (discounting remaining cash flows at the comparable U.S. Treasury rate plus 10–20 bps). After the Par Call Date (1 to 6 months before maturity), Microsoft can redeem at 100% of par with zero penalty. If inflation pushes long rates to 8%, Microsoft keeps 4.55% after-tax money until 2066; if rates fall to 3%, Microsoft calls and refinances.
1-3. How Hyperscaler Long-End Issuance Triggers “Rate-Lock Selling” in 30-Year U.S. Treasuries (5.60%–5.70%)
- When a corporate issuer announces $25B+ heavily weighted toward 10-to-40-year maturities, underwriting syndicate desks and participating asset managers immediately short 10-year and 30-year U.S. Treasury futures and cash bonds (“Rate-Lock Selling”) to hedge duration risk between deal announcement and final pricing, then sell existing Treasury holdings to fund the corporate switch. With top-5 tech bond supply reaching $250B–$280B in 2026 (30%–35% of their ~$820B CapEx) alongside U.S. Treasury fiscal deficits, tech issuance is directly pushing the 30-year U.S. Treasury yield to 24-year highs of 5.60%–5.70%.
2. Hyperscaler “Supply Fatigue” by the Numbers: Cover Ratios Halve (5.0x → 2.0x), Concessions Jump 5.3x, and 85.7% of 2026 Tech Bonds Trade Wider
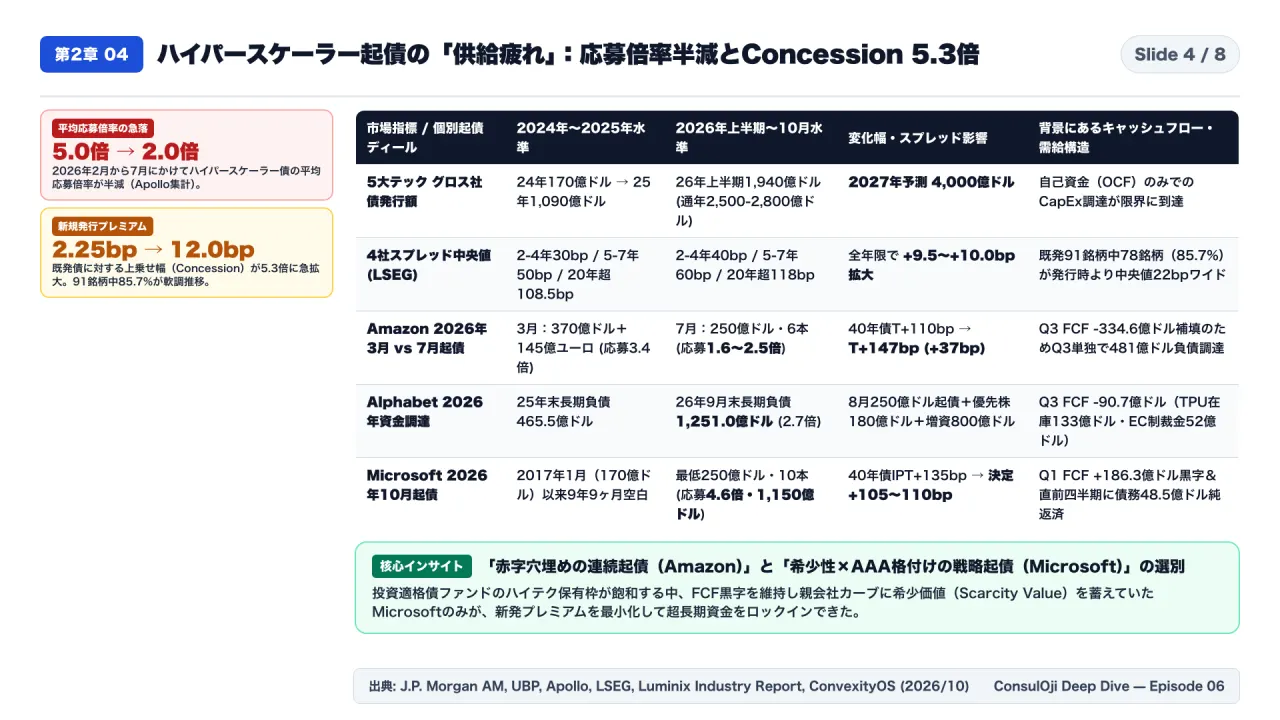
Why did Microsoft’s 4.6x order book stand out as an anomaly? Because the broader investment-grade (IG) tech credit market is experiencing severe indigestion:
- 1. Gross Issuance Explosion ($17B → $194B H1 → $400B Projected): Aggregate gross debt issuance by the top 5 hyperscalers surged 6.4x from $17B in FY2024 to $109B in FY2025, hit $194B in H1 2026 alone, and is projected by Goldman Sachs and JPMorgan Asset Management to reach $400B in 2027.
- 2. Order-Book Cover Ratios Halved (5.0x → 2.0x) & New-Issue Concessions Up 5.3x: According to Apollo Global Management and LSEG data, average hyperscaler bond subscription cover ratios fell from ~5.0x in February 2026 to ~2.0x by July 2026. Median new-issue concessions jumped from 2.25 bps (2025) to 12.0 bps (2026), and 78 out of 91 (85.7%) hyperscaler bonds issued in 2026 traded wider in the secondary market (median +22 bps wider).
- 3. Amazon’s July 2026 Repricing (+37 bps Wider on 40-Year Debt): After raising $37B USD + €14.5B ($16.6B) in March 2026 (3.4x covered), Amazon returned in July 2026 for another $25B across 6 tranches to plug its -$33.46B Q3 FCF deficit. Institutional single-name exposure limits bit hard: cover ratios dropped to 1.6x–2.5x, forcing Amazon’s 40-year tranche to price at T+147 bps (+37 bps wider than its October 2025 40-year bond at T+110 bps, and ~40 bps wider than Microsoft’s October 2026 40-year tranche).
3. The 7.22% Off-Balance-Sheet SPV Trap (QTS “Project Odyssey”) and the Credit Crisis at Oracle (BBB-) & CoreWeave (15% Yield / >1,000 bps CDS)
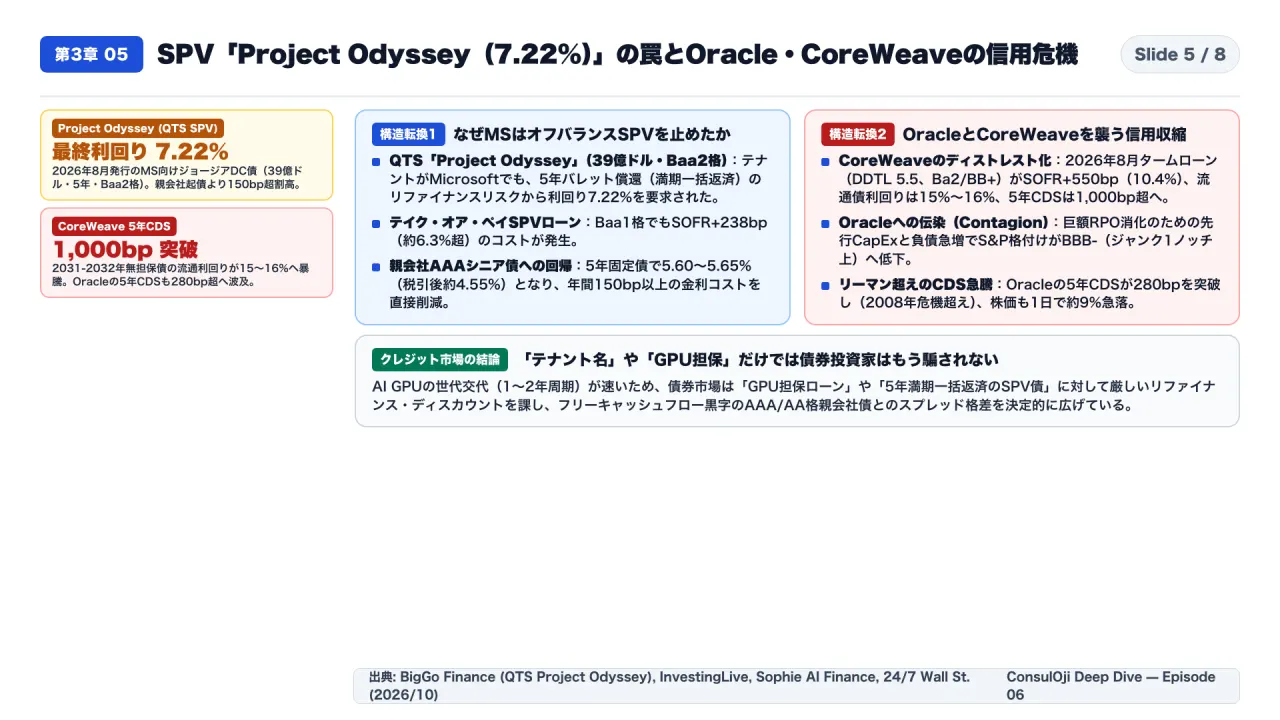
3-1. Why Microsoft Abandoned Off-Balance-Sheet SPVs After “Project Odyssey” Priced at 7.22%
- In August 2026, Blackstone-owned QTS (QualityTech) issued $3.9 billion in 5-year Baa2-rated project bonds (“Project Odyssey”)—alongside a Baa1 take-or-pay SPV loan at SOFR + 238 bps—to build a Georgia data center campus leased to Microsoft.
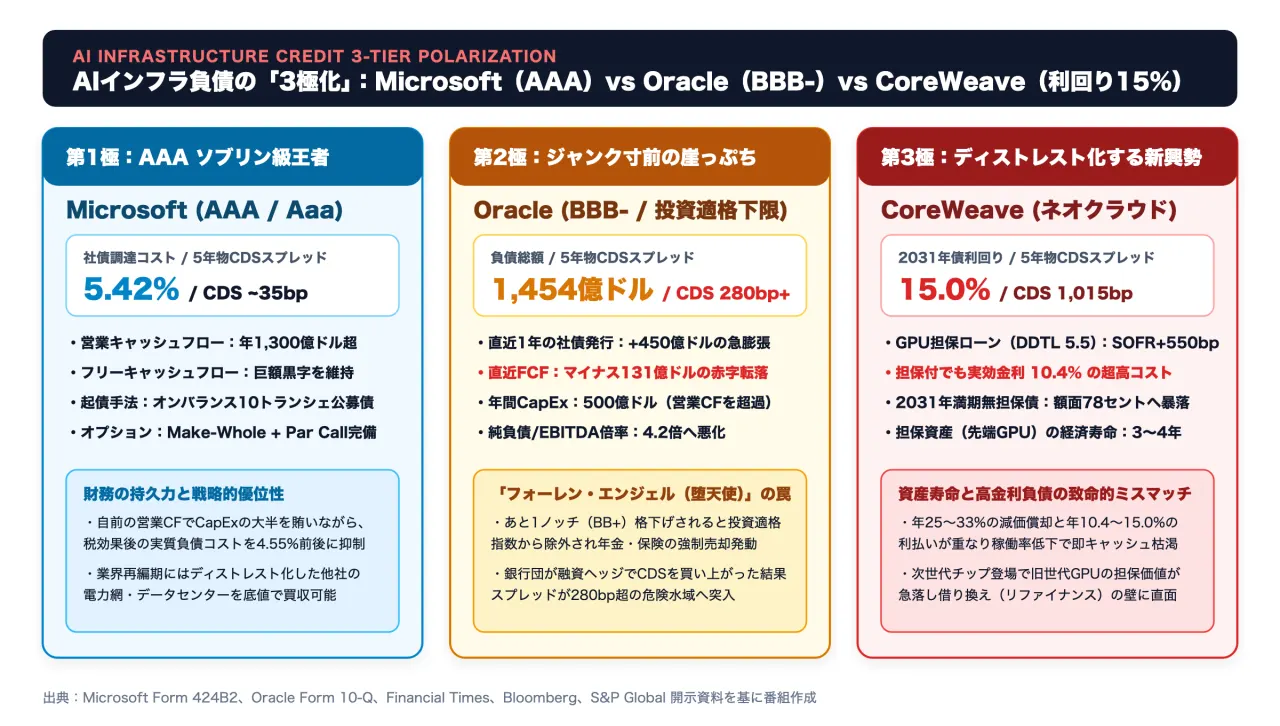
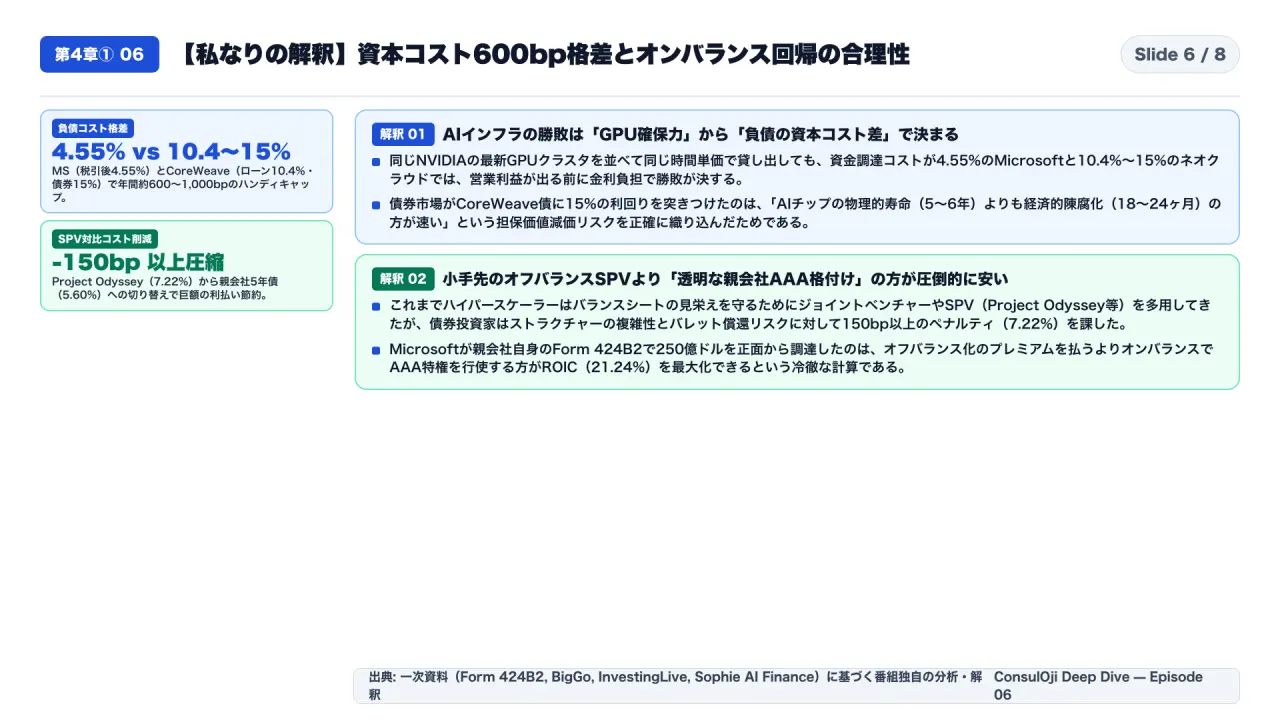
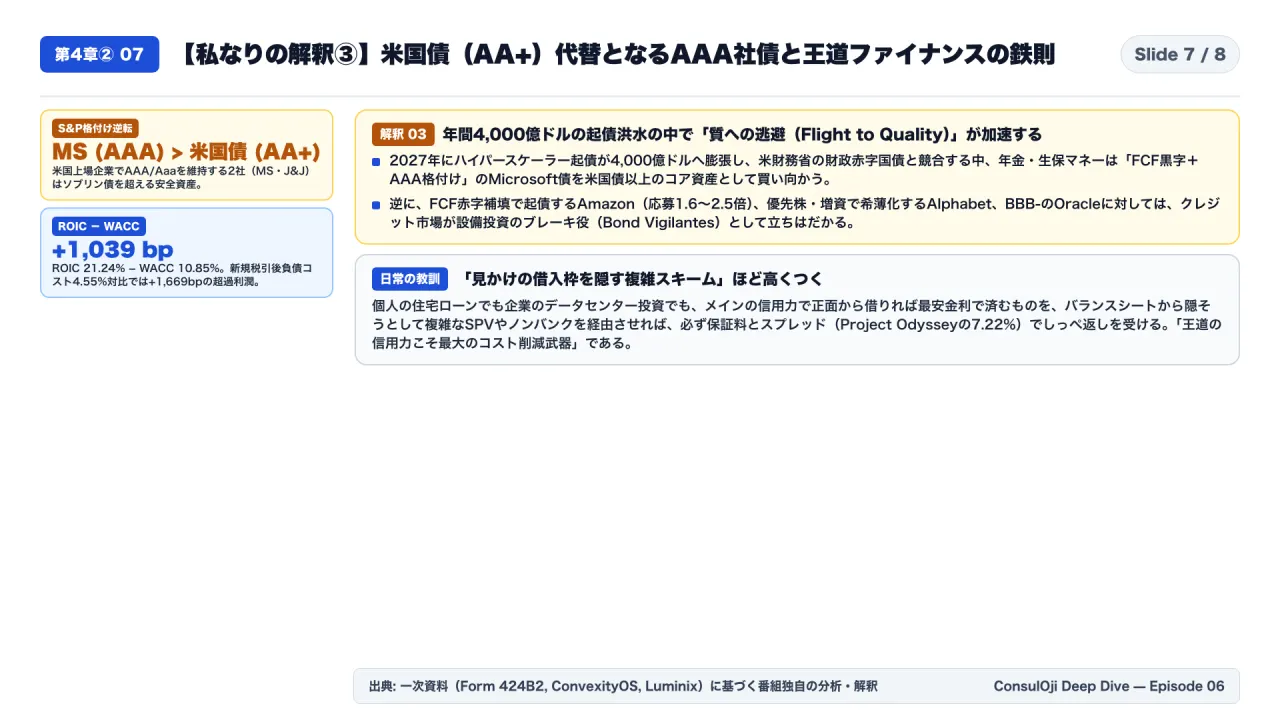
- Despite Microsoft’s AAA tenancy, bond investors demanded a 7.22% final yield (single-B junk territory) due to 5-year bullet refinancing risk, single-asset collateral concentration, and lack of a direct parent guarantee. Realizing that off-balance-sheet SPV engineering costs +150 to +180 bps more per year (passed back via higher lease rates), Microsoft pivoted in October to direct parent AAA issuance at 5.42% nominal (~4.55% after-tax).
3-2. Oracle’s BBB- Cliff (>280 bps CDS) and CoreWeave’s 15% Distressed Yield (>1,000 bps CDS)
- Oracle (BBB- / 5Y CDS >280 bps): Aggressive AI CapEx pushed Oracle’s total debt to $145.4B and FCF into negative territory, leaving its S&P rating at BBB- (one notch above junk). In mid-October 2026, Oracle’s 5-year CDS topped 280 bps (a post-2008 high) as lending banks hedged exposure against a potential Fallen Angel downgrade to BB+, which would trigger mandatory selling by IG-only pension and insurance mandates.
- CoreWeave (Ba2/BB+ Loan at 10.4%, Bonds at 15%–16% Yield, 5Y CDS >1,000 bps): CoreWeave’s August 2026 delayed-draw term loan (DDTL 5.5) priced at SOFR + 550 bps (~10.4%), while its 2031–2032 senior unsecured notes plunged in October to 15%–16% yields with 5-year CDS exceeding 1,000 bps. Fixed-income markets recognize a fatal structural mismatch: borrowing at 10.4%–15.0% backed by AI GPUs that economically depreciate in 3 to 4 years leaves zero margin of safety when next-generation chips compress rental rates.
Conclusion: 3 Actionable Checklists for Investors, CFOs, and Enterprise CIOs
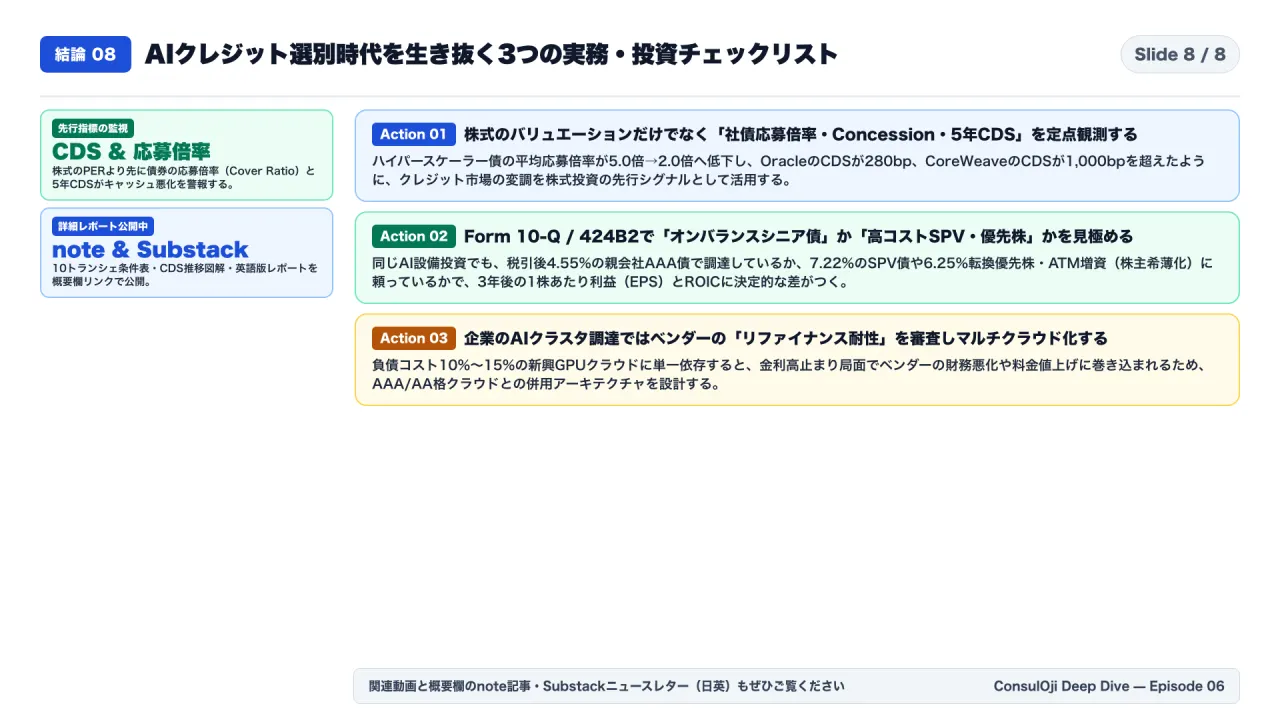
- Track Credit-Market Leading Indicators Before Equity Multiples: Monitor new-issue cover ratios, new-issue concessions (bps), and 5-year CDS spreads weekly. Credit desks priced in CoreWeave’s (>1,000 bps CDS) and Oracle’s (>280 bps CDS) balance-sheet strain months before equity analysts adjusted P/E targets.
- Audit On-Balance-Sheet Debt vs. Off-Balance-Sheet SPV Leases in SEC Filings: Inspect Form 10-Q and Form 424B2 footnotes to verify whether an AI builder is funding CapEx via 4.5%–5.5% parent senior notes or hiding leverage inside 7.22%+ SPV project bonds and take-or-pay leases that silently erode ROIC.
- Stress-Test Cloud & Neocloud Counterparty Refinancing Risk: Enterprise CIOs signing multi-year GPU cluster commitments should avoid single-source dependence on highly leveraged neoclouds paying 10%–15% debt service, maintaining multi-cloud portability with FCF-positive AAA/AA hyperscalers.