Why Microsoft Issued $25B in Bonds Despite Record Cash Flow ── Inside the $115B Order Book, AAA WACC Arbitrage, and the $52B Hyperscaler FCF Divide
YouTube (Japanese audio): https://youtu.be/guNSh2sBBFM
Executive Summary & Key Takeaways
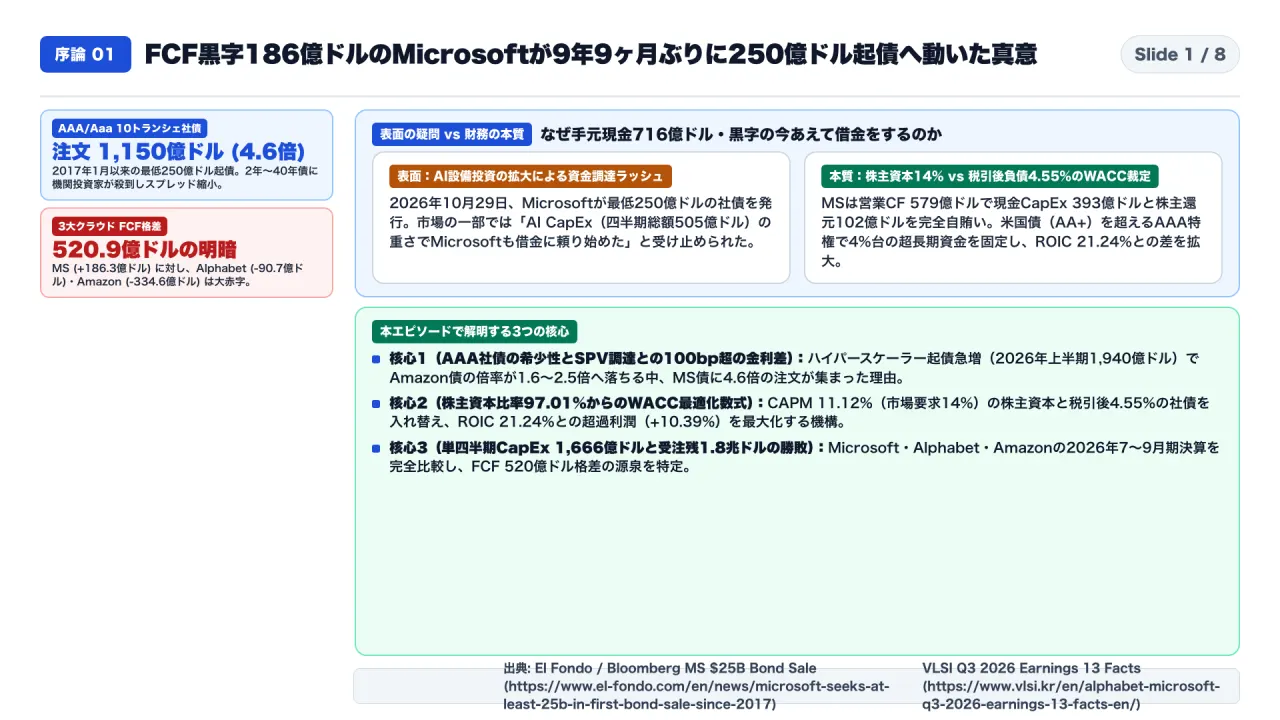
- Core Thesis: On October 29, 2026—less than 24 hours after reporting FY27 Q1 revenue of $93.5 billion (+20% YoY), operating income of $45.8 billion (49.0% operating margin), and $55.6 billion in quarterly operating cash flow—Microsoft (NASDAQ: MSFT) tapped the U.S. investment-grade corporate bond market for the first time in 9 years and 9 months (since January 2017), issuing at least $25 billion across 10 tranches (2-year to 40-year maturities due 2066). Why would a corporation sitting on $70B+ in cash and short-term investments and generating $18.63 billion in quarterly Free Cash Flow (FCF) borrow money? Because institutional investors submitted an astonishing $115 billion in orders (4.6x oversubscribed), allowing Microsoft to tighten its 40-year spread by 20 bps from initial price talk (T+105 bps down to T+85 bps, or ~5.2% coupon / ~3.9%–4.55% after-tax cost of debt). With an equity weight of 97.01% and a cost of equity between 11.12% (CAPM) and 14.0% (market-implied), replacing expensive equity capital with tax-deductible AAA debt captures a 650–945 bps capital-cost arbitrage, lowers WACC (10.85%), and widens Microsoft’s economic spread (ROIC 21.24% − WACC 10.85% = +10.39% EVA spread).
- Who Should Read This: CFOs, corporate treasury and capital-allocation leaders, cloud infrastructure architects, institutional credit and equity analysts, and enterprise IT executives negotiating multi-year cloud commitments.
- Key Architectural & Financial Takeaways:
- 1. TheAAA Sovereign-Grade Privilege vs. SPV Off-Balance-Sheet Debt: Why Microsoft’s on-balance-sheet AAA/Aaa bonds price 100–250 bps tighter than Baa2-rated private-credit Special Purpose Vehicles (SPVs at ~7.0%+) used by rivals, and why Amazon’s concurrent bond offering saw only 1.6x–2.5x bid-to-cover amid $260B+ in 2026 hyperscaler bond supply.
- 2. The $52.1 Billion Quarterly FCF Chasm: Across the October 28–29, 2026 earnings reports, the Big Three hyperscalers spent $166.6 billion in combined single-quarter cash CapEx (Microsoft $37.0B, Alphabet $51.4B, Amazon $75.88B). Yet Microsoft generated +$18.63B in FCF (covering $10.2B in dividends and buybacks organically), whereas Alphabet sank to -$9.07B FCF (zero buybacks, $12.4B ATM equity dilution, plus $14B bond issuance) and Amazon plunged to -$33.46B FCF—a $52.09 billion quarterly FCF gap between Microsoft and Amazon.
- 3. Asset-Liability Duration Matching & The $800B RPO Backlog: How Microsoft matches 2–7 year tranches to 4–6 year GPU servers and 30–40 year tranches to 40-year data-center shells and nuclear/grid substations, backed by $800 billion in Commercial Remaining Performance Obligations (RPO, +104% YoY)—while managing the 45% (~$360B) OpenAI concentration risk.
Background & Primary Sources Verified
This analysis cross-verifies 12 primary financial disclosures, SEC Form 10-Q/8-K filings, earnings call transcripts, and fixed-income market reports from October 28–30, 2026:
- 1. Microsoft $25B 10-Tranche Bond Issuance & $115B Order Book (Oct 29, 2026): El Fondo / Bloomberg Report / KuCoin / Bloomberg Flash / Cryptonomist 10-Tranche Breakdown
- 2. Microsoft FY27 Q1 & Alphabet Q3 2026 Comparative Financial Data (Oct 28, 2026): VLSI Research: 13 Key Financial Facts / NextGComm Q3 Financial Analysis / InsiderFinance: Alphabet -$9.1B FCF & $51.4B CapEx
- 3. Amazon Q3 2026 Earnings, $75.88B CapEx & -$33.46B FCF (Oct 29, 2026): TradingKey Financial Teardown / BigGo Q3 Earnings Call Transcript ($578B AWS Backlog) / Pomegra Briefs / Quartz AWS Analysis
- 4. Fixed-Income Macro & Hyperscaler Credit Curve Repricing (Oct 2026): Luminix Report: Who Is Financing the AI Buildout ($194B+ Bond Surge) / ConvexityOS: The AI Buildout Borrowed Long, and the Long End Repriced
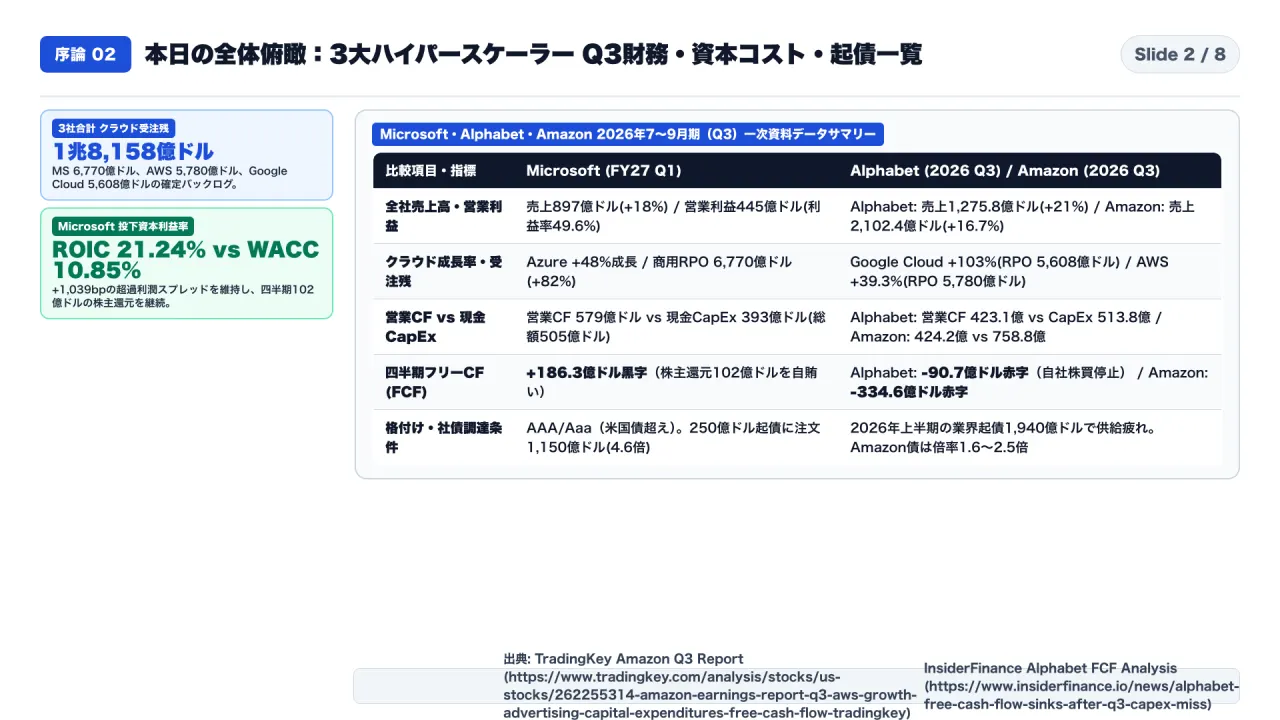
| Financial & Strategic Metric | Microsoft (FY27 Q1 / Oct 2026) | Alphabet (Q3 2026) | Amazon (Q3 2026 / TTM) |
|---|---|---|---|
| Credit Rating (S&P / Moody’s) | AAA / Aaa (Higher than U.S. Sovereign AA+) | AA+ / Aa2 | AA / A1 |
| Quarterly Revenue & Cloud Growth | $93.5B (+20%) / Azure +48% ($59.5B Cloud) | $127.58B (+16%) / Google Cloud $30.71B (+103%) | $207.5B (+13%) / AWS $39.9B (+39.3% accel / +21% YoY) |
| Quarterly Operating Cash Flow (OCF) | $55.6B (49.0% Operating Margin) | $42.3B (Impacted by $5.2B EC fine & $3.22B TPU inventory) | $42.42B (Q3) / $125.6B (TTM) |
| Quarterly Cash CapEx (Jul–Sep 2026) | $37.0B ($47.2B incl. finance leases; FY27 ~$140B+) | $51.4B (2026 guidance raised to $125B–$135B) | $75.88B (+75% YoY) (2026 guidance $220B–$250B) |
| Free Cash Flow (FCF) | +$18.63B (+34% YoY) (Covers $10.2B shareholder return) | -$9.07B (2nd straight negative FCF; $0 buybacks; $12.4B ATM dilution) | -$33.46B (Deep FCF deficit; $52.09B below Microsoft) |
| Cloud Backlog (RPO) & Bond Demand | $800B RPO (+104% YoY) / $25B bond drew $115B orders (4.6x) | $560.8B Cloud RPO (+148% YoY) / $14B USD+EUR bond sale | $455B–$578B AWS Backlog / Bond bid-to-cover dropped to 1.6x–2.5x |
1. Inside the $25B Bond Sale & $115B Order Book: Why Institutional Investors Treated Microsoft Debt as Safer Than U.S. Treasuries
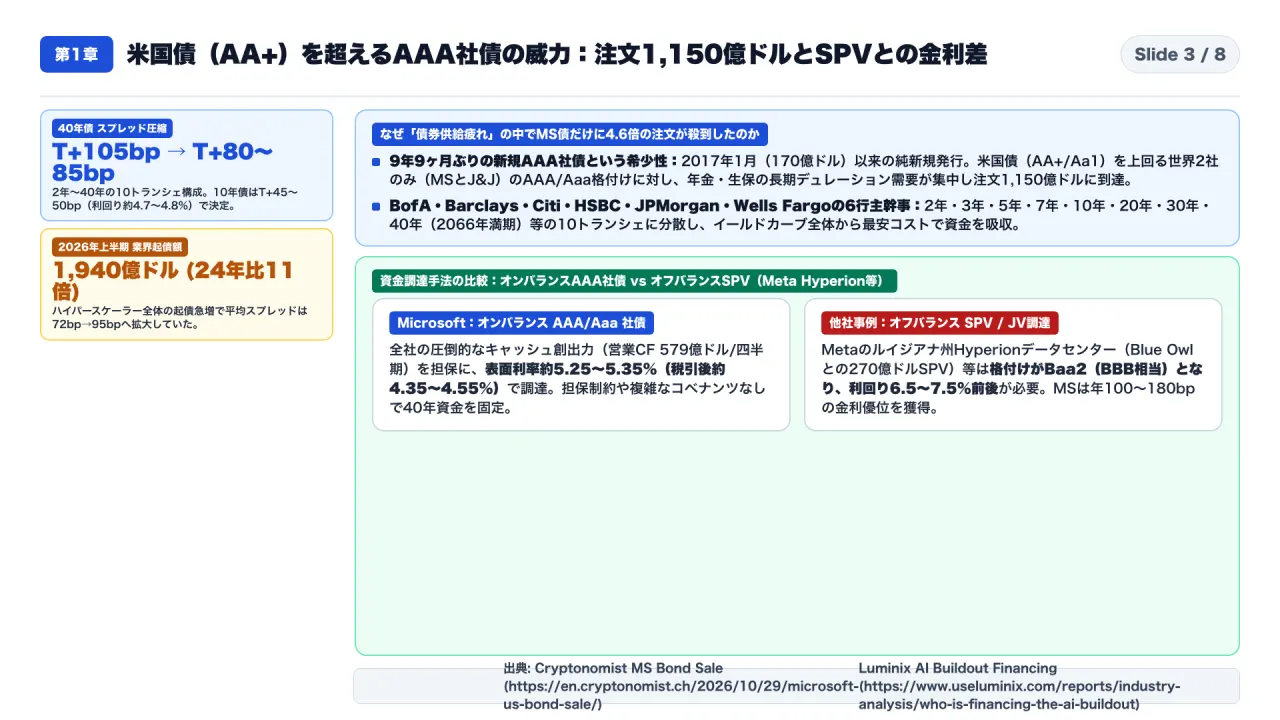
On October 29, 2026, joint bookrunners led by Bank of America, Citigroup, JPMorgan, Wells Fargo, Barclays, and Goldman Sachs opened the books on Microsoft’s first U.S. dollar benchmark bond offering since January 2017.
1-1. The 10-Tranche Structure (2-Year to 40-Year Maturities) and 20 bps Spread Compression
- Record Order Book ($115 Billion = 4.6x Oversubscribed): Within hours, institutional pension funds, life insurers, and sovereign wealth funds placed $115 billion in orders for the $25 billion offering—an oversubscription ratio of 4.6x that rivals the peak demand seen during the 2020–2021 zero-rate era.
- 10 Tranches Across the Curve (2028 to 2066): The deal spanned 10 maturities from 2-year notes to 40-year bonds maturing in 2066. Because of overwhelming demand, syndicate desks tightened pricing on the flagship 40-year tranche by 20 basis points, from initial price talk of UST + 105 bps down to UST + 85 bps (yielding roughly 5.20%–5.75% depending on the long-bond benchmark, equivalent to ~3.90%–4.55% after the 21% U.S. federal + state corporate tax shield).
- Why Microsoft Crushed Hyperscaler “Supply Fatigue”: Throughout the first 10 months of 2026, tech and utility issuers flooded the investment-grade market with $194B to $260B+ in AI infrastructure debt (including Alphabet’s $14B USD/EUR offering on October 28 and multi-billion-dollar deals from Oracle, Meta, and Amazon). That supply wave pushed the 30-year U.S. Treasury yield toward 5.64% and compressed bid-to-cover ratios on Amazon’s recent bond tranches down to 1.6x–2.5x. Microsoft bypassed this fatigue because it is one of only two corporations in the S&P 500 (alongside Johnson & Johnson) to hold a perfect AAA / Aaa credit rating—outranking the U.S. federal government itself (AA+ at S&P and Fitch).
1-2. On-Balance-Sheet AAA Bonds (~5.2%) vs. Off-Balance-Sheet SPV Project Finance (~7.0%+)
Several competitors have turned to off-balance-sheet Special Purpose Vehicles (SPVs) backed by private credit funds (Apollo, Blackstone, Blue Owl) to keep data-center debt off their consolidated balance sheets. However, SPV project debt typically carries a Baa2 / BBB rating and commands 7.0% to 7.8% coupons—costing 150 to 250 bps more than Microsoft’s direct AAA senior unsecured notes. By borrowing directly on its pristine balance sheet, Microsoft saves $375M to $625M per year in pre-tax interest on every $25B deployed.
2. The Corporate Finance Math: How Borrowing $25B Lowers WACC (10.85%) and Expands Microsoft’s +10.39% ROIC Spread
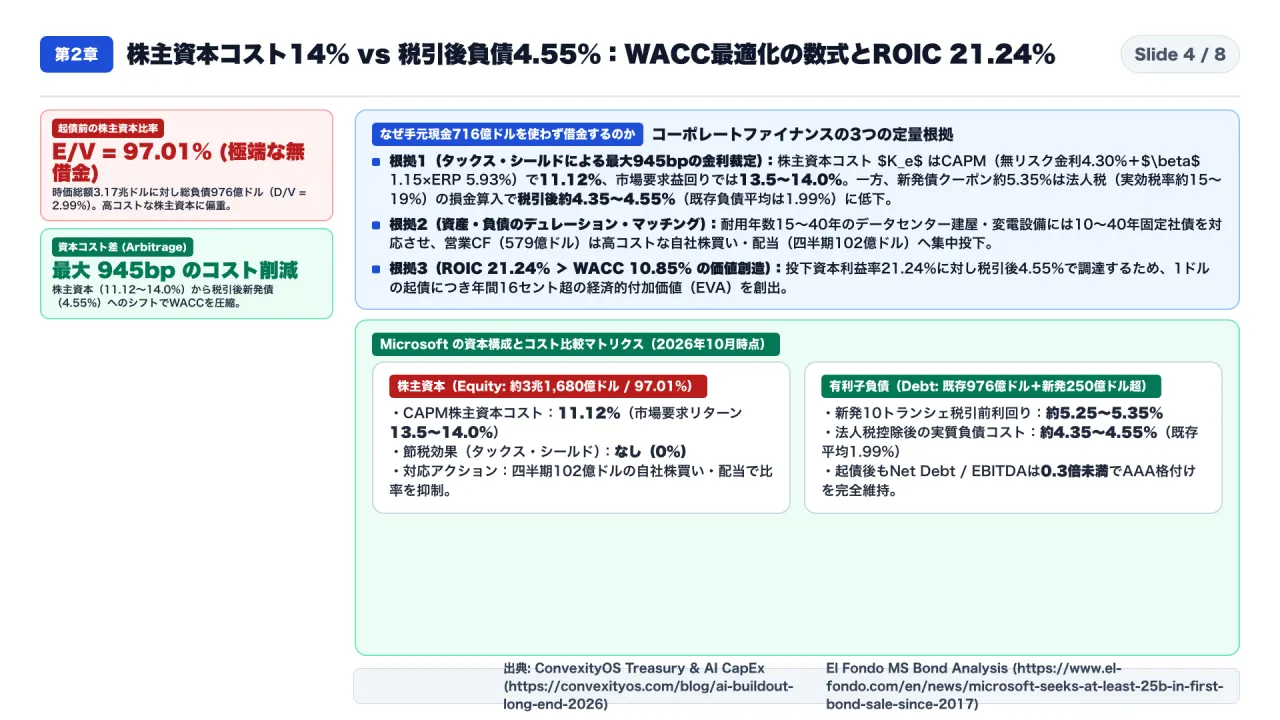
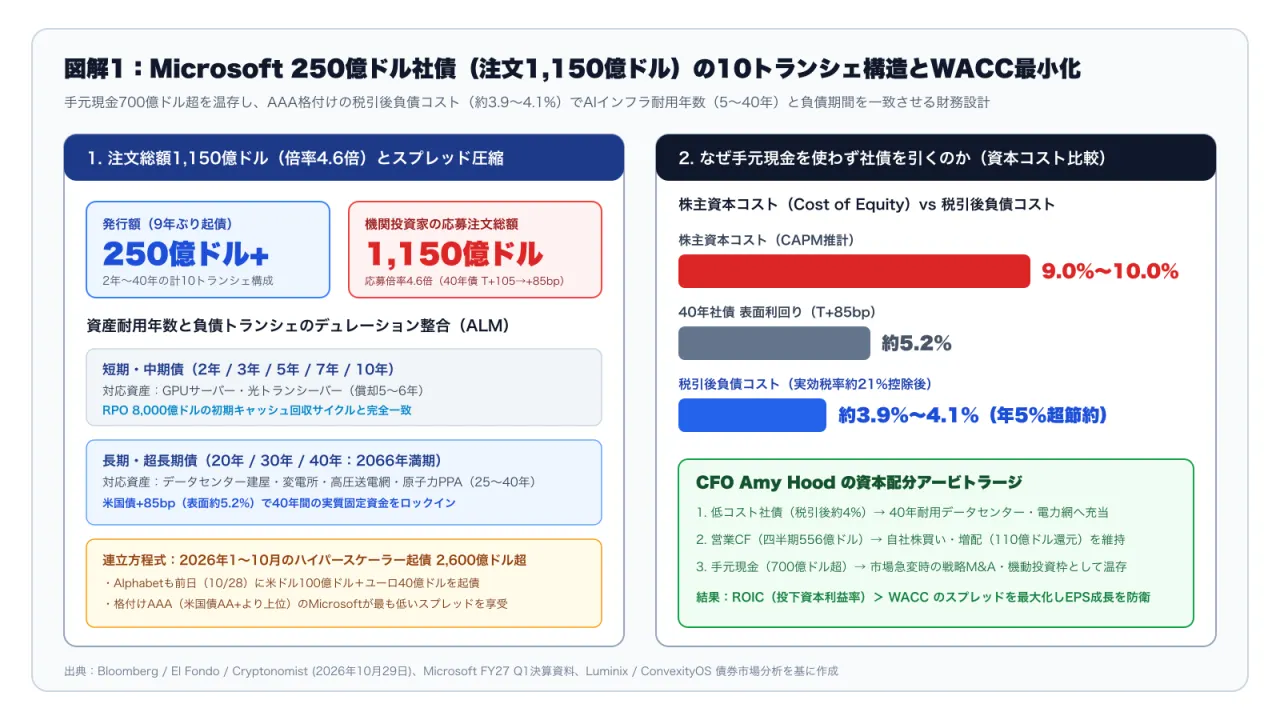
Why not simply pay for data centers out of Microsoft’s $70B+ cash pile or reduce its $10.2B quarterly dividend and share repurchase program? Standard Modigliani-Miller corporate finance with tax shields provides the exact mathematical answer:
2-1. The 650–945 bps Spread Between Cost of Equity (Ke) and After-Tax Cost of Debt (Kd × (1 − t))
- Extreme Under-Leverage (97.01% Equity Weight): Prior to the October 29 issuance, Microsoft’s market capitalization exceeded $3.1 trillion, while total debt stood near $95 billion—meaning its capital structure was 97.01% equity (E/V) and only 2.99% debt (D/V).
- Cost of Equity (Ke = 11.12% to 14.0%): Under CAPM (with a risk-free rate of ~4.5%, equity risk premium of ~5.5%, and Microsoft beta of ~1.20), Microsoft’s baseline cost of equity is 11.12%, while implied market return expectations run 13.0%–14.0%. Crucially, dividends and buybacks paid to equity holders are not tax-deductible.
- After-Tax Cost of Debt (Kd × (1 − t) = 3.95% to 4.55%): Because corporate bond interest is deductible against Microsoft’s marginal corporate tax rate (t ≈ 19%–21%), a 5.20%–5.65% nominal coupon costs only 3.95% to 4.55% after tax.
- WACC Reduction & EVA Creation:
- WACC = (E/V) × Ke + (D/V) × Kd × (1 − t) ≈ 10.85%
- Microsoft’s Return on Invested Capital (ROIC) stands at 21.24%, generating a massive positive economic spread of ROIC − WACC = 21.24% − 10.85% = +10.39%.
- Shifting incremental infrastructure funding from 11.12%–14.0% equity to 4.55% after-tax debt lowers WACC while preserving cash for high-return equity compounding.
2-2. Strict Duration Matching: 40-Year Bonds Buy Land, Shells & Substations—Not 5-Year GPUs
A common critique from equity bears is: “Why issue 30-year and 40-year bonds due in 2066 to buy NVIDIA GPUs that become obsolete in 4 to 6 years?” This misunderstands how Microsoft’s treasury matches asset and liability durations:
- Short-to-Medium Tranches (2Y, 3Y, 5Y, 7Y, 10Y) + Operating Cash Flow ($55.6B/quarter): Fund short-lived compute servers, networking switches, and custom Maia/Cobalt silicon (4–6 year depreciation life), which are paid back within 2.5 years by Microsoft’s $800B contracted RPO.
- Long Tranches (20Y, 30Y, 40Y due 2066): Lock in fixed nominal rates for 30-to-40-year physical infrastructure—concrete data-center shells, high-voltage electrical substations, fiber-optic rights-of-way, water cooling plants, and 20-to-30-year nuclear/renewable power purchase agreements (PPAs).
3. The $52.1 Billion Hyperscaler FCF Divide: Microsoft (+$18.6B) vs. Alphabet (-$9.1B) vs. Amazon (-$33.5B)
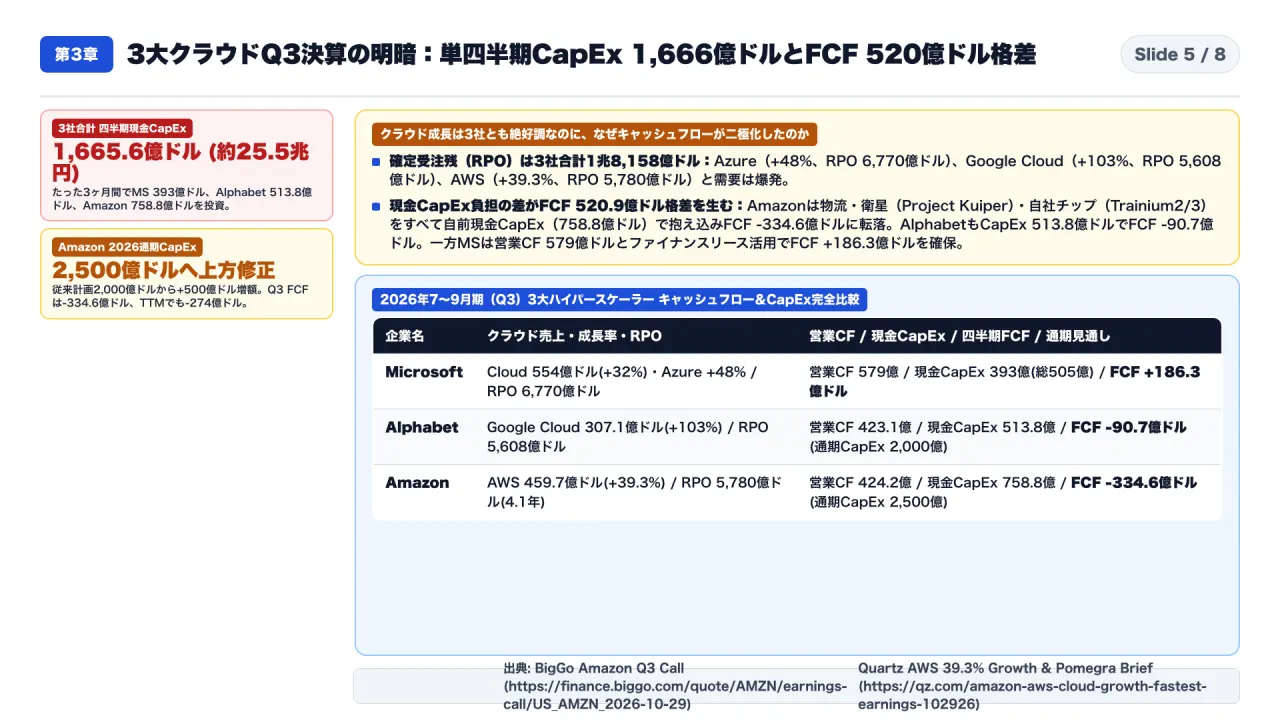
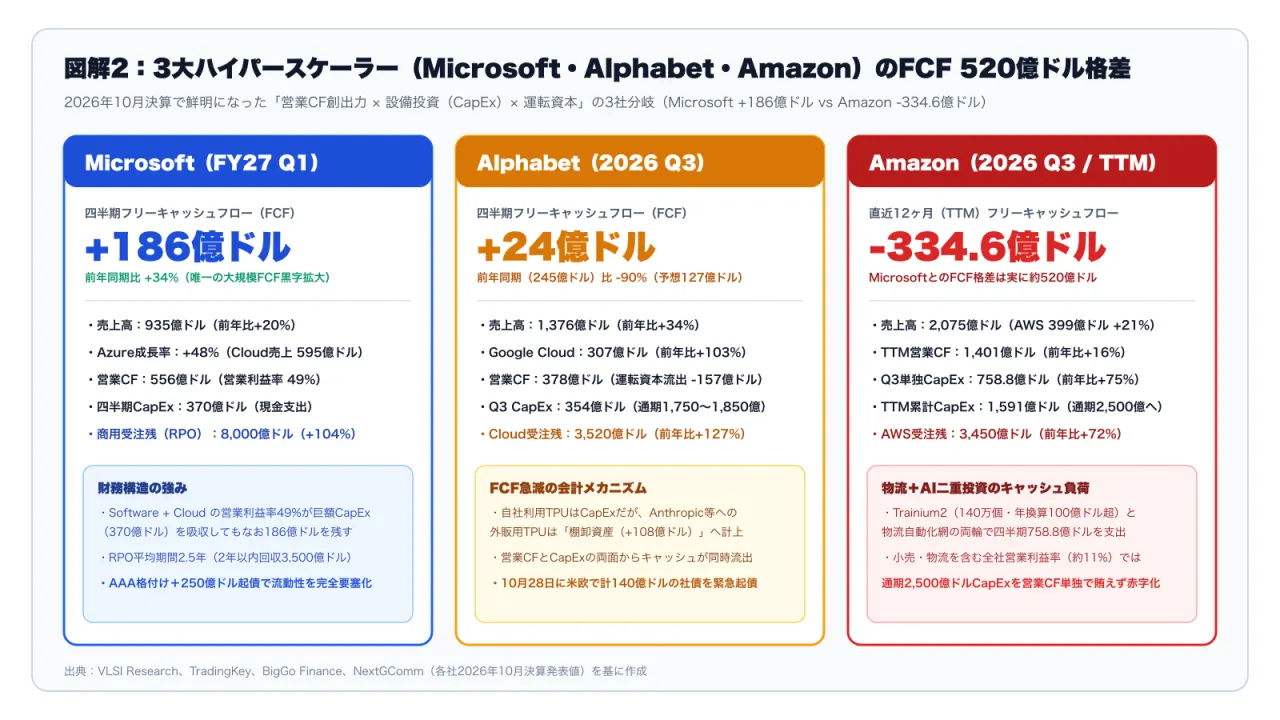
The October 28–29, 2026 earnings cycle marked the end of the era in which all Big Tech giants could self-fund AI CapEx out of free cash flow:
- 1. Microsoft (+$18.63B Quarterly FCF, +34% YoY): Generated $55.6B in OCF, spent $37.0B in cash CapEx ($47.2B including finance leases), and retained +$18.63B in FCF—more than enough to fund $10.2B in dividends and share buybacks without touching a single dollar of bond proceeds.
- 2. Alphabet (-$9.07B Quarterly FCF, 2nd Consecutive Deficit): Despite Google Cloud doubling to $30.71B (+103% YoY, 36.2% operating margin), Alphabet’s cash CapEx surged to $51.4B while OCF ($42.3B) was hit by a $5.2B European Commission fine and $3.22B in working-capital outflows from external TPU hardware inventory (total inventory up 5.45x to $13.31B). Resulting FCF sank to -$9.07B, forcing Alphabet to halt net buybacks, raise $12.4B via an At-The-Market (ATM) equity offering, and issue $14B in USD/EUR bonds.
- 3. Amazon (-$33.46B FCF on $75.88B Single-Quarter CapEx): While AWS accelerated to $39.9B (+39.3% annualized run-rate, $578B backlog) and deployed 1.4 million Trainium2 chips, Amazon’s single-quarter CapEx hit an astonishing $75.88B (+75% YoY) across AI data centers, fulfillment robotics, and Project Kuiper satellites—driving FCF to -$33.46B ($52.09B lower than Microsoft).
4. Tail Risks & Actionable Playbook: The 45% OpenAI RPO Concentration and 3 Metrics to Watch
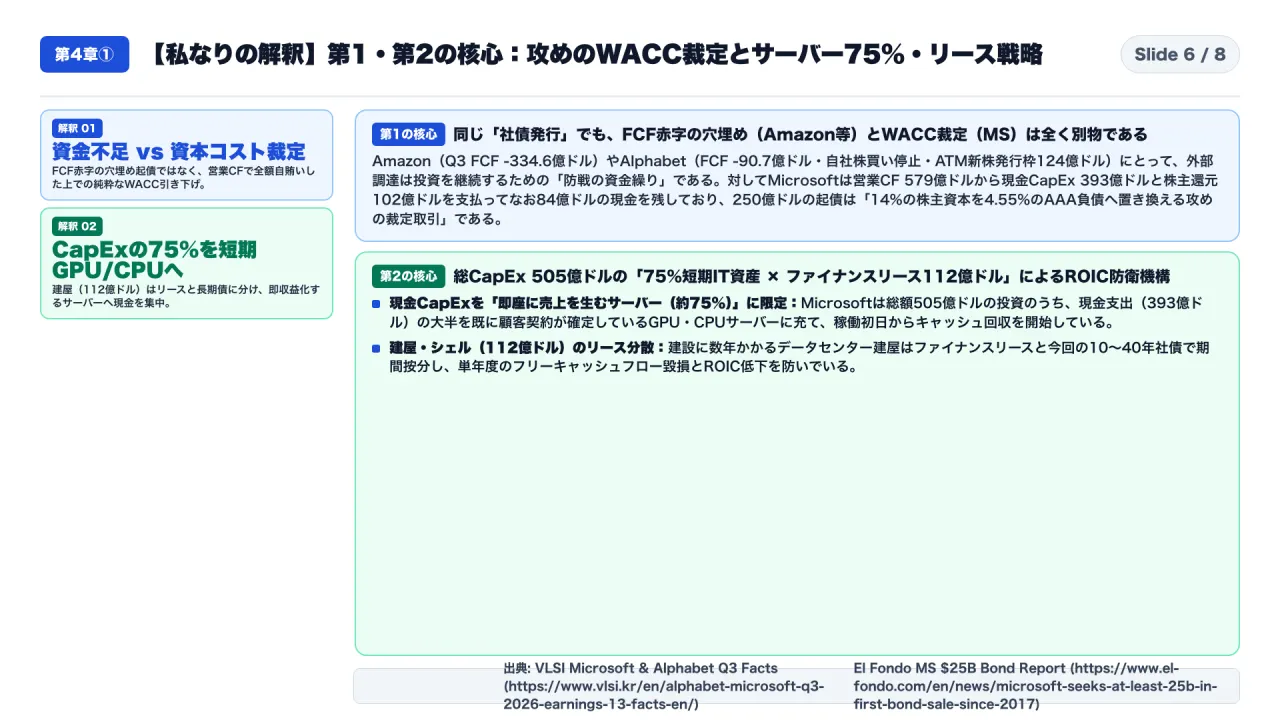
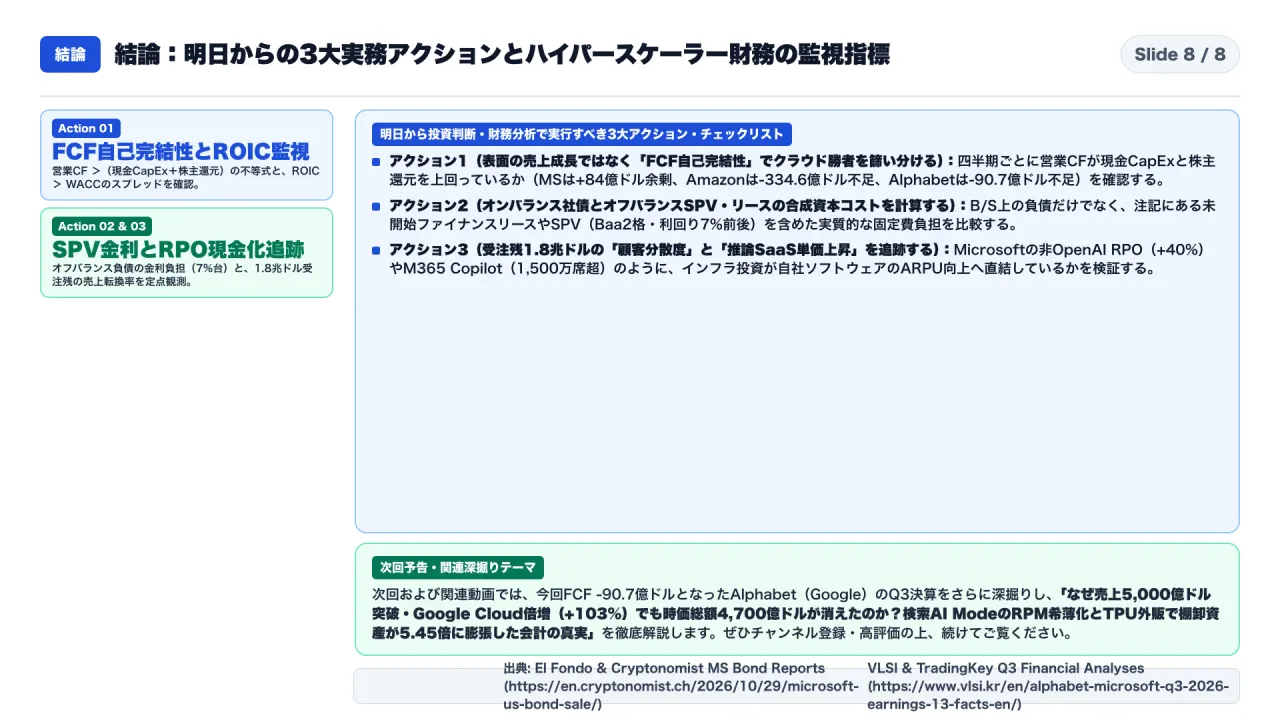
To evaluate hyperscaler capital efficiency over the next 4 quarters, track these three concrete checkpoints:
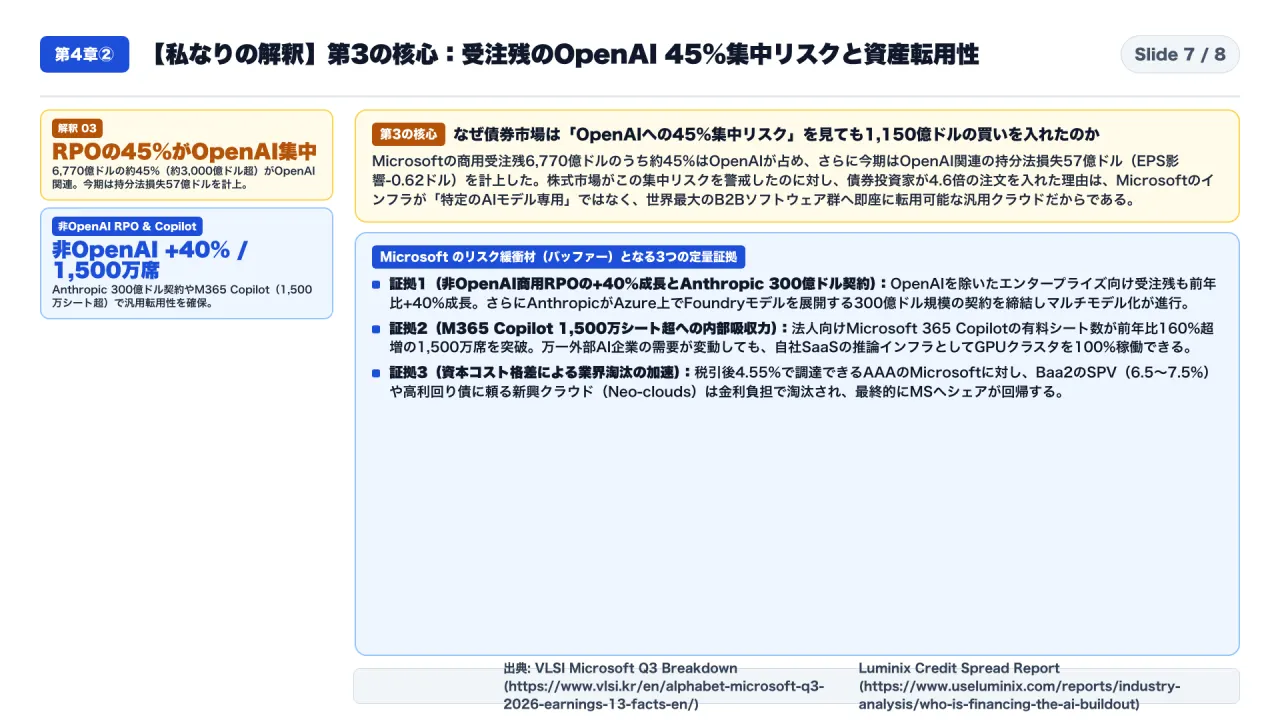
- 1. Strip Out the 45% OpenAI Concentration from Microsoft’s $800B RPO: Roughly 45% (~$360 billion) of Microsoft’s $800B commercial RPO is tied to OpenAI’s multi-year Azure training and inference commitments, while the remaining 55% (~$440 billion) comes from diversified enterprise customers ($350B recognizable within 24 months). Monitor whether enterprise non-OpenAI RPO continues growing >35% YoY independently of frontier lab capital raises.
- 2. Audit Cash CapEx + Finance Leases + Working Capital Inventory Together: Headline “Purchases of Property and Equipment” no longer tells the full story. For Microsoft, compare cash CapEx ($37.0B) against total capital additions including finance leases ($47.2B). For Alphabet, track B/S Inventories ($13.31B) alongside CapEx ($51.4B).
- 3. Watch the Spread Between ROIC (21.24%) and Rising Depreciation Expense: As $140B–$250B annual CapEx cohorts enter service on 4-to-6-year server depreciation schedules, quarterly D&A will climb by $3B–$5B per quarter. The true winner of the AI infrastructure cycle will be the hyperscaler that keeps ROIC > 18% and self-funded FCF > Shareholder Returns.
Primary Sources & References
- El Fondo / Bloomberg: Microsoft Seeks At Least $25B in First Bond Sale Since 2017 (Oct 29, 2026)
- KuCoin / Bloomberg: Microsoft to Raise At Least $25 Billion in Largest Bond Sale Since 2017 (Oct 29, 2026)
- Cryptonomist: Microsoft US Bond Sale Seeks At Least $25B to Fund AI Growth (10 Tranches, 4.6x Demand)
- VLSI Research: Alphabet & Microsoft Q3 2026 Earnings — 13 Facts (Cloud +103%, Azure +48%, CapEx & FCF)
- TradingKey: Amazon Q3 2026 Earnings Report — AWS Growth, $75.88B CapEx & -$33.46B Free Cash Flow
- BigGo Finance: Amazon Q3 FY2026 Earnings Call Transcript & $578B AWS Backlog (Oct 29, 2026)
- NextGComm: Alphabet Q3 2026 Financial Results Analysis (Cloud +103%, TPUs & AI CapEx)
- Luminix Industry Report: AI Data Center Financing in 2026 — Who Is Lending and Who Carries the Risk ($194B Bond Surge)
- ConvexityOS: The AI Buildout Borrowed Long, and the Long End Repriced (30-Year Treasury at 5.64%)
- Pomegra Briefs: Amazon Q3 2026 Earnings & $220B CapEx Analysis (Oct 29, 2026)
- Quartz: Amazon Q3 2026 Earnings — AWS Cloud Unit Grew 39.3%, Fastest in 5 Years
- InsiderFinance: Alphabet Free Cash Flow Sinks to -$9.1B After $51.4B Q3 CapEx Surge