Why AI Memory Demand Is Driving Up Enterprise PC Quotes: The HBM Trade Ratio, Cleanroom Bottlenecks, and Component Bill of Materials
As High Bandwidth Memory (HBM) consumes cleanroom capacity at a 3-to-1 trade ratio against DDR5, memory and storage have surged from a typical 15% to nearly 40% of PC bill of materials while global PC shipments fell 21.2% in Q3 2026.
Published: October 31, 2026 | Read time: ~10 min | Watch Video (Japanese)
Executive Summary: Tracing the Chain from AI Accelerators to Client Computing
Corporate IT directors, chief information officers, and enterprise procurement managers refreshing client hardware in late 2026 face an unexpected budgetary shock: commercial laptop and desktop quotes have escalated sharply. Hardware proposals reflect steep price increases, even as overall enterprise IT hardware budgets remain flat.
The primary driver behind this price surge is not general inflation or assembly labor, but a structural reallocation of semiconductor manufacturing capacity triggered by artificial intelligence workloads.
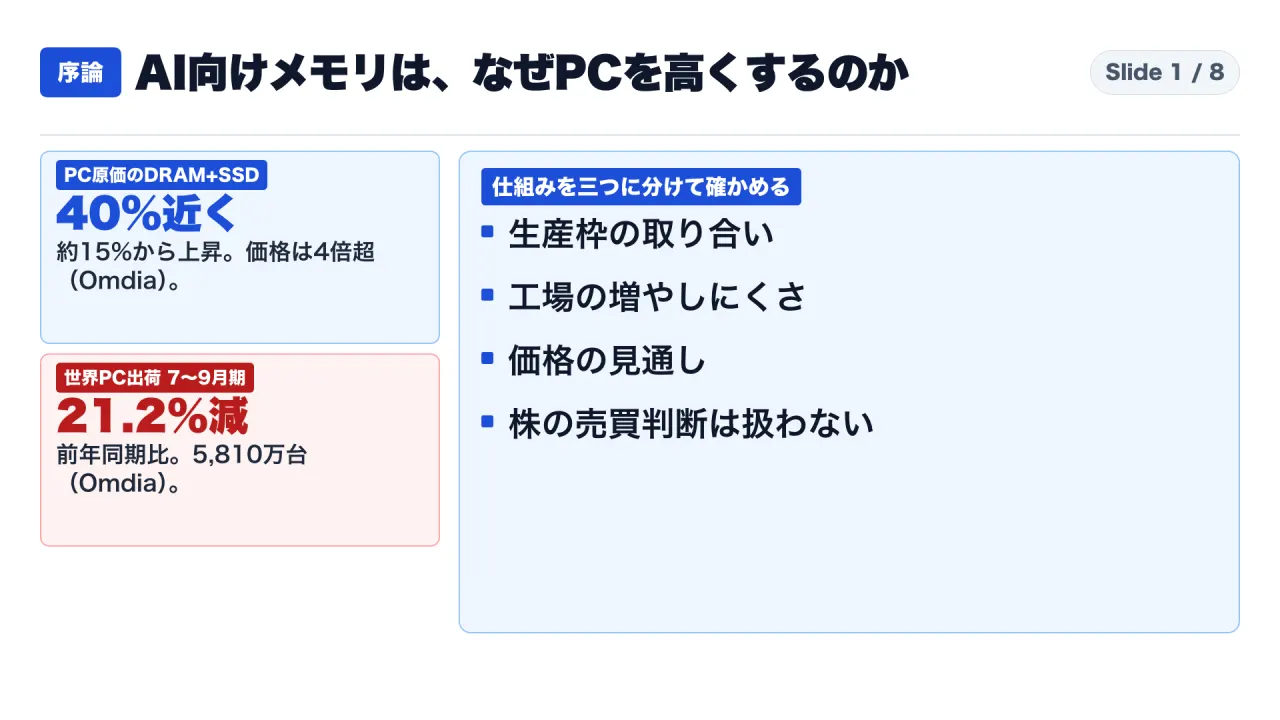
Three primary industry disclosures delineate this supply chain mechanism:
- The Component BOM Distortion: According to research firm Omdia (October 2026), dynamic random-access memory (DRAM) and solid-state drives (SSDs) expanded from their historical level of approximately 15% to nearly 40% of total PC bill-of-materials (BOM) cost, driven by component price increases exceeding 4x. Concurrently, worldwide PC shipments in Q3 2026 fell 21.2% year-over-year to 58.1 million units.
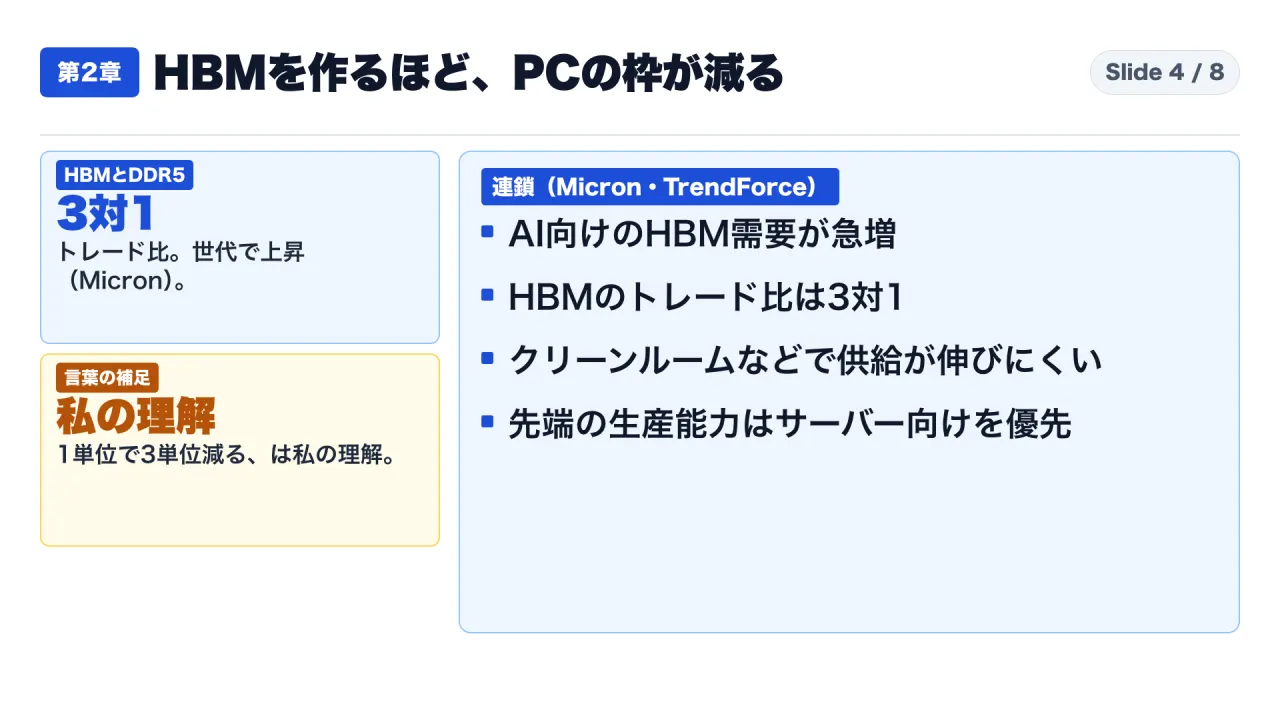
- The “3-to-1 Trade Ratio”: In official earnings disclosures, semiconductor manufacturer Micron Technology revealed that High Bandwidth Memory (HBM) exhibits a “three-to-one trade ratio with DDR5.” Producing one unit of advanced AI memory consumes fab capacity equivalent to three units of standard commodity PC DRAM, with future HBM generations requiring even higher ratios.
- Physical Cleanroom Inelasticity: Cleanroom construction requires multi-year lead times. Micron confirmed that new greenfield fab capacity in Idaho will not yield initial wafers until mid-2027, with meaningful supply volume delayed several quarters further. Consequently, market intelligence firm TrendForce projected conventional DRAM contract prices to rise an additional 10% to 15% in Q4 2026.
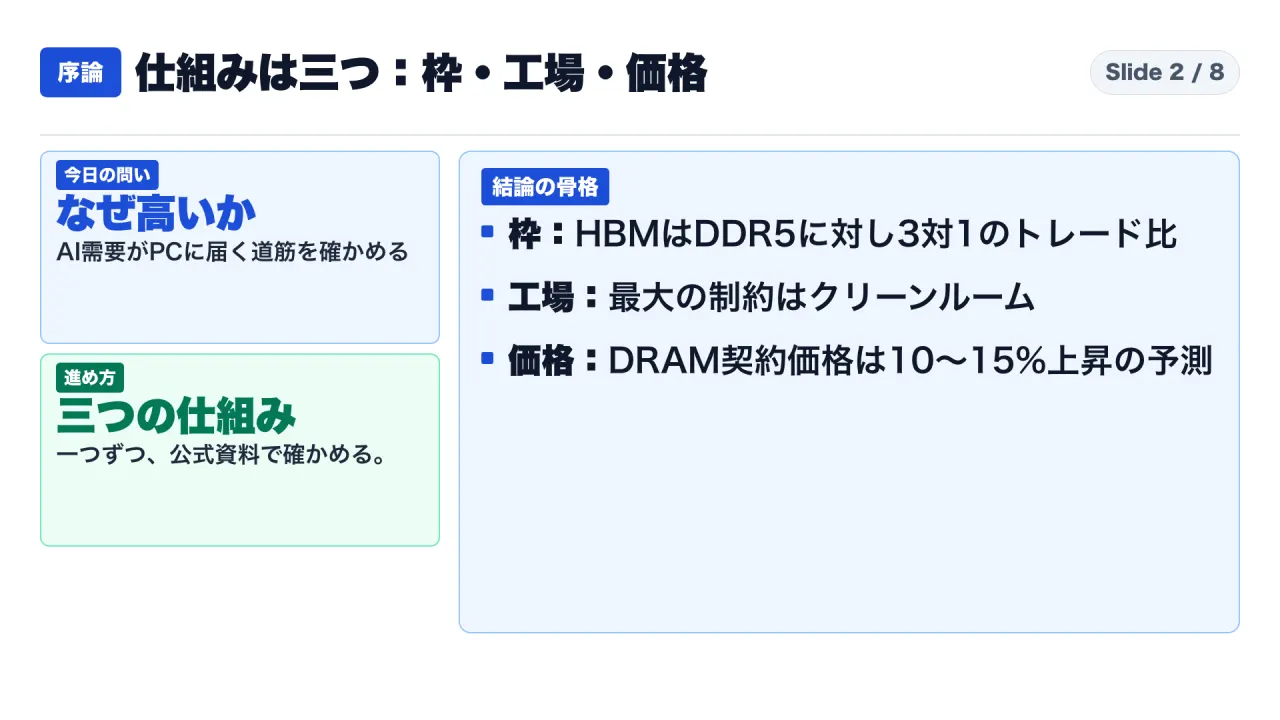
This analysis evaluates the evidence across four distinct evidentiary tiers:
- Verified Facts: Direct statements and quantitative data from Micron earnings releases/transcripts, Omdia market reports, TrendForce pricing analyses, and Intel executive disclosures.
- Industry Forecasts: Forward-looking projections identified by date, firm, and market scope.
- Author Calculations: Mathematical reconciliations of BOM percentages and shipment totals.
- Analytical Interpretations: Structural conclusions regarding procurement leverage and fab allocation dynamics.
1. Client Market Contraction: Shipments Drop 21.2% as Memory Reaches 40% of BOM
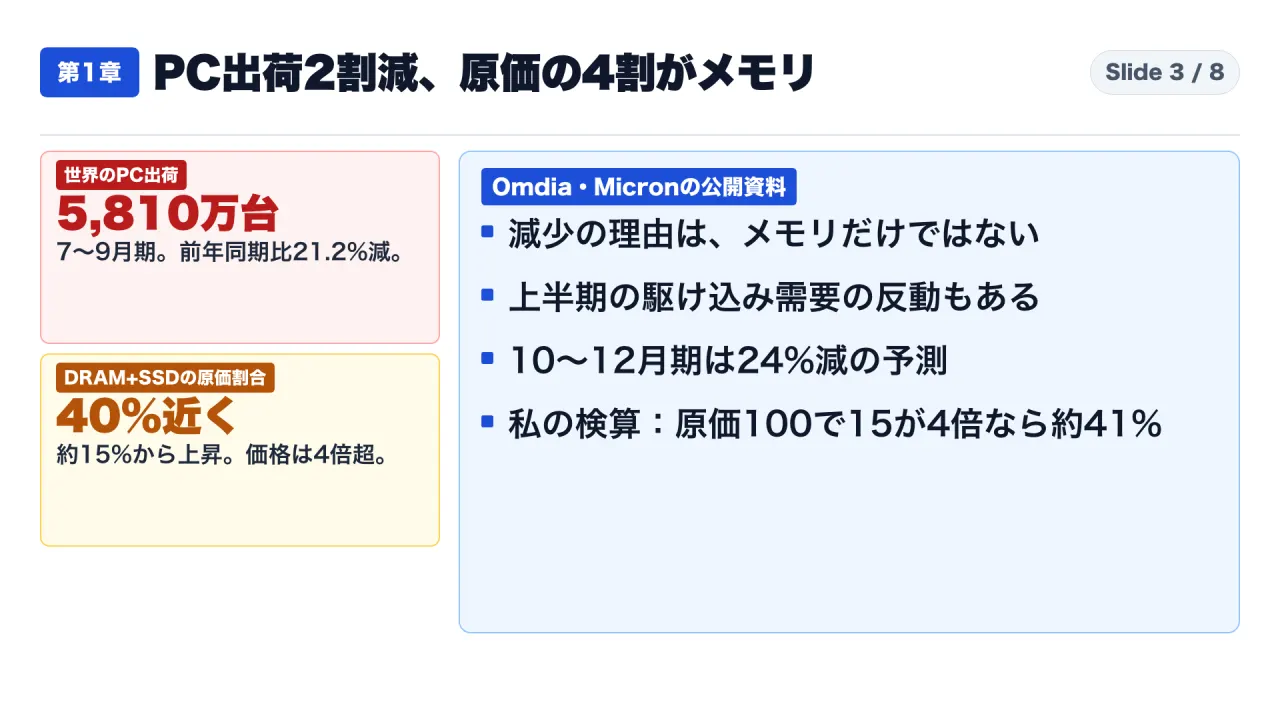
On October 9, 2026, research firm Omdia reported that preliminary worldwide PC shipments (desktops, notebooks, and workstations on a sell-in basis) fell 21.2% year-over-year in Q3 2026 to 58.1 million units—the sharpest quarterly drop since Q1 2023.
The shipment breakdown illustrates broad-based weakness:
- Desktop PCs: Dropped 23.5% year-over-year to 11.7 million units.
- Notebook PCs: Declined 20.6% year-over-year to 46.4 million units (~80% of volume).
- Implied Baseline: Based on the 21.2% drop, author calculations indicate Q3 2025 shipments were approximately 73.7 million units.
OEM performance across top global vendors reflected steep pullbacks:
- Lenovo: Maintained market leadership at 14.9 million units (26% market share).
- HP Inc.: Experienced the steepest contraction among leaders, falling 31% to 10.3 million units (2nd place).
- Dell Technologies: Shipped 7.6 million units (13% market share, 3rd place).
- Apple: Shipped 6.8 million units, declining 11% year-over-year (4th place).
Multiple Factors Behind the Downturn
Omdia emphasized that memory pricing is not the sole factor behind falling shipments:
- Pull-Forward Demand Exhaustion: Aggressive commercial purchasing during early 2026 created an inventory overhang.
- Channel Inventory Digestion: PC makers and contract manufacturers throttled production in Q3 to clear channel stock.
- Broad Component Constraints: Beyond DRAM and NAND flash, shortages in processors and discrete graphics cards complicated inventory planning.
- Average Selling Price (ASP) Increases: OEMs passed memory and SSD cost surges to distributors, causing double-digit ASP increases that dampened unit sales.
Mathematical Verification of the 40% BOM Claim
Omdia disclosed that DRAM and SSD costs escalated from their typical baseline of ~15% to nearly 40% of PC BOM, noting that underlying component prices more than quadrupled (>4x).
To verify whether a 4x price increase reconciles with a 40% BOM share, consider an author-calculated baseline where starting BOM equals 100 arbitrary units:
- Baseline: Memory/SSD = 15 units; Other components = 85 units; Total BOM = 100 units (Memory share = 15.0%).
- If Memory/SSD quadruples (4x): Memory/SSD increases to 60 units. If other components remain flat at 85 units, New Total BOM = 145 units.
- New Memory/SSD Share: 60 / 145 = 41.38% (~41.4%).
| Assumed Component Price Multiple | Memory & SSD Cost Units | Other Components | Total PC BOM | Memory & SSD Share of BOM |
|---|---|---|---|---|
| 3.0x Baseline | 45 units | 85 units | 130 units | 34.62% |
| 4.0x Baseline (Omdia Benchmark) | 60 units | 85 units | 145 units | 41.38% (~41%) |
| 5.0x Baseline | 75 units | 85 units | 160 units | 46.88% |
This arithmetic model confirms that Omdia’s “nearly 40%” BOM metric aligns with a 4x component price surge on a typical 15% starting base.
Alignment with Intel Executive Disclosures
Disclosures from Intel reinforce this client slowdown. In prepared remarks released on October 29, 2026, Intel executive leadership stated that customers signaled client deceleration specifically due to memory pricing and availability constraints. Intel reported that rising system costs compressed IT budgets, planning for full-year 2026 PC TAM to contract ~12% (with H2 declining over 20%), followed by a further ~10% decline in 2027.
2. The 3-to-1 Trade Ratio: How HBM Cannibalizes Conventional DRAM Capacity
In client computing, devices utilize standard DDR5 or LPDDR5 DRAM. In AI data centers, accelerators utilize High Bandwidth Memory (HBM).
What Micron Stated in Earnings Disclosures
In earnings call transcripts across fiscal 2026, Micron Technology detailed the capacity conflict between HBM and standard DRAM:
- December 2025 (Q1 FY26 Call): Executive management stated that surging HBM demand constrained market supply due to “the three-to-one trade ratio with DDR5,” adding that this trade ratio would increase further in future HBM generations.
- March 2026 (Q2 FY26 Call): Management highlighted four factors constraining DRAM bit growth: cleanroom limitations, long construction lead times, the rising trade ratio of HBM, and slowing bit density gains per wafer during advanced node transitions.
- September 2026 (Q4 FY26 Call): Chief Operating Officer Manish Bhatia reaffirmed that next-generation HBM architectures introduce even higher trade ratios, projecting HBM demand to outgrow conventional DRAM through 2028.
Interpreting the “Trade Ratio”
A 3-to-1 trade ratio signifies that dedicated fab capacity allocated to produce one unit of HBM reduces the output of standard DDR5 DRAM by approximately three units.
However, critical analytical caveats must be noted:
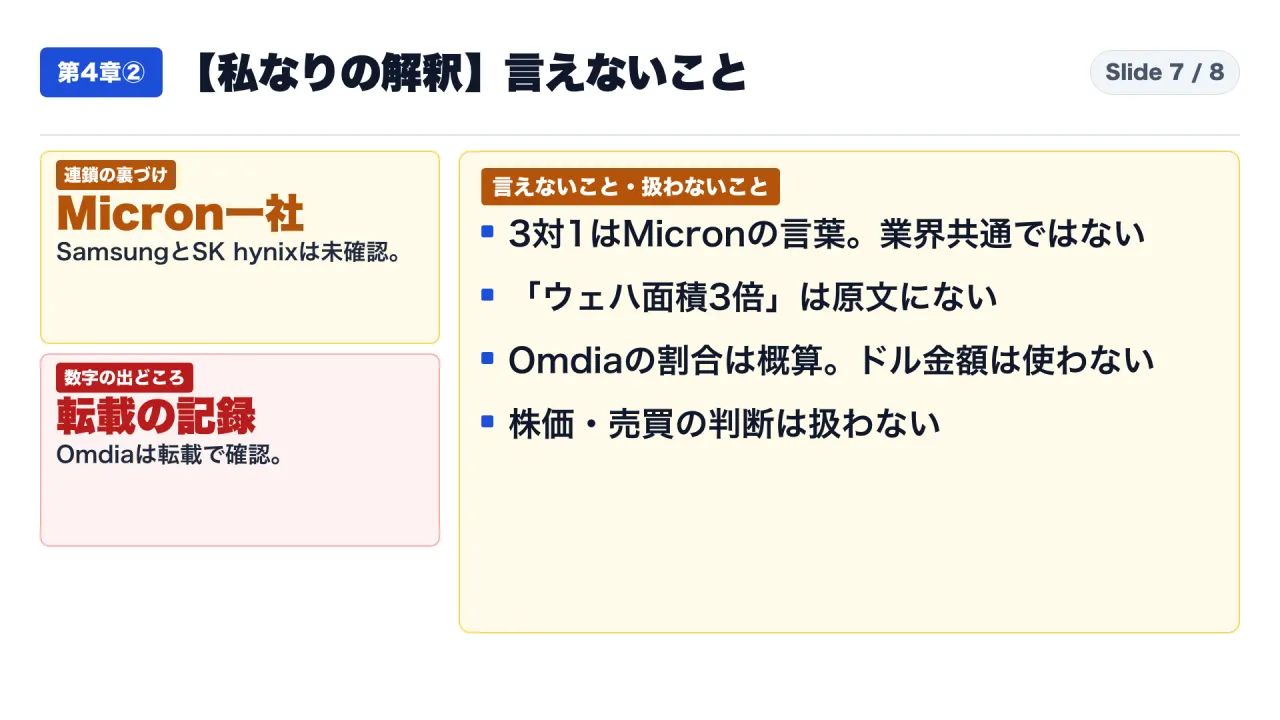
- Verbatim Limits: Micron disclosed the phrase “three-to-one trade ratio with DDR5” without specifying whether the ratio measures raw wafer area, manufacturing process steps, or shipped bit volume.
- Media Extrapolations: Secondary reports often assert that “HBM requires 3x the wafer area.” That is an unverified journalistic paraphrase; Micron’s official filings omit that specific formulation.
- Manufacturer Scope: The 3-to-1 metric reflects Micron’s stated operations. Public disclosures from competitors Samsung Electronics and SK hynix were not audited for this review.
Contract Delivery vs. Market Shortage
Importantly, TrendForce reports confirm that memory suppliers did not halt PC DRAM shipments. Throughout 2026, suppliers fulfilled agreed contractual volumes to PC OEMs each quarter. However, because excess wafer capacity was redirected to high-margin AI accelerators and enterprise RDIMMs (spurred by agentic AI workloads executing on host CPUs), the open market experienced an aggregate structural deficit, driving contract prices steadily upward.
3. Physical Cleanroom Bottlenecks and Contract Price Trajectories
Why cannot memory manufacturers simply expand production? The answer lies in cleanroom construction lead times.
Multi-Year Lead Times for Greenfield Fabs
In Micron’s September 2026 earnings conference, COO Manish Bhatia stated that the industry’s primary operational constraint is physical cleanroom space. Modern EUV lithography and advanced through-silicon via (TSV) packaging require specialized cleanroom environments.
Micron executives disclosed the following capital project milestones:
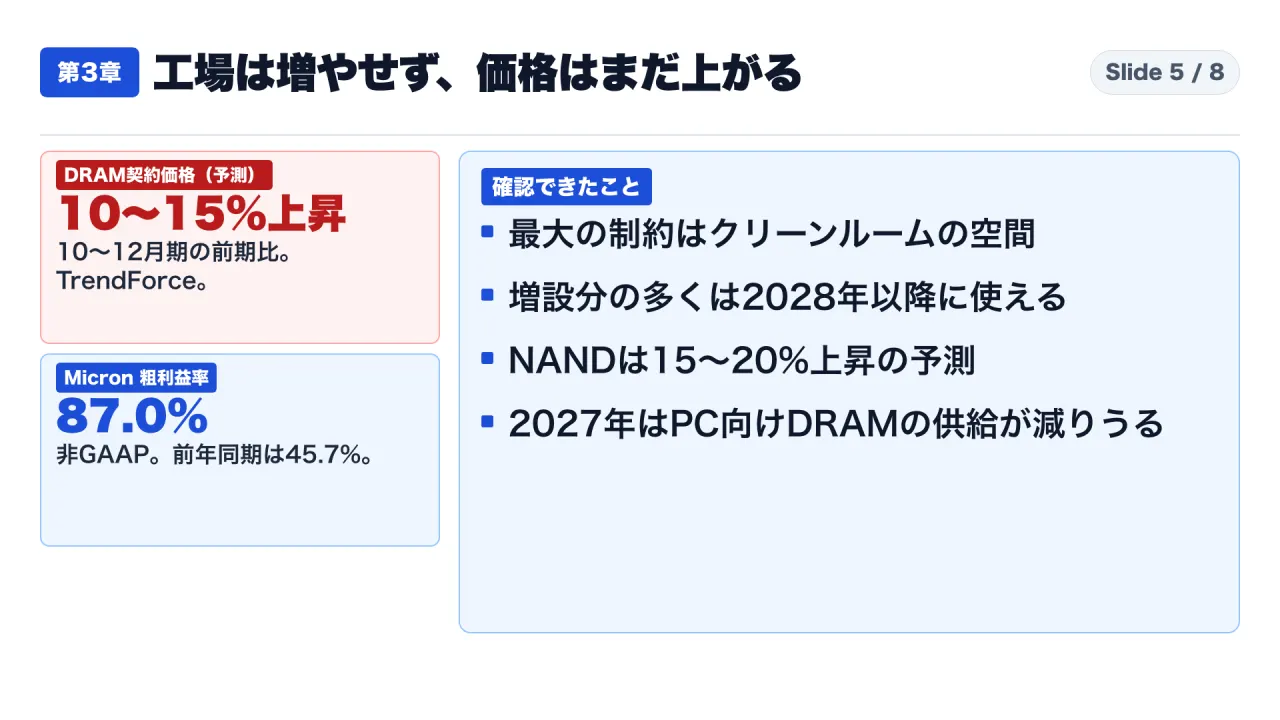
- Most capital expenditures represent construction costs for cleanroom shells that will not become available until post-2028.
- For Micron’s leading greenfield fab in Idaho, initial wafer output is scheduled for mid-2027.
- Executive leadership noted that achieving meaningful volume production requires several subsequent quarters, stating: “we really don’t have line of sight to when supply and demand balances.”
- For fiscal year 2026 (ended September 3, 2026), Micron invested $27.37 billion in capital expenditures.
TrendForce Contract Price Forecasts
On September 30, 2026, TrendForce published its Q4 2026 memory price outlook, projecting quarterly contract price trajectories:
- Conventional DRAM Contract Prices: Projected to increase 10% to 15% quarter-over-quarter in Q4 2026.
- NAND Flash Contract Prices: Projected to rise 15% to 20% quarter-over-quarter in Q4 2026.
- Enterprise SSD Bit Demand: Projected to surge over 80% in 2026, positioning enterprise SSDs as the only storage category experiencing accelerating price growth.
- Client PC Adaptation: To mitigate escalating BOM costs, PC OEMs began actively reducing SSD capacity configurations in volume models.
Semiconductor Vendor Profit Margins
In its Q4 FY2026 earnings release (period ended September 3, 2026), Micron reported:
- Quarterly Revenue: Reached $54.20 billion, up 31% from Q3 ($41.46B) and up 4.8x from Q4 FY25 ($11.30B).
- Full-Year FY2026 Revenue: Totaled $133.19 billion, compared to $37.38B in FY2025 (~3.6x increase).
- Non-GAAP Gross Margin: Reached 87.0% in Q4 FY26, compared to 45.7% in Q4 FY25—an expansion of 41.3 percentage points.
While an 87.0% gross margin demonstrates extraordinary pricing power, financial disclosures commingle pricing gains, volume shipments, and high-margin HBM product mix, preventing analysts from isolating the exact profit margin on standalone PC DRAM.
4. Analytical Interpretation: The Capacity Allocation Mechanism
Evaluating these disclosures reveals a clear economic chain:
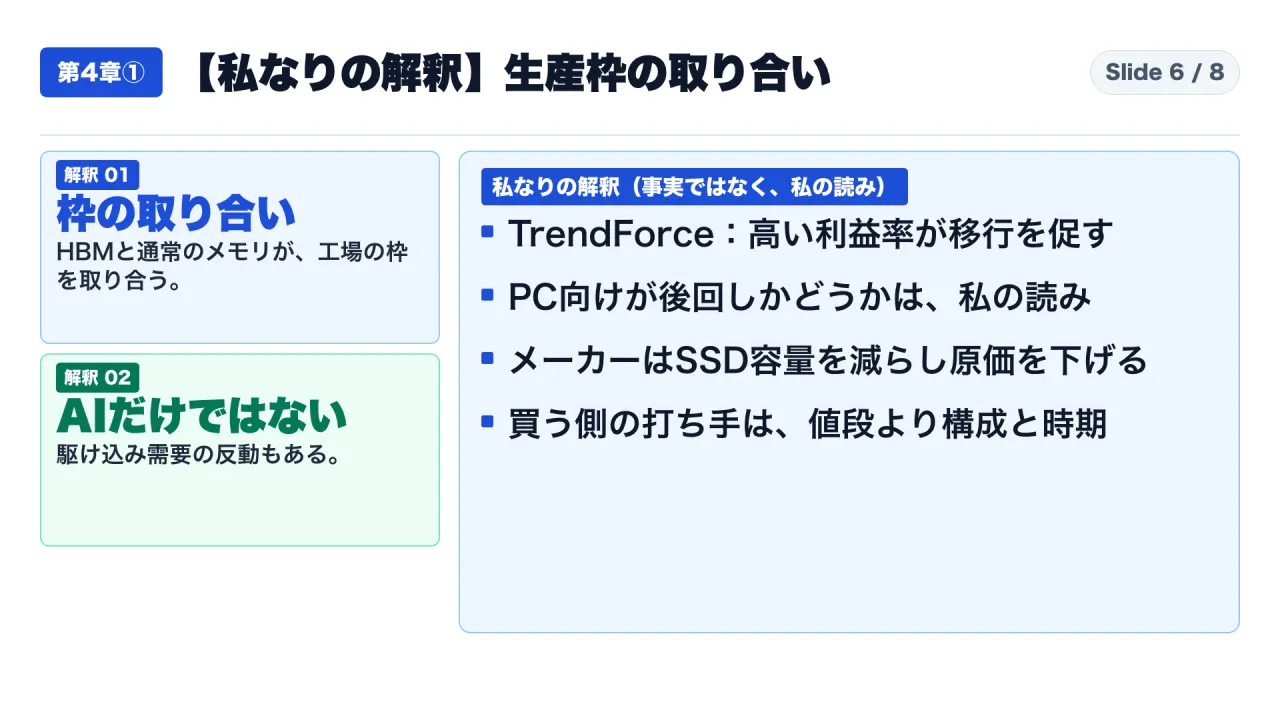
- Economic Priority Favors AI Compute: Faced with cleanroom bottlenecks and a 3-to-1 displacement ratio, rational semiconductor manufacturers prioritize HBM and high-density enterprise RDIMMs, which command premium pricing and 80%+ gross margins.
- PC DRAM Is Structurally De-Prioritized: PC OEMs continue receiving baseline contractual allocations, but residual production capacity is constrained. Client computing bears the market price adjustments.
- OEMs Compensate via Spec Reduction: Just as PC manufacturers downsize baseline SSD and memory configurations to defend margins, corporate buyers must adjust procurement strategies rather than accepting inflated quotes.
5. Practical Enterprise IT Playbook for Commercial Hardware Procurement
Corporate procurement teams, system administrators, and finance controllers should implement a disciplined 3-step procurement strategy:
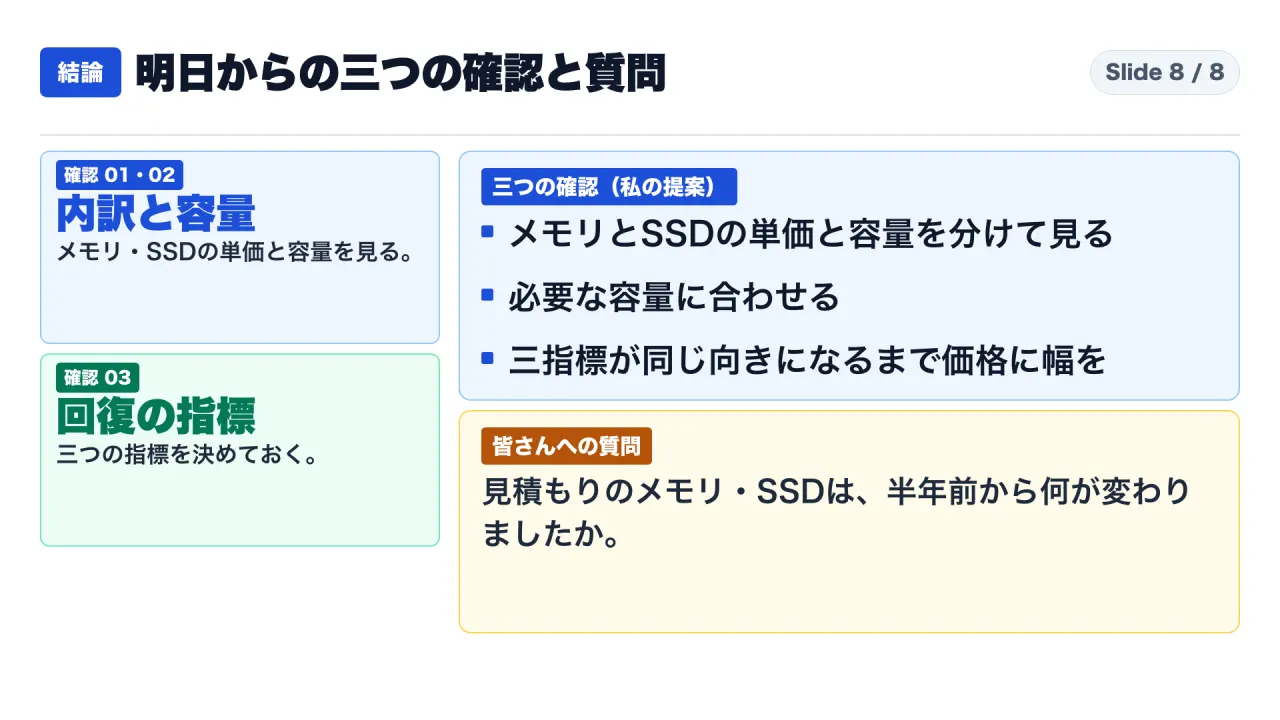
- Step 1: Unbundle Memory and Storage Line Items: Require OEMs to itemize memory capacity, memory type (DDR5 vs. LPDDR5x), SSD capacity, and SSD interface speed on separate lines. Compare component pricing against purchase orders from six months prior.
- Step 2: Right-Size Device Configurations via Telemetry: Inspect internal device telemetry across employee laptops to evaluate actual 95th-percentile RAM utilization. If standard enterprise knowledge workers average 11 GB of RAM utilization, procuring 32 GB laptops at inflated component premiums represents capital waste. Maintain 16 GB configurations for standard workers, reserving 32 GB and 64 GB tiers strictly for engineering workloads.
- Step 3: Establish Three Market Recovery Indicators: Track three independent recovery signals before signing multi-year fleet renewals: TrendForce quarterly conventional DRAM price trajectories, memory vendor cleanroom supply-demand disclosures, and Omdia quarterly PC unit shipment stabilization.
Frequently Asked Questions
Does a 3-to-1 trade ratio mean HBM consumes exactly three times the wafer area?
No. Micron disclosed a “three-to-one trade ratio with DDR5” without defining the specific technical metric (wafer area, fab processing steps, or bit output). Characterizing it as “three times the wafer area” is an unverified secondary phrasing.
Will PC prices drop by 2027?
Public disclosures provide no basis for such an assumption. TrendForce forecasts cover Q4 2026 (projecting 10% to 15% conventional DRAM price increases) and note that PC DRAM supply may tighten further in 2027 as capacity shifts to servers. Micron indicated that initial wafer output from its Idaho fab will not commence until mid-2027, with no clear visibility on when supply and demand will balance.
Are Samsung and SK hynix experiencing the same trade ratios as Micron?
This analysis is strictly based on Micron, Omdia, TrendForce, and Intel public disclosures. Samsung and SK hynix were not audited in this review, and Micron’s specific trade ratio cannot be assumed identical across competitors.
Did AI cause the entire 21.2% drop in PC shipments?
No. Omdia cited multiple factors, including pull-forward demand in early 2026, retail channel inventory digestion, processor/GPU shortages, and elevated selling prices. AI memory demand is a major cost driver, but not the sole cause of shipment declines.
Primary Sources and References
- Micron Technology, Inc. Q1 FY2026 Earnings Call Transcript (Motley Fool, December 17, 2025):
https://www.fool.com/earnings/call-transcripts/2025/12/17/micron-mu-q1-2026-earnings-call-transcript/ - Micron Technology, Inc. Q2 FY2026 Earnings Call Transcript (Motley Fool, March 18, 2026):
https://www.fool.com/earnings/call-transcripts/2026/03/18/micron-mu-q2-2026-earnings-call-transcript/ - Micron Technology, Inc. Q4 FY2026 Earnings Call Transcript (Webull, September 30, 2026):
https://www.webull.com/news/15672802111996928 - Micron Technology, Inc. Q4 and Full-Year FY2026 Results Release (GlobeNewswire, September 30, 2026):
https://finviz.com/news/397277/micron-technology-inc-reports-record-fiscal-fourth-quarter-and-full-year-2026-results - TrendForce 4Q26 Memory Contract Price Outlook (September 30, 2026):
https://www.trendforce.com/presscenter/news/20260930-13258.html - Omdia Global PC Shipments Fall 21% in 3Q26 (BusinessWire, October 9, 2026):
https://www.financialcontent.com/article/bizwire-2026-10-9-omdia-global-pc-shipments-fall-21-in-3q26-as-pull-forward-demand-subsides - Intel Corporation Q3 2026 Prepared Remarks (October 29, 2026):
https://d1io3yog0oux5.cloudfront.net/_47986fe477a6ac84fe34efbcbf38dd13/intel/db/887/9273/prepared_remarks/Q3%2726_Prepared_Remarks.pdf