Alphabet’s Free Cash Flow Turned Negative: Who Funded the Gap in the Cash Flow Statement?
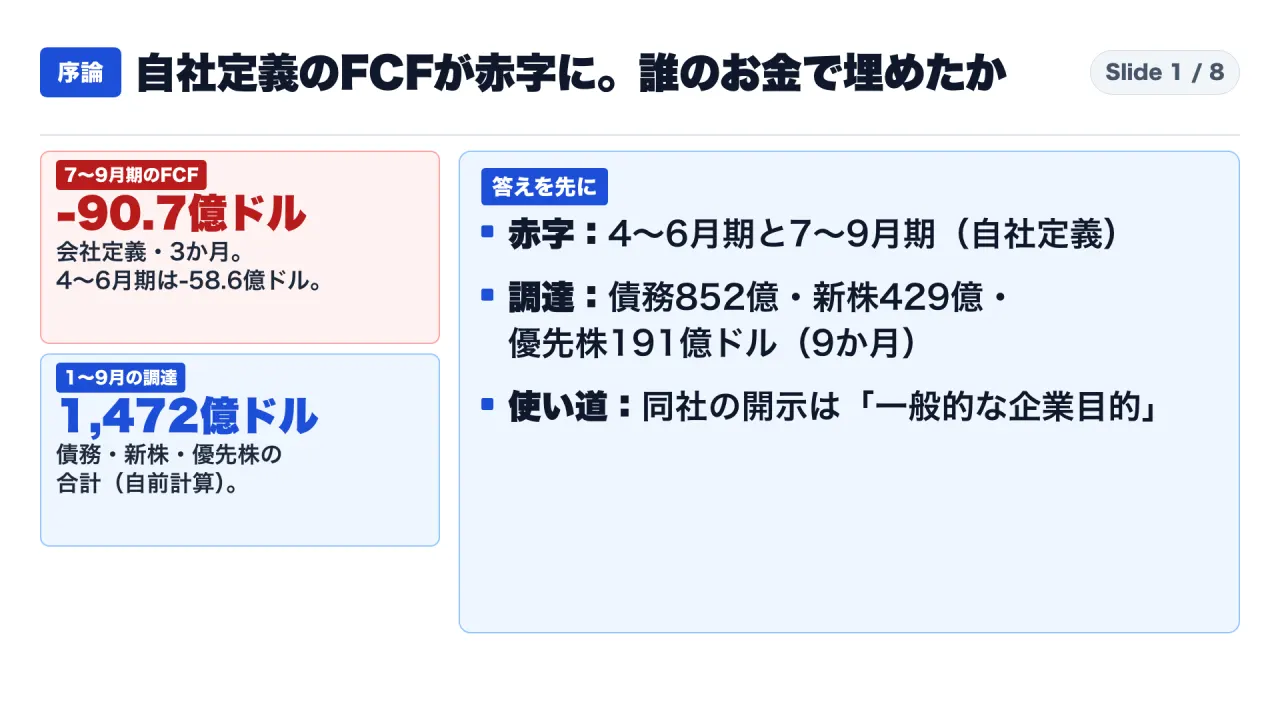
While Alphabet reported negative company-defined free cash flow of -$5.86B in Q2 and -$9.07B in Q3 2026 as 9-month capex doubled to $132B, the company raised $147.2B across debt, common equity, and mandatory convertible preferred stock while halting share buybacks.
Published: October 31, 2026 | Read time: ~10 min | Watch Video (Japanese)
Executive Summary: Distinguishing Cash Flow Deficits from Corporate Distress
When financial headlines reported that Alphabet Inc. posted negative free cash flow (FCF) in consecutive quarters during 2026, commentary often framed the development as an alarming sign of tech distress. Google’s parent company posted negative FCF of -$5.86 billion in Q2 2026 (three months ended June 30, 2026) and -$9.07 billion in Q3 2026 (three months ended September 30, 2026).
However, corporate treasury directors, credit analysts, and finance executives must examine primary SEC filings before conflating quarterly timing with solvency risk.
An audit of Alphabet’s Form 10-Q for the period ended September 30, 2026, reveals three structural realities:
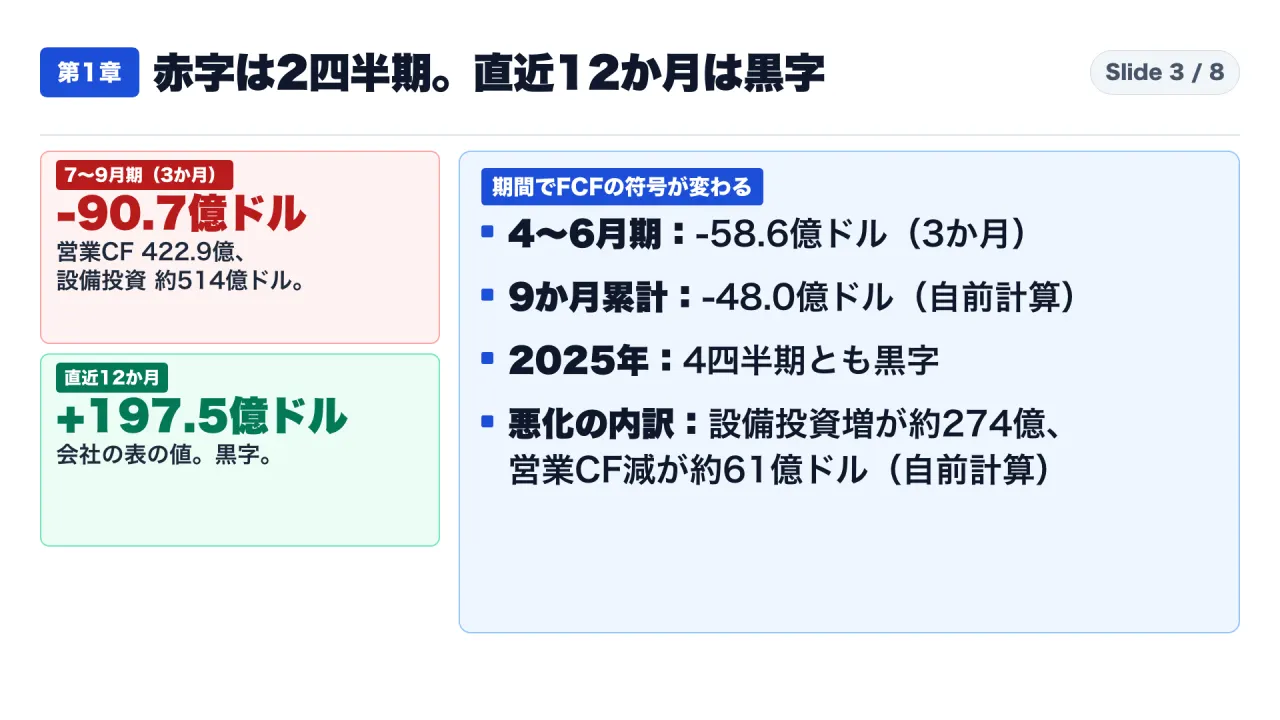
- Periodicity Determines the Sign: While Alphabet recorded negative FCF across the standalone middle quarters of 2026, it generated positive free cash flow of $19.75 billion on a Trailing Twelve Month (TTM) basis across Q4 2025 through Q3 2026. Over the cumulative nine months ended September 30, 2026, operating cash flow of $127.15 billion nearly covered capital expenditures of $131.95 billion, leaving a modest deficit of -$4.80 billion.
- Financing Vastly Exceeded the Deficit: Rather than merely covering the $4.80 billion shortfall, Alphabet raised a massive $147.16 billion in gross financing proceeds across debt ($85.22 billion), common equity ($42.87 billion), and mandatory convertible preferred stock ($19.06 billion).
- Capital Allocation Shifted from Buybacks to Physical Compute: Share repurchases were cut to exactly zero during the first nine months of 2026, down from $39.81 billion in the prior-year period. Cash was intentionally redirected into artificial intelligence infrastructure.
This article examines Alphabet’s cash position using a four-tier framework:
- Verified Facts: Direct accounting data from Alphabet’s earnings releases and SEC Form 10-Q filings.
- Company Explanations: Management’s stated use of proceeds and infrastructure commentary.
- Author Calculations: Mathematical reconciliations, cumulative totals, and ratios.
- Analytical Interpretations: Structural conclusions regarding capital allocation and balance sheet leverage.
1. Dissecting the Deficit: Seven Quarters of Operating and Free Cash Flow
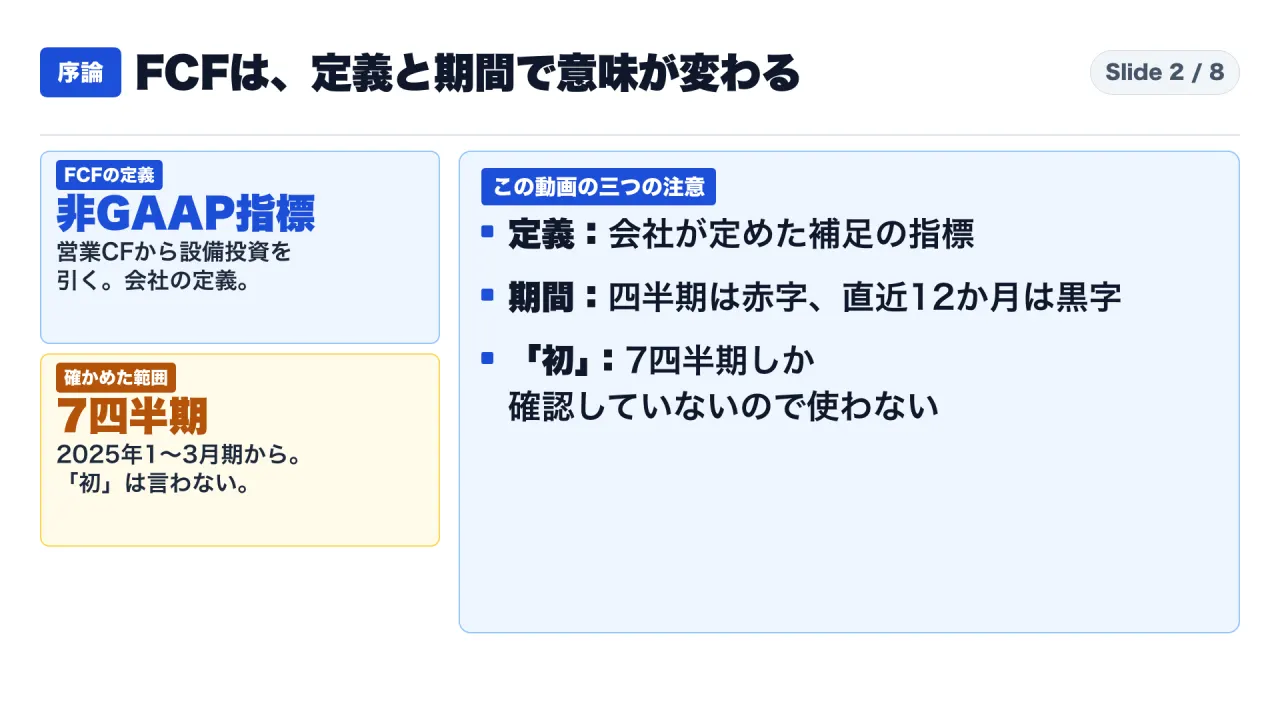
Free cash flow is not a standardized GAAP metric. In non-GAAP reconciliations attached to its quarterly releases, Alphabet defines free cash flow as:
Alphabet Non-GAAP Free Cash Flow = Net Cash from Operating Activities - Capital Expenditures (Purchases of Property and Equipment)
The table below compiles Alphabet’s reported cash flows across seven consecutive quarters (Q1 2025 through Q3 2026):
| Quarter | Net Cash from Operations (OCF) | Capital Expenditures (Capex) | Company-Defined FCF | Accounting Character |
|---|---|---|---|---|
| Q1 2025 (Jan - Mar 2025) | $36,150M ($36.15B) | $17,197M ($17.20B) | +$18,953M (+$18.95B) | Strong positive FCF |
| Q2 2025 (Apr - Jun 2025) | $27,747M ($27.75B) | $22,446M ($22.45B) | +$5,301M (+$5.30B) | Positive FCF |
| Q3 2025 (Jul - Sep 2025) | $48,414M ($48.41B) | $23,953M ($23.95B) | +$24,461M (+$24.46B) | Highly cash-generative |
| Q4 2025 (Oct - Dec 2025) | $52,402M ($52.40B) | $27,851M ($27.85B) | +$24,551M (+$24.55B) | Peak operating cash flow |
| Q1 2026 (Jan - Mar 2026) | $45,790M ($45.79B) | $35,674M ($35.67B) | +$10,116M (+$10.12B) | Capex accelerates to $35.7B |
| Q2 2026 (Apr - Jun 2026) | $39,069M ($39.07B) | $44,924M ($44.92B) | -$5,855M (-$5.86B) | First quarterly deficit |
| Q3 2026 (Jul - Sep 2026) | $42,290M ($42.29B) | $51,355M ($51.36B) | -$9,065M (-$9.07B) | Capex tops $51B |
In Q3 2026, free cash flow deteriorated by $33.53 billion compared to Q3 2025 (shifting from +$24.46 billion to -$9.07 billion). Author calculations decompose the shift:
- Capex growth: Rose by $27.40 billion (from $23.95 billion to $51.36 billion), driving 81.7% of the cash flow decline.
- Operating cash flow contraction: Fell by $6.12 billion (from $48.41 billion to $42.29 billion), explaining 18.3%.
Timeframes Change the Metric Sign
Financial conclusions depend heavily on the measurement window:
| Measurement Period | Calculation Basis | Free Cash Flow Output | Strategic Takeaway |
|---|---|---|---|
| Q2 2026 (Standalone 3 Months) | Disclosed Release | -$5,855M (-$5.86B) | Capex outpaced operating receipts |
| Q3 2026 (Standalone 3 Months) | Disclosed Release | -$9,065M (-$9.07B) | Largest quarterly cash deficit |
| Cumulative 9 Months (Jan - Sep 2026) | $127,149M - $131,953M | -$4,804M (-$4.80B) | Q1 surplus ($10.1B) offsets middle quarters |
| Trailing 12 Months (Q4 2025 - Q3 2026) | $179,551M - $159,804M | +$19,747M (+$19.75B) | Robust cash generation over full year |
Claims that Alphabet suffers from structural cash burn collapse when evaluated across standard planning horizons. Standalone quarterly deficits reflect physical build schedules rather than operating insolvency.
2. Capex Acceleration: $132B in Nine Months vs. Depreciation Lag
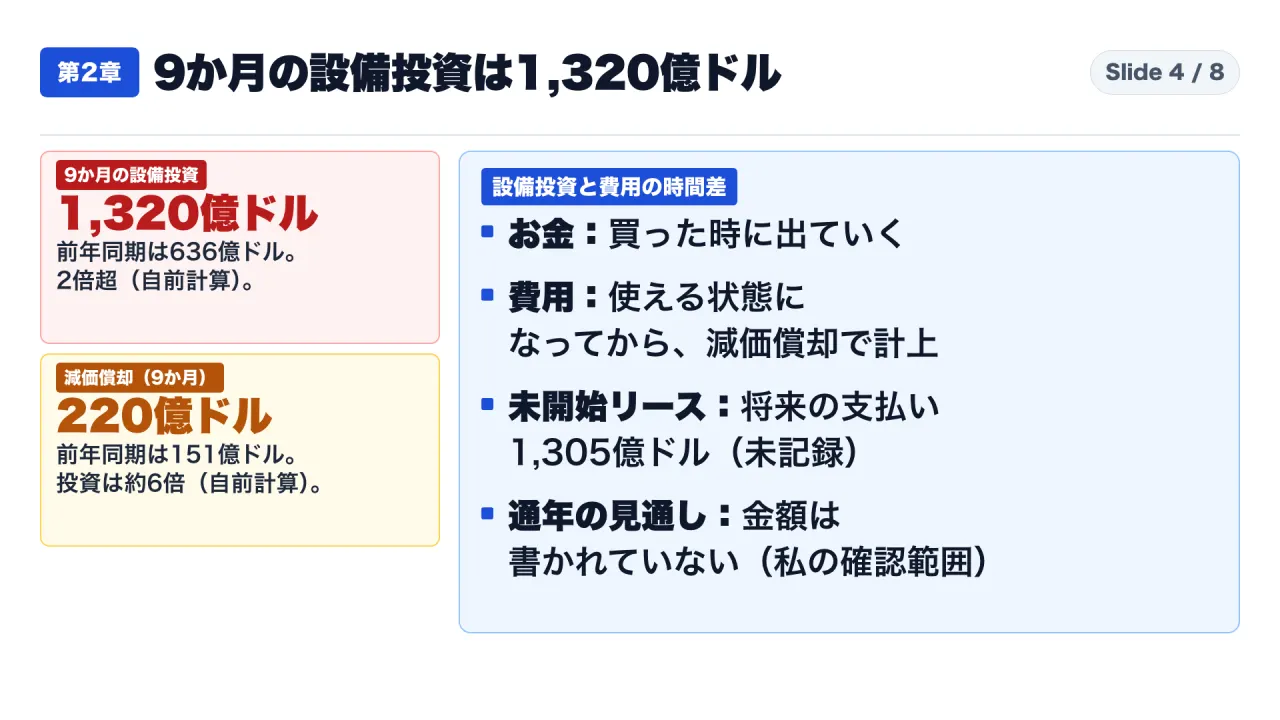
Capital expenditures reached $131.95 billion ($132.0 billion rounded) during the nine months ended September 30, 2026, compared to $63.60 billion in the prior-year period. Capital spending surged by approximately 2.07 times year-over-year, driven by investments in technical infrastructure including servers, networking equipment, and data centers.
The 6x Multiple Over Depreciation
Under GAAP, cash leaves the balance sheet immediately upon equipment purchase, but depreciation is recognized on a straight-line basis only after assets are placed in service.
During the first nine months of 2026, Alphabet recorded $22.0 billion in depreciation and amortization expense (up from $15.1 billion in the prior-year period). Author calculations show:
Nine-Month Capex ($131.95B) / Nine-Month Depreciation ($22.0B) = 6.0x
Cash capital outlays are running at six times the rate at which existing infrastructure depreciates. While not all $132 billion will hit immediate future income statements, operating profits will face rising depreciation headwinds as facilities become operational.
Uncommenced Commitments: $130.5B in Future Leases
Note 6 (Leases) of Alphabet’s Q3 2026 Form 10-Q discloses significant contractual obligations. As of September 30, 2026, Alphabet had undiscounted future lease commitments of $130.5 billion, primarily for data centers and energy infrastructure, scheduled to commence between 2026 and 2031. These represent major future cash obligations not yet recognized on the balance sheet.
3. Dissecting the $147.2B Capital Inflow: Debt, Equity, and Preferred Stock
If Alphabet experienced a nine-month FCF deficit of $4.80 billion, what funded the gap? Alphabet’s cash flow statement reveals an unprecedented balance sheet recapitalization:
| Line Item (in Millions of USD) | 9M Ended Sep 30, 2025 | 9M Ended Sep 30, 2026 | Change | Capital Allocation Purpose |
|---|---|---|---|---|
| Operating Cash Flow (OCF) | $112,311M | $127,149M | +$14,838M | Strong core cash generation |
| Capital Expenditures (Capex) | -$63,596M | -$131,953M | -$68,357M | Massive AI physical compute build |
| Net Debt Issuance Proceeds | $38,002M | $85,222M | +$47,220M | Senior unsecured notes and borrowing |
| Repayments of Debt | -$26,094M | -$8,879M | +$17,215M | Lower principal repayments |
| Common Stock Issuance Proceeds | $0M | $42,870M | +$42,870M | Public offering, private sale, ATM facility |
| Preferred Stock Issuance Proceeds | $0M | $19,063M | +$19,063M | Mandatory convertible preferred stock (6.25%) |
| Common Stock Buybacks | -$39,810M | $0M | +$39,810M | Complete halt of share buybacks |
| Dividends Paid | -$7,513M | -$8,167M | -$654M | Common and preferred cash dividends |
| Cash Used in Investing Activities | -$68,515M | -$217,171M | -$148,656M | Capex plus marketable securities purchases |
| Cash from (Used in) Financing | -$44,416M | +$115,757M | +$160,173M | Pivot from cash return to capital raising |
Author calculations aggregate gross external capital raised across all three financing channels:
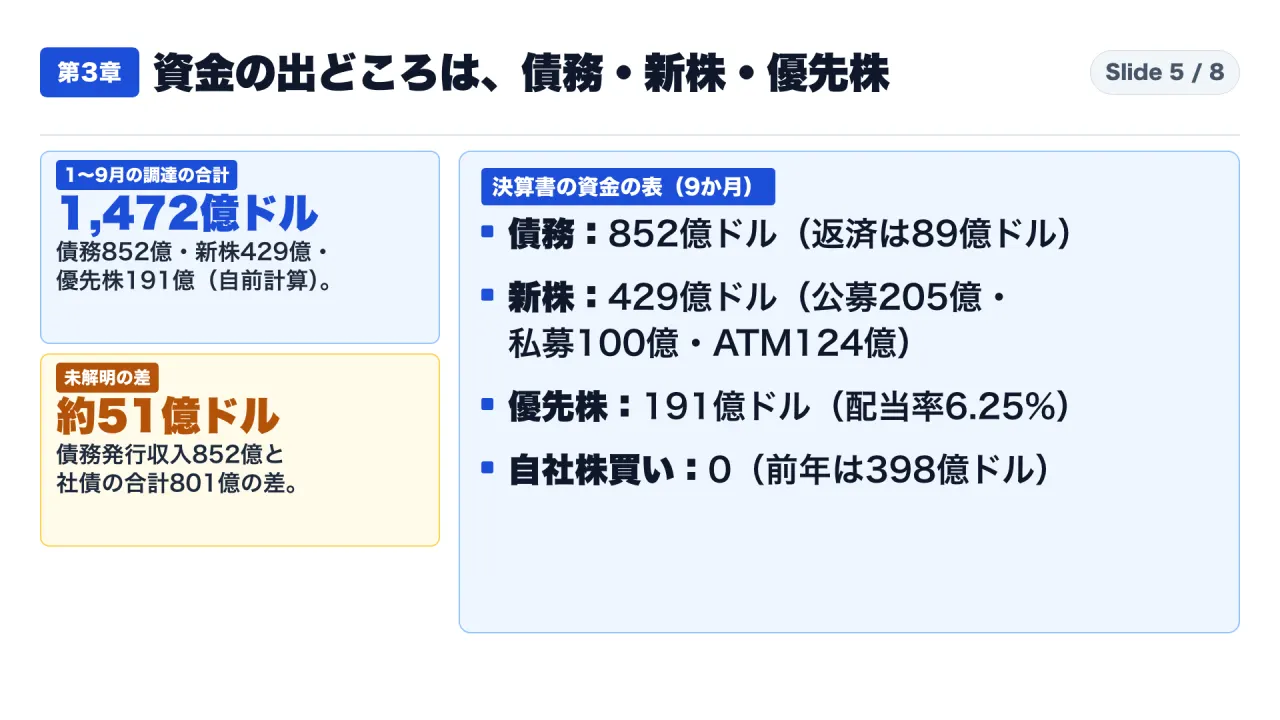
$85,222M (Debt) + $42,870M (Common Equity) + $19,063M (Preferred Equity) = $147,155M (~$147.2B)
Alphabet did not merely borrow $4.8 billion to plug a hole; it raised $147.2 billion, completely dwarfing the operational shortfall.
The Three Financing Channels and the Buyback Halt
- Debt Issuance ($85.22B Net): Alphabet significantly expanded institutional leverage. In Q3 2026, U.S. dollar notes carried a weighted-average coupon of 5.55% (15-year maturity); Australian dollar notes carried 5.82% (8-year maturity). Long-term debt reached $125.10 billion as of September 30, 2026 (up from $46.50 billion at year-end 2025). Third-quarter interest expense increased to $967 million (excluding $405 million capitalized into construction), compared to $143 million in Q3 2025.
- Common Stock Offerings ($42.87B Net): In June 2026, Alphabet completed a public offering generating $20.50 billion and a private placement generating $10.00 billion. In Q3 2026, Alphabet issued shares via its At-the-Market (ATM) facility, raising $4.30 billion in Class A and $8.10 billion in Class C shares ($12.40 billion total). Out of $40.0 billion ATM capacity, $27.60 billion remained at quarter-end.
- Mandatory Convertible Preferred Stock ($19.06B Net): In June 2026, Alphabet issued mandatory convertible preferred stock generating $19.06 billion net. These shares pay a 6.25% annual dividend rate and convert into common equity at a future date.
- The Complete Buyback Halt: During 9M 2025, Alphabet spent $39.81 billion on share repurchases. During 9M 2026, buybacks were zero. Alphabet eliminated share repurchases to conserve cash for AI compute.
Stated Use of Proceeds and the $5.1B Discrepancy
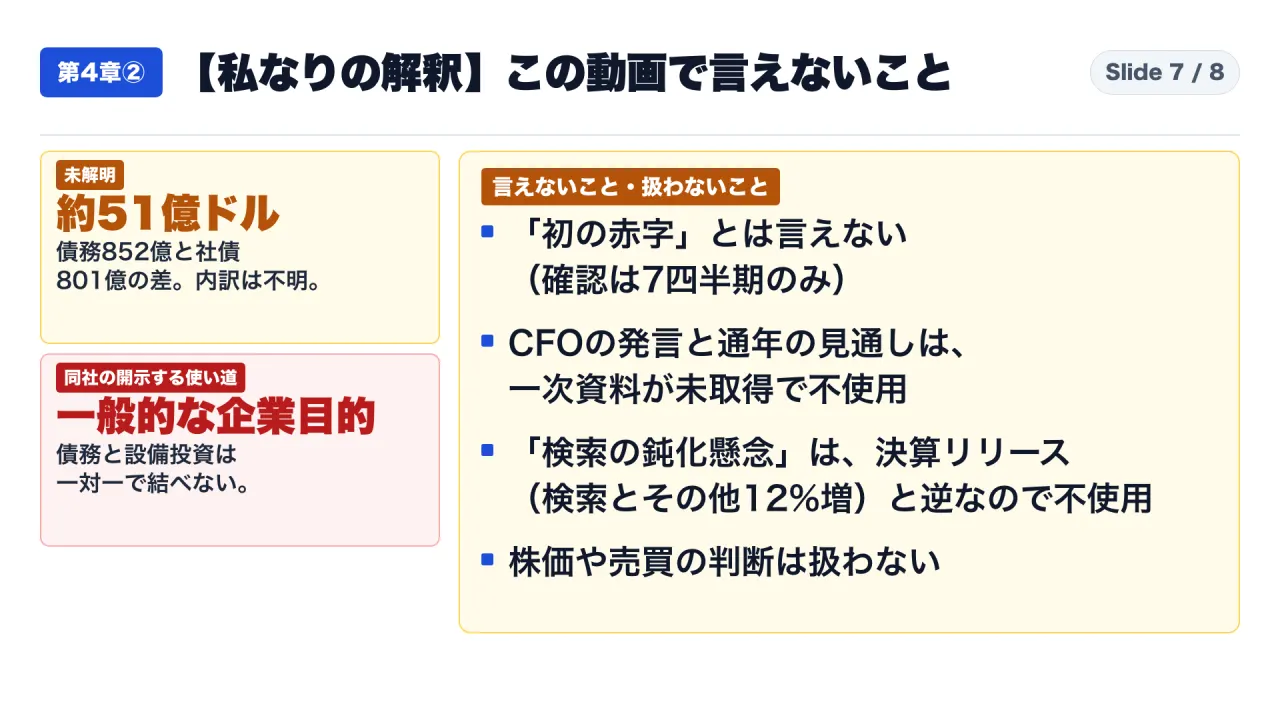
Alphabet stated debt proceeds were for “general corporate purposes,” while June equity/preferred proceeds were for “general corporate purposes, including capital expenditures.” Corporate cash is fungible; debt cannot be mapped one-to-one to data centers.
Furthermore, summing quarterly earnings release debt issuances yields $80.10 billion (Q1 $31.1B + Q2 $20.3B + Q3 $28.7B), whereas the cash flow statement reports $85.22 billion. This $5.12 billion variance remains unspecified in public footnotes and is recorded as “unresolved.”
4. Operational Solvency vs. Capital Structure Headwinds
Is Alphabet facing liquidity risk? The balance sheet answers clearly:
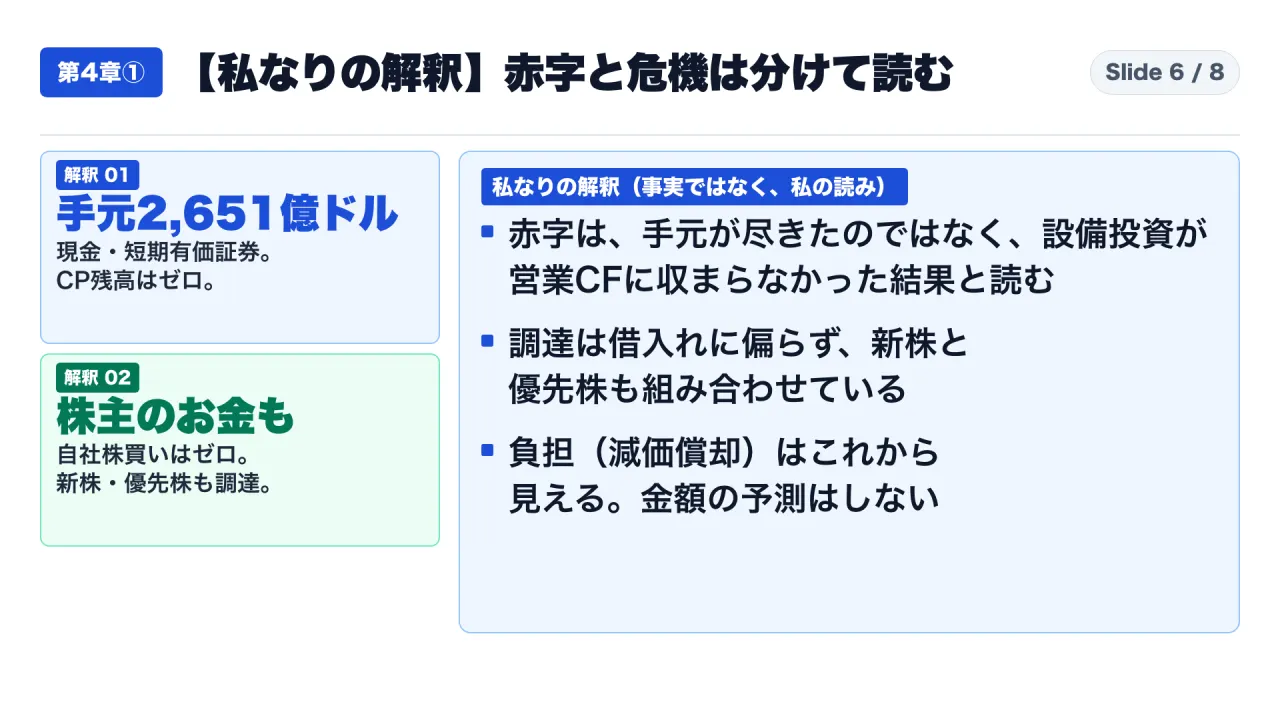
- Cash and Marketable Securities: As of September 30, 2026, Alphabet held $265.10 billion in cash and liquid securities.
- Commercial Paper: Balance was zero against an undrawn $25.00 billion facility.
- Operating Health: In Q3 2026, consolidated revenue grew 25% year-over-year to $127.60 billion, Google Cloud surged 103% to $30.70 billion, and operating margin was 31.8%. Core operations remain highly cash-generative.
However, the capital structure shift introduces long-term financial commitments:
- Rising Fixed Interest Charges: Long-term debt reached $125.10 billion at ~5.55% interest, creating nearly $1.0 billion in quarterly interest.
- Preferred Dividend Commitments: The $19.1 billion preferred stock requires an ongoing 6.25% annual cash dividend ($1.19 billion annually).
- Subsequent Non-Recourse Debt: In October 2026, Waymo secured a $5.00 billion credit facility at Term SOFR plus 5.25% maturing in October 2032. While non-recourse to Alphabet Inc., it signals subsidiary-level borrowing.
5. Practical Due Diligence Playbook for Cash Flow Deficits
For corporate treasurers, credit analysts, and controllers assessing cash flow deficits, Alphabet’s disclosures provide a 3-step audit methodology:
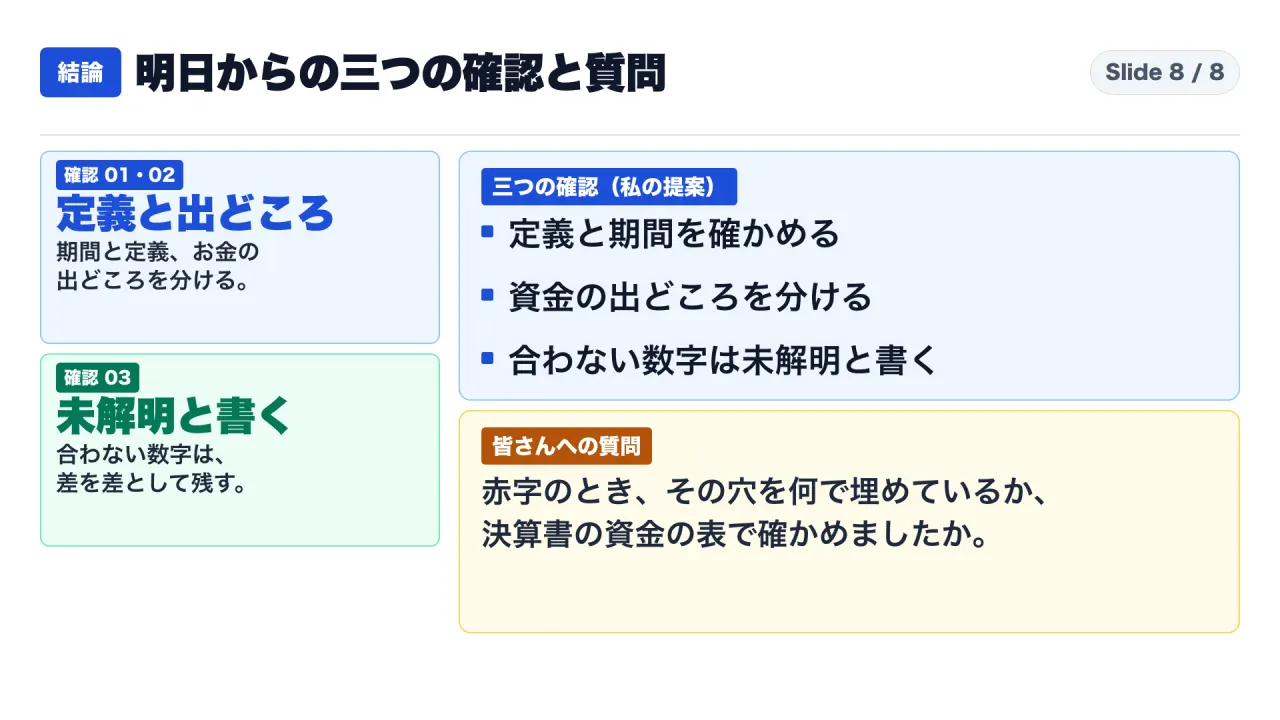
- Step 1: Check Definition and Accounting Horizon: Verify whether negative metrics reflect operating cash flow, GAAP net loss, or OCF minus Capex. Compare quarterly deficits against 9-month and 12-month trailing totals to isolate cyclical Capex lumpiness.
- Step 2: Dissect Financing Cash Flows by Specific Instrument: Review Section III (Cash Flows from Financing Activities). Track whether external capital was raised via bank facilities, bonds, common equity, or preferred stock. Confirm whether buybacks were curtailed.
- Step 3: Document Footnote Discrepancies as Unresolved: When debt disclosures in releases disagree with cash flow statement proceeds, record the variance as an unresolved footnote delta rather than forcing an artificial reconciliation.
Frequently Asked Questions
Does negative free cash flow mean Alphabet is running out of money?
No. Alphabet held $265.10 billion in cash and marketable securities at the end of Q3 2026, with an undrawn $25.0 billion commercial paper facility. The deficit indicates that quarterly capital spending exceeded quarterly operating cash generation.
Did Alphabet borrow $85.2 billion solely to fund AI data centers?
SEC filings disclose that debt was issued for “general corporate purposes,” while June equity/preferred proceeds were for “general corporate purposes, including capital expenditures.” Corporate cash is fungible; capital expenditures cannot be paired one-to-one with specific debt issuances.
Why did share buybacks drop to zero?
Alphabet repurchased zero shares in the first nine months of 2026, down from $39.81 billion in the prior-year period. While management did not disclose an explicit motive, the zero allocation redirected capital toward $132 billion in infrastructure investments.
Is Q2 2026 the first time Alphabet recorded negative free cash flow?
This analysis verifies seven consecutive quarters (Q1 2025 through Q3 2026), where Q2 and Q3 2026 were the only negative periods. Historical quarters prior to 2025 were not verified against primary filings, so characterizing it as the “first time in corporate history” is unconfirmed.
Primary Sources and References
- Alphabet Inc. Form 10-Q for the Quarterly Period Ended September 30, 2026:
https://www.sec.gov/edgar/browse/?CIK=0001652044 - Alphabet Inc. Q3 2026 Earnings Release (October 29, 2026):
https://abc.xyz/investor/earnings/ - Alphabet Inc. Q2 2026 Earnings Release (July 2026):
https://abc.xyz/investor/earnings/ - Alphabet Inc. Q1 2026 Earnings Release (April 2026):
https://abc.xyz/investor/earnings/ - Alphabet Inc. Q4 2025 Earnings Release (February 2026):
https://abc.xyz/investor/earnings/ - Alphabet Inc. Form 10-Q for the Quarterly Period Ended September 30, 2025:
https://www.sec.gov/edgar/browse/?CIK=0001652044