Did Amazon North America Operating Profit Really Surge 82%? Unpacking the $2.5B FTC Settlement and Prime Day Timing Shift
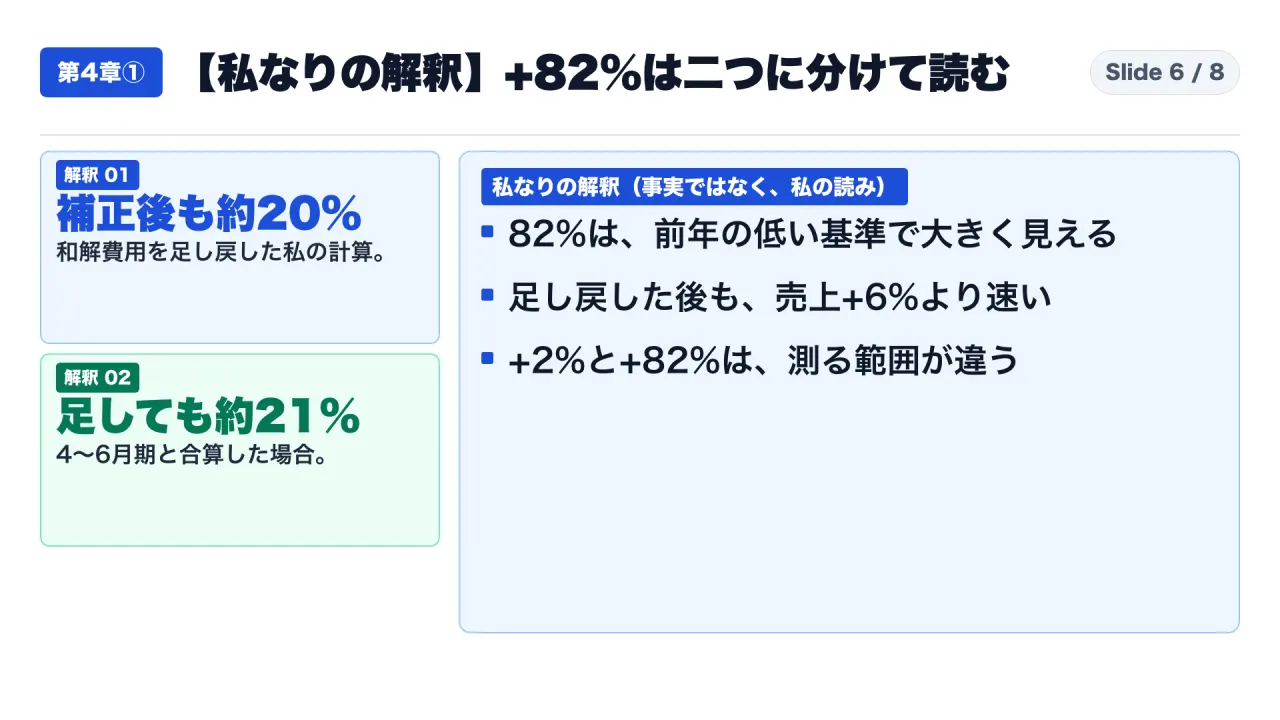
While headline North America operating income surged 82% to $8.72B in Q3 2026, roughly two-thirds of the $3.93B gain stems from a low prior-year base depressed by a $2.5B FTC litigation settlement, leaving normalized operating profit growth at approximately 20%.
Published: October 31, 2026 | Read time: ~10 min | Watch Video (Japanese)
Executive Summary: Separating Base Effects from Operational Expansion
Financial headlines covering Amazon’s Q3 2026 earnings release (three months ended September 30, 2026) highlighted a dramatic figure: North America operating income jumped 82% year-over-year, climbing from $4.79 billion to $8.72 billion. Over the same period, North America net sales grew by just 6% (from $106.27 billion to $112.85 billion). When operating profit expands fourteen times faster than sales, analysts must examine whether this reflects structural operational leverage or accounting base effects.
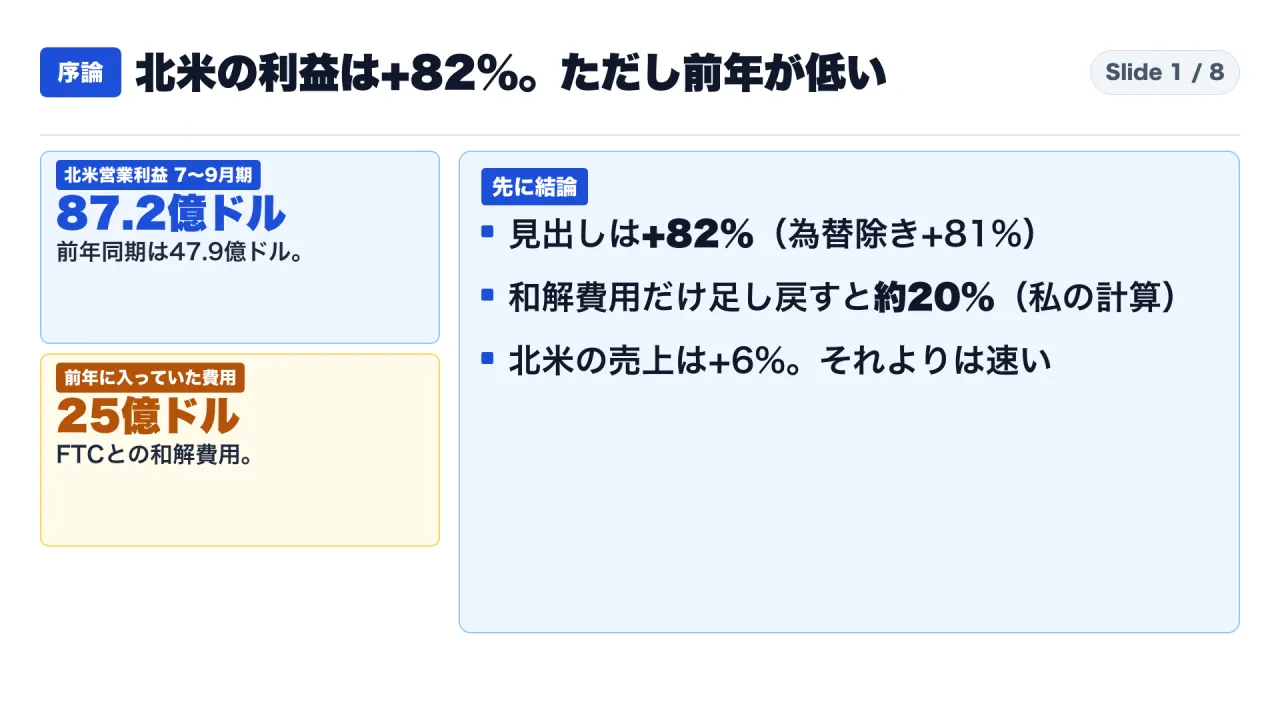
A rigorous examination of Amazon’s Form 10-Q filings with the SEC reveals that the prior-year period (Q3 2025) was burdened by significant non-recurring charges. Specifically, Amazon recorded a $2.50 billion settlement charge related to FTC litigation within “Other operating expense, net,” directly suppressing North America operating profit. In addition, the prior-year quarter included approximately $1.80 billion in company-wide severance charges.
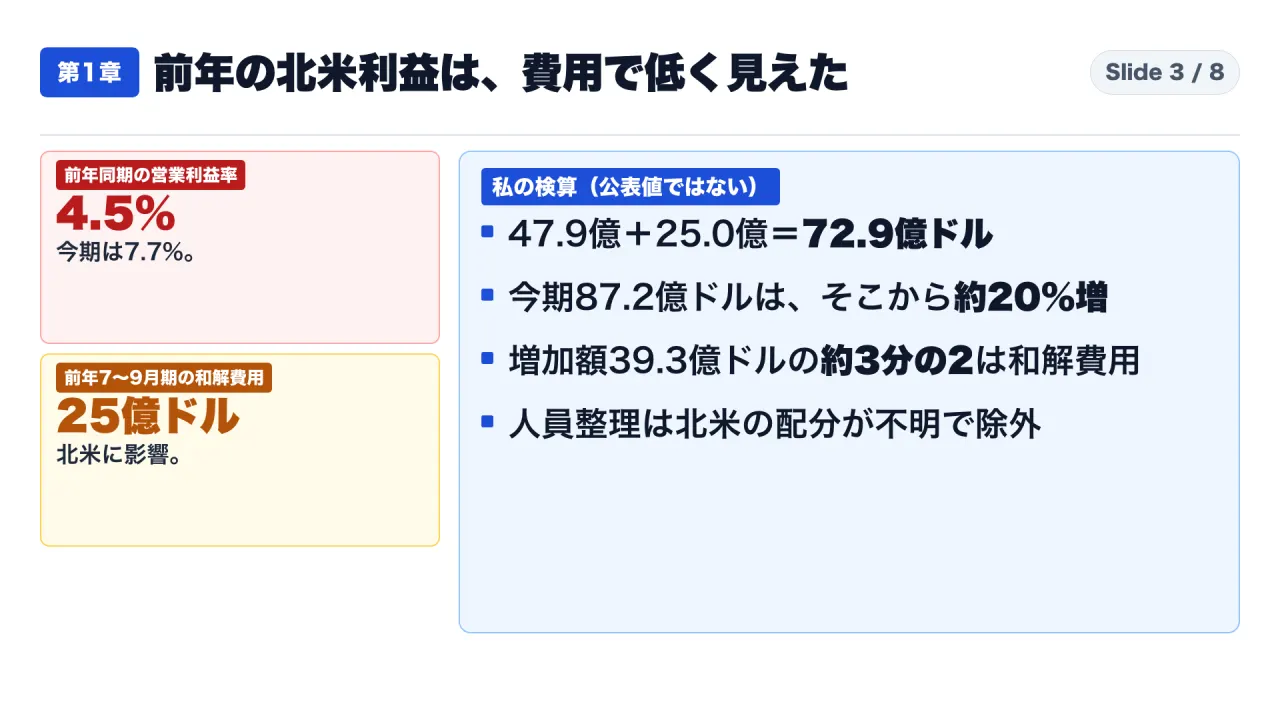
When the $2.50 billion settlement charge is added back to the Q3 2025 baseline, normalized year-over-year operating income growth for North America adjusts to approximately 20% (rising from an adjusted $7.29 billion to $8.72 billion). Of the total $3.93 billion reported increase, the $2.50 billion settlement absence accounts for 63.5% (nearly two-thirds) of the optical gain. While 20% normalized growth still comfortably outpaces 6% sales growth, it represents standard corporate operating leverage rather than an extraordinary 82% expansion.

This article evaluates these disclosures using a four-tier framework:
- Verified Facts: Direct figures and disclosures from Amazon’s Q3 2026 release and Form 10-Q filings for the periods ended September 30, 2025, and September 30, 2026.
- Company Explanations: Management commentary and qualitative assertions in SEC filings.
- Author Calculations: Mathematical reconciliations and normalized comparisons computed from disclosed numbers.
- Analytical Interpretations: Structural deductions regarding operating dynamics and disclosure boundaries.
1. Reported Results: The Gap Between Sales and Operating Profit
In Q3 2026, Amazon reported the following North America segment metrics:
- Net Sales: $112.85 billion in Q3 2026, compared to $106.27 billion in Q3 2025, up 6% on both reported and FX-neutral bases.
- Operating Income: $8.72 billion in Q3 2026, up 82% reported (81% FX-neutral) from $4.79 billion in Q3 2025.
- Segment Operating Margin: 7.7% in Q3 2026, compared to 4.5% in Q3 2025, an increase of 320 basis points.
The Scope of the 7.7% Segment Margin
Business media often describe the 7.7% segment operating margin as Amazon’s “retail margin.” Under Note 10 (Segment Information) of Amazon’s Form 10-Q, the North America segment does not isolate e-commerce retail. Instead, it aggregates four distinct revenue activities:
- First-party retail sales: Merchandise sold directly through online stores.
- Third-party seller services: Marketplace commissions, fulfillment fees (FBA), and shipping fees.
- Advertising services: Sponsored Products, display, and video ads sold across North American properties.
- Subscription services: Amazon Prime annual and monthly fees, plus digital media subscriptions.
North America also includes export sales originating from North American stores, whereas the International segment excludes them. Because high-margin advertising and Prime subscriptions are commingled with retail and fulfillment, describing 7.7% as a “retail margin” misrepresents Amazon’s reporting architecture. Amazon reports operating profit only across North America, International, and AWS; individual product-line profits are not disclosed.
2. Deconstructing the Prior-Year Base: One-Off Charges in Q3 2025
The primary driver behind the 82% headline increase is the denominator. In the three months ended September 30, 2025, Amazon recorded substantial one-off expenses that suppressed operating income.
Reported Q3 2025 North America Operating Income:   $4,789 million
(+) Add-back: FTC Litigation Settlement Charge:     $2,500 million
-----------------------------------------------------------------
Normalized Q3 2025 Baseline Operating Income:       $7,289 million

Reported Q3 2026 North America Operating Income:   $8,723 million
Reported Year-over-Year Growth:                     +82.1%
Normalized Year-over-Year Growth ($8,723 / $7,289): +19.7% (~20%)
In the Form 10-Q for the quarter ended September 30, 2025, Note 1 (Accounting Policies) and MD&A state that Amazon recorded a $2.50 billion expense regarding an FTC litigation settlement in “Other operating expense, net,” impacting North America segment results. Furthermore, Amazon recorded approximately $1.80 billion in company-wide severance charges across Technology and infrastructure, Sales and marketing, and General and administrative lines.
Consolidated “Other operating expense, net” totaled $2.90 billion in Q3 2025, compared to just $134 million in Q3 2026. As explained in the 2026 Form 10-Q, the prior-year balance reflected the legal settlement, while the Q3 2026 balance comprised routine intangible asset amortization and minor impairments.
Mathematical Reconciliation Table
The following table isolates the mathematical impact of the FTC legal settlement:
| Metric | Source / Basis | Calculation | Output | Analytical Takeaway |
|---|---|---|---|---|
| Q3 2025 NA Operating Income | Disclosed GAAP | Base figure | $4,789M ($4.79B) | Heavily depressed by legal charge |
| Add-Back: FTC Legal Settlement | Disclosed Footnote | One-off charge | +$2,500M ($2.50B) | Recorded in Other operating expense |
| Normalized Q3 2025 Baseline | Author Calculation | $4,789M + $2,500M | $7,289M ($7.29B) | Comparable operational base |
| Q3 2026 NA Operating Income | Disclosed GAAP | Current figure | $8,723M ($8.72B) | Clean operational quarter |
| Reported Profit Dollar Change | Author Calculation | $8,723M - $4,789M | +$3,934M ($3.93B) | Reported headline profit growth |
| Settlement Share of Dollar Gain | Author Calculation | $2,500M / $3,934M | 63.5% (~two-thirds) | Base effect explains bulk of gain |
| Normalized Profit Growth Rate | Author Calculation | ($8,723M / $7,289M) - 1 | +19.7% (~20%) | True underlying operational gain |
| Reported Margin: Q3 2025 | Disclosed Ratio | $4,789M / $106,267M | 4.51% (~4.5%) | Depressed margin baseline |
| Normalized Margin: Q3 2025 | Author Calculation | $7,289M / $106,267M | 6.86% (~6.9%) | Normalized operational margin |
| Reported Margin: Q3 2026 | Disclosed Ratio | $8,723M / $112,852M | 7.73% (~7.7%) | Current segment margin |
| Margin Expansion Breakdown | Author Calculation | 7.73% - 4.51% = +3.22 pts | 2.35 pts Base + 0.87 pts Real | ~73% of margin jump is settlement removal |
Segment operating margin expanded by 3.22 percentage points (from 4.51% to 7.73%). Of this total, 2.35 percentage points (from 4.51% to 6.86%) stemmed from the non-recurrence of the FTC settlement. True operational margin improvement was approximately 0.87 percentage points (87 basis points).
3. The Prime Day Timing Shift: Multi-Quarter Aggregation
The second structural factor affecting third-quarter results was the shifting calendar placement of Prime Day.
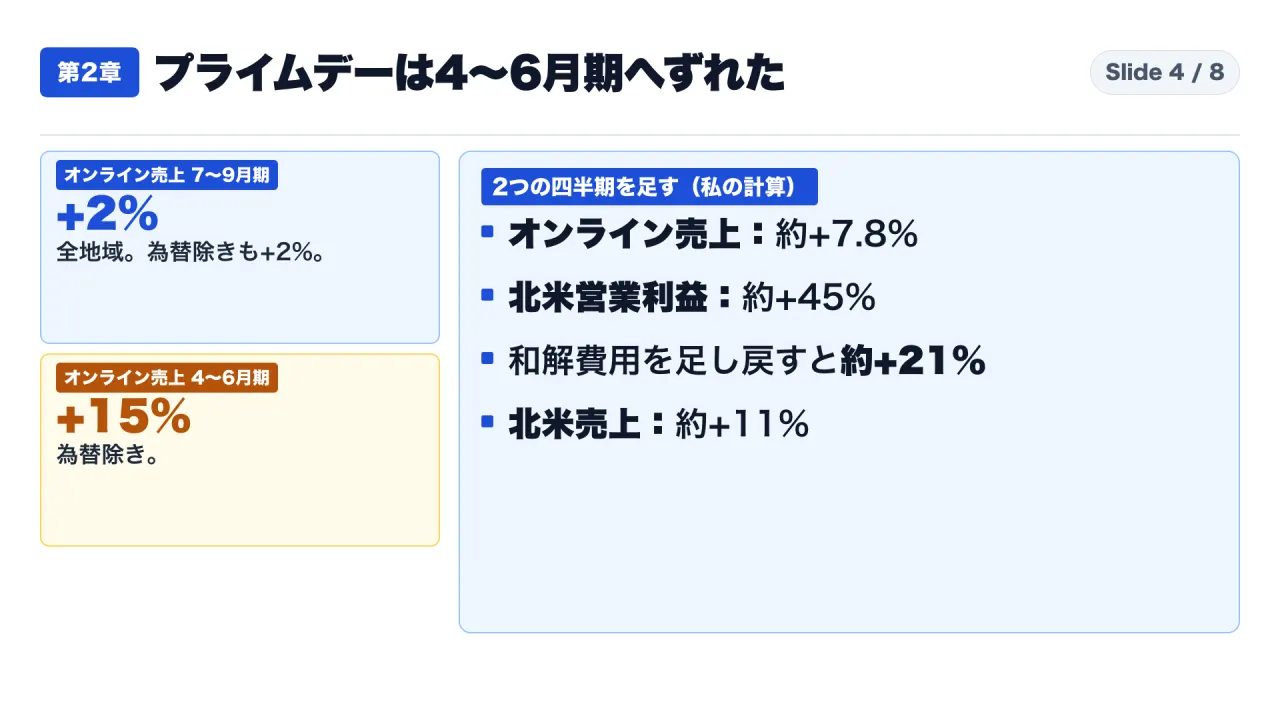
In management commentary, Amazon disclosed that Prime Day occurred in Q2 (three months ended June 30) across most major countries in 2026, whereas in 2025 it occurred entirely in Q3. Amazon stated that without this calendar shift, Q3 2026 consolidated worldwide net sales growth would have been approximately 400 basis points higher than the reported 12%.
This timing shift created opposing quarterly trends in Worldwide Online Stores net sales:
- Q2 2026: $70.43 billion, growing 15% FX-neutral, boosted by Prime Day.
- Q3 2026: $68.47 billion, growing 2% reported and FX-neutral, depressed by Prime Day’s absence.
Standalone North American online store revenue is not disclosed in SEC filings. To neutralize quarterly promotional volatility, analysts should aggregate Q2 and Q3 across both years:
| Metric (in Millions of USD) | Combined Q2+Q3 2025 | Combined Q2+Q3 2026 | Dollar Change | Combined Growth Rate |
|---|---|---|---|---|
| Worldwide Online Stores Sales | $61,485 + $67,407 = $128,892M | $70,432 + $68,470 = $138,902M | +$10,010M | +7.77% (~7.8%) |
| North America Segment Sales | $100,068 + $106,267 = $206,335M | $116,177 + $112,852 = $229,029M | +$22,694M | +11.00% (~11.0%) |
| Reported NA Operating Income | $7,517 + $4,789 = $12,306M | $9,123 + $8,723 = $17,846M | +$5,540M | +45.02% (~45.0%) |
| Normalized NA Income (+FTC) | $12,306M + $2,500M = $14,806M | $17,846M | +$3,040M | +20.53% (~20.5%) |
Smoothing across both quarters shows North America net sales grew 11.0%. Normalized operating income (adding back the $2.50 billion settlement) grew 20.5%, aligning closely with the standalone Q3 normalized rate of 19.7%. This confirms that while the calendar shift created revenue volatility (16% in Q2 vs. 6% in Q3), Amazon’s underlying operating profit growth remained steady at approximately 20% to 21%.
4. Disclosed Operating Drivers: Advertising, Subscriptions, and Volumes
In the MD&A section of the Form 10-Q, Amazon highlighted unit sales volume growth and advertising expansion as the primary positive drivers of North America operating profit, partially offset by increased shipping, fulfillment, and technology investments.
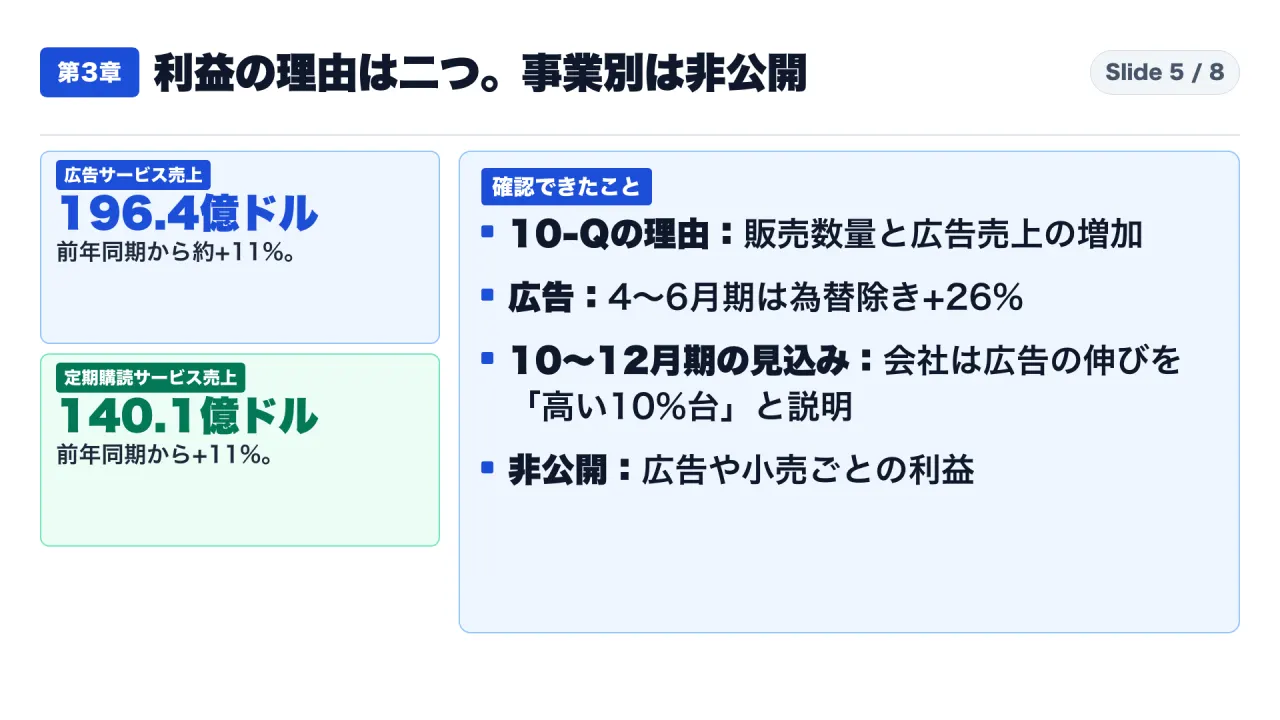
Consolidated Advertising services net sales reached $19.64 billion in Q3 2026, up 11% reported (12% FX-neutral) from $17.70 billion in Q3 2025. In Q2 2026, advertising grew 26% FX-neutral to $19.81 billion. Combining Q2 and Q3 yields an 18.1% six-month advertising expansion (rising from $33.40 billion to $39.45 billion). Management guided Q4 advertising growth to the “high teens.” However, Amazon does not disclose advertising operating profit or margins.
In August 2026, the FTC and 22 state Attorneys General filed an amended complaint in federal court alleging unfair practices regarding advertising auction reserve prices; Texas filed a separate state suit. Amazon has denied the allegations. Because liability is unestablished, no charge was recorded in Q3 2026.
Consolidated Subscription services net sales totaled $14.01 billion in Q3 2026, up 11% reported (12% FX-neutral) from $12.63 billion in Q3 2025, reflecting steady Prime memberships.
Management also noted that grocery and everyday essentials unit volumes grew approximately three times faster than other categories, representing about half of all items ordered in Q3 2026. However, dollar revenues and profitability for grocery are not broken out.
Consolidated operating income reached $28.08 billion in Q3 2026 (a 13.9% margin), up from $17.41 billion in Q3 2025:
- AWS: $17.80 billion in operating profit (63.4% of consolidated operating income).
- North America: $8.72 billion in operating profit (31.1% of consolidated operating income).
- International: $1.56 billion in operating profit (5.5% of consolidated operating income).
AWS continues to generate nearly two-thirds of enterprise operating income, demonstrating that North America’s expansion supports rather than drives the corporate profit engine.
5. Methodological Boundaries: What SEC Filings Do Not Disclose
Analysts must respect the limits of public regulatory filings:
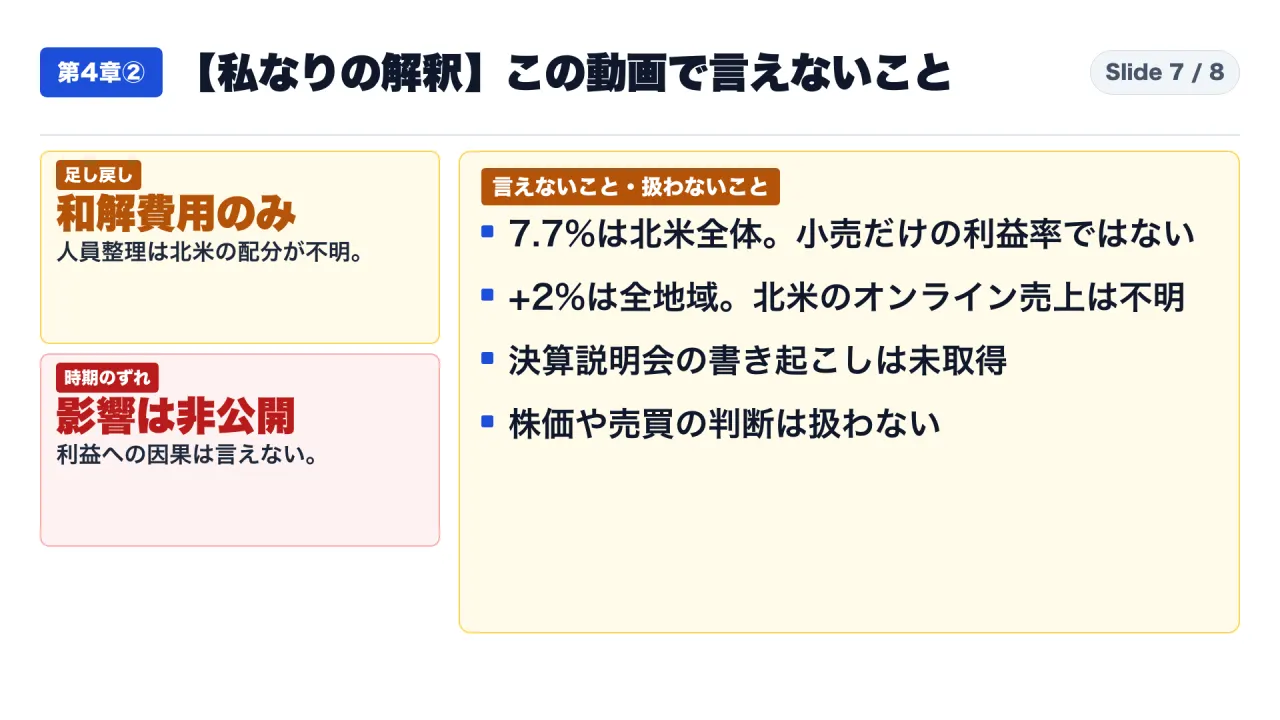
- Severance Allocation: Our reconciliation only adds back the $2.50 billion FTC charge. The $1.80 billion company-wide severance charge in Q3 2025 cannot be allocated to North America without unverified assumptions. Re-adding severance would lower normalized growth further below 19.7%.
- Prime Day Net Earnings: Amazon disclosed the ~400 basis point revenue drag from Prime Day’s absence, but the net profit impact is undisclosed.
- Product-Line Profitability: SEC filings do not disclose retail gross margin or advertising operating margins.
- Regional Online Store Breakdown: Online store sales (up 2%) are reported only globally; North American online sales are omitted.
- Earnings Call Commentary: Oral remarks from executive earnings calls are excluded from this review.
6. Practical Corporate Governance: An Audit Playbook for Headline Growth
For corporate planning and financial controllers auditing vendor or peer performance, this case study establishes a 3-step due diligence process:

- Step 1: Footnote Scrub for Extraordinary Items: Review Note 1 (Accounting Policies), segment footnotes, and “Other operating income/expense” lines for settlements, restructuring, or impairments. Add back non-recurring charges to calculate normalized baseline income, and report normalized growth alongside headline metrics.
- Step 2: Smoothing Calendar Shifts: When promotional events or billing cutoffs move across quarters, aggregate adjacent quarters (Q2 plus Q3) to evaluate multi-period performance. If multi-quarter normalized growth aligns with single-quarter normalized growth (as in Amazon’s ~20% rate), operational stability is verified.
- Step 3: Segment Scope Verification: Verify segment definitions before characterizing profit trends. Note all commingled activities (retail, advertising, subscriptions, logistics). When high-margin services are aggregated with low-margin distribution, do not equate segment margins with product-level profitability.
Frequently Asked Questions
Is the reported 82% operating income growth figure false?
No. The 82% growth rate accurately reflects reported GAAP operating income climbing from $4.79 billion to $8.72 billion. However, it is an economically distorted comparison because the prior-year denominator was depressed by a $2.50 billion legal settlement.
Is normalized 20% growth an accurate reflection of Amazon’s performance?
The ~20% figure represents an author-calculated baseline neutralizing the $2.50 billion settlement. Because unallocated severance charges from Q3 2025 remain in the prior-year base, true underlying growth may be slightly lower, but 20% provides a realistic benchmark.
Did moving Prime Day to Q2 cause Q3 operating profit to surge?
This causal relationship cannot be verified from SEC filings. Amazon disclosed that the timing shift lowered Q3 consolidated revenue growth by ~400 basis points, but the net profit impact of promotional pricing versus costs is not disclosed.
Is 7.7% the operating profit margin of Amazon’s e-commerce retail store?
No. The 7.7% margin applies to the entire North America reporting segment, combining retail with advertising services, third-party seller fees, and Prime subscription dues.
Primary Sources and References
- Amazon.com, Inc. Q3 2026 Financial Results Release (October 29, 2026):
https://ir.aboutamazon.com/news-release/news-release-details/2026/Amazon-com-Announces-Third-Quarter-Results/ - Amazon.com, Inc. Form 10-Q for the Quarterly Period Ended September 30, 2026:
https://www.sec.gov/Archives/edgar/data/1018724/000101872426000040/amzn-20260930.htm - Amazon.com, Inc. Form 10-Q for the Quarterly Period Ended September 30, 2025:
https://www.sec.gov/Archives/edgar/data/1018724/000101872425000123/amzn-20250930.htm