What Anthropic's S-1 Disclosure of "Compute Cost at 55% of Revenue" Actually Means—and What It Omits
A forensic deconstruction of Anthropic’s preliminary S-1 filing demonstrates why a 55% compute-to-revenue ratio reflects aggregate infrastructure capacity catching up to top-line growth rather than a customer-facing cost of goods sold.
Published: October 31, 2026 | Read time: ~10 min | Watch Video (Japanese)
Executive Summary: Deconstructing the “55% Compute Ratio”
In technology finance, few operating metrics have generated as much debate as the headline figure disclosed in Anthropic PBC’s Form S-1 registration statement (filed with the SEC on October 26, 2026): compute and infrastructure costs represented 55% of revenue in the first half of 2026.
Commentators and technology executives frequently misinterpret this figure in two major ways:
- Conflating the 55% ratio with a traditional SaaS cost of goods sold (COGS) or gross margin, assuming that serving Claude costs 55 cents per dollar of revenue.
- Assuming that the decline from prior triple-digit ratios guarantees structural, compounding operating leverage across the foundation model sector.
An empirical forensic audit of Anthropic’s statutory disclosures reveals that the 55% metric represents the entire aggregate expenditure on compute resources—encompassing model research, training runs, internal usage, and commercial inference—divided by total revenue. It does not measure customer-serving unit economics. Furthermore, this historical ratio stands in stark contrast to $265.6 billion in future fixed and minimum infrastructure commitments that remain completely outside the calculation.
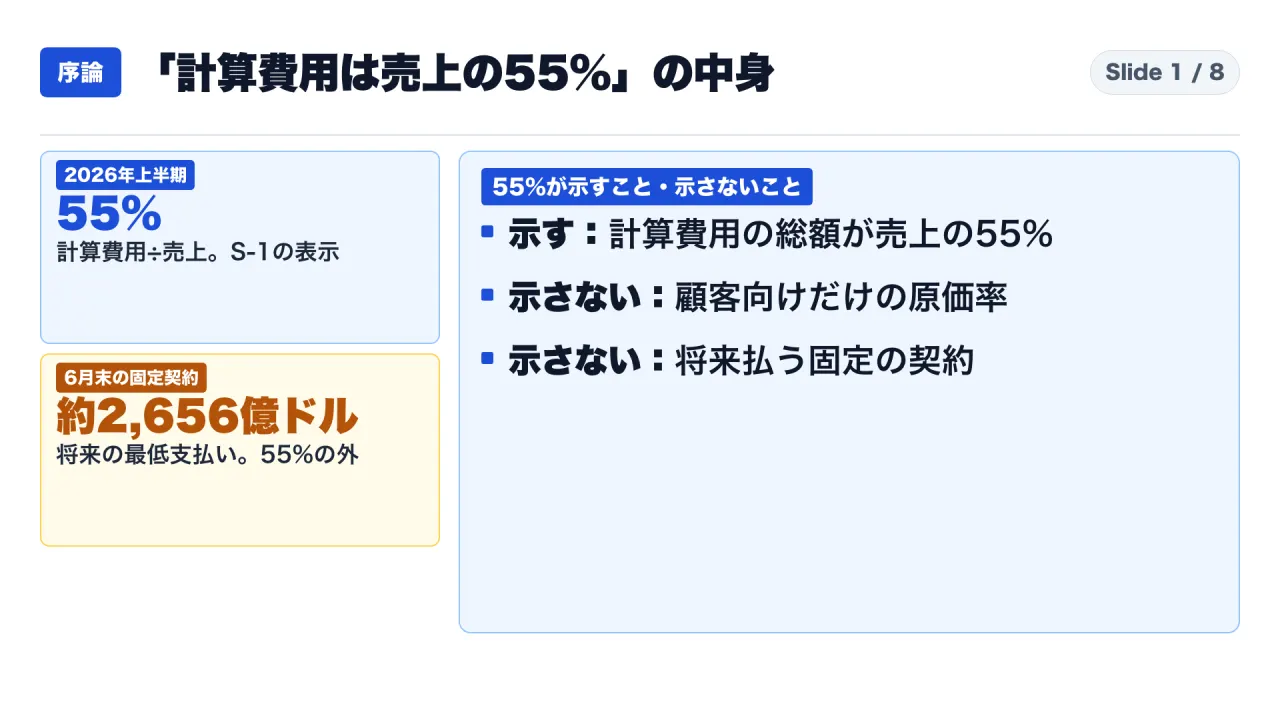
This analysis dissects the mathematical numerator and denominator behind the 55% figure, traces its multi-year trajectory, evaluates functional cost allocations, and examines the governance implications for enterprise financial planning.
Epistemological Framework: Four Information Categories
To maintain analytical rigor, this audit categorizes every statement using four explicit designations:
- [S-1 Disclosure]: Verifiable financial tables, accounting policies, and factual statements extracted directly from Anthropic’s Form S-1.
- [Author Calculation]: Mathematical derivations calculated directly from S-1 figures (formulas documented explicitly).
- [Management Explanation]: Forward-looking narratives, operational theories, and qualitative rationales provided by Anthropic management without independent audit verification.
- [Analytical Interpretation]: Structural deductions regarding corporate infrastructure planning, unit economics, and enterprise AI procurement.

Core Financial Terminology
| Statutory Accounting Term | Form S-1 Treatment | Critical Limitations and Omissions |
|---|---|---|
| Compute and Infrastructure | An operating expense category capturing all infrastructure costs across research, training, customer serving, and internal Claude use. | The filing explicitly notes that compute is planned and managed as an aggregate shared pool; activity-level cost splits are not tracked. |
| Cost of Revenue | Disclosed in Note 8 (Functional Expenses). Substantially all customer-serving compute, plus allocated personnel and overhead. | Gross profit is no longer presented as an independent line item on the statement of operations; 14.6% is not an official “gross margin.” |
| Adjusted Operating Income | Non-GAAP measure adjusting operating loss by adding back stock compensation, non-cash donations, and the Bartz legal settlement. | Not recognized under U.S. GAAP; omits significant recurring compensation and non-cash liabilities. |
| Fixed / Minimum Commitments | Disclosed in Note 13 (Commitments and Contingencies) as estimated future liabilities under executed contracts spanning 1 to 20 years. | Future contractual liabilities totaling ~$265.6 billion; completely excluded from the H1 2026 income statement ratio. |
| Customers >= $100k | Organizations generating over $100,000 in trailing 12-month revenue, aggregating multiple corporate accounts to single entities. | “Enterprise customer” is not an official statutory classification in the filing. |
1. Mathematical Anatomy of the 55% Ratio
Verifying Numerator and Denominator
Under the Summary Consolidated Financial Data within the S-1, Anthropic reports financial results for the six months ended June 30, 2026 (H1 2026):
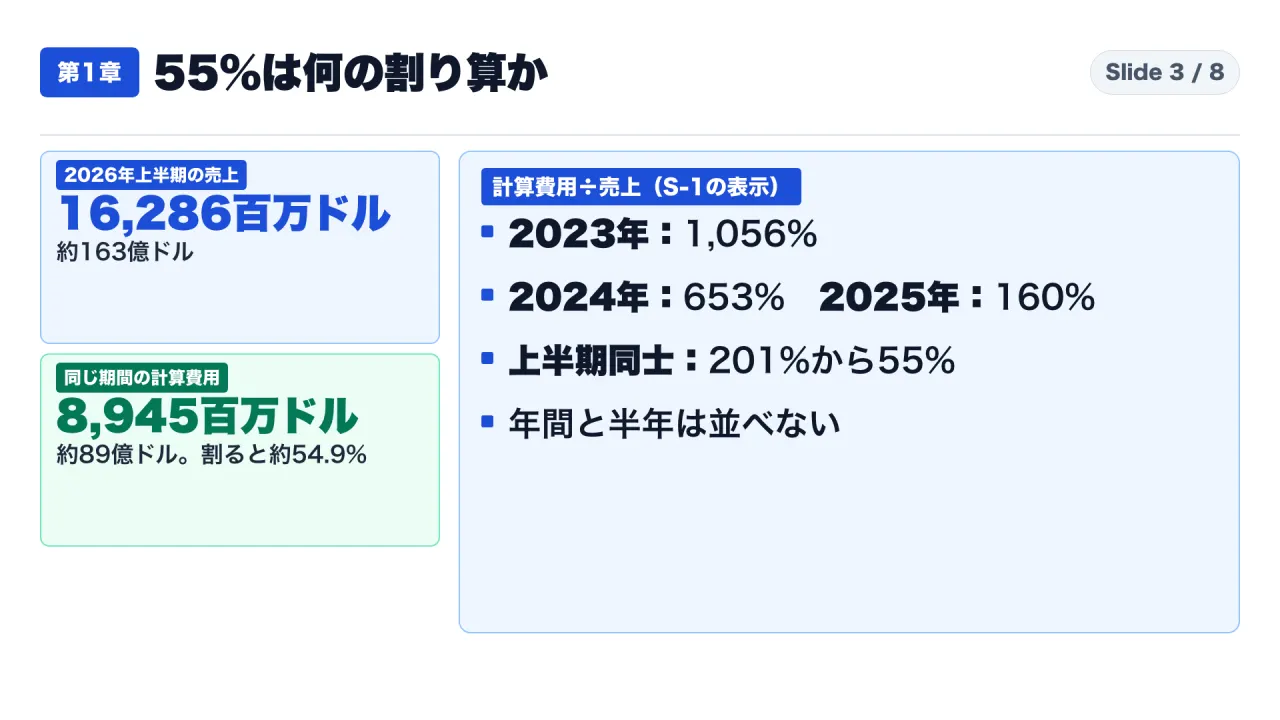
- Revenue: $16,286 million (~$16.3 billion).
- Compute and Infrastructure Expense: $8,945 million (~$8.9 billion).
Dividing $8,945 million by $16,286 million yields:
- [Author Calculation]: 8,945 / 16,286 = 0.54924 (54.92%).
- In the Management’s Discussion and Analysis (MD&A) tables, Anthropic presents this figure rounded to 55%.
[H1 2026 Compute: $8,945M] / [H1 2026 Revenue: $16,286M] = 54.92% (Reported as 55%)
  |
  +--> Research & Foundational Training
  +--> Internal Claude Enterprise Use
  +--> Commercial Customer Serving (Inference)
  +--> Capital Lease Depreciation & Server Hosting
By analogy, if a restaurant’s grocery invoice combines ingredients for standard customer dinner orders, experimental recipes for next year’s seasonal menu, and staff meals, dividing total purchases by customer receipts measures aggregate inventory intake rather than customer food cost percentage.
Multi-Year Trajectory Under Consistent Definitions
Compiling Anthropic’s statutory MD&A tables reveals how rapid revenue scaling altered this ratio over four years:
| Reporting Period | Revenue ($ Millions) | Compute Expense ($ Millions) | Compute / Revenue Ratio (Reported) | Analytical Context |
|---|---|---|---|---|
| 2023 (Full Year) | $41 | $433 | 1,056% | Compute was ~10.6x total revenue |
| 2024 (Full Year) | $386 | $2,522 | 653% | Early commercialization; heavy pre-training |
| 2025 (Full Year) | $4,585 | $7,326 | 160% | Full-year annual baseline |
| H1 2025 (Six Months) | $1,163 | $2,334 | 201% | Baseline for half-year comparison |
| H1 2026 (Six Months) | $16,286 | $8,945 | 55% | Revenue expanded ~14x while compute grew 283% |
Why Period Alignment Is Essential to Prevent Misreading
A frequent analytical mistake is comparing the full-year 2025 ratio (160%) to the half-year 2026 ratio (55%) and claiming that “compute costs dropped by two-thirds in six months.”
Methodologically, comparison requires aligned reporting periods:
- [Author Calculation]: Comparing H1 2025 (201%) to H1 2026 (55%) shows a 146-percentage-point contraction.
- [Author Calculation]: Absolute compute spending expanded by 283% ($2,334 million to $8,945 million), but revenue expanded by 1,300% ($1,163 million to $16,286 million, a ~14x increase). The ratio compressed because revenue expanded dramatically faster than fixed infrastructure costs, not because absolute compute expenditures declined.
Quarterly Dynamics Reveal Accelerating Margin Inflection
Tracking quarterly disclosures within the S-1 highlights the momentum:
- In Q1 2025, compute was $944 million against revenue of $376 million (251%).
- By Q2 2026, compute reached $5,558 million against revenue of $11,555 million, dropping the quarterly ratio to 48%.
- [Author Calculation]: In Q1 2026, compute was $3,387 million on revenue of $4,731 million (71.6%). The six-month 55% figure represents a blend between a 71.6% quarter and a 48.0% quarter.
- In operating results, Anthropic posted an operating loss of -$1,667 million in Q1 2026, followed by an operating profit of +$974 million in Q2 2026, resulting in an aggregate H1 2026 operating loss of -$693 million.
2. Shared Infrastructure Pool vs. Customer Serving Costs
Statutory Scope of Compute Expenses
Anthropic’s MD&A explicitly defines compute and infrastructure as a single unified operational asset:
- The resource pool supports research, next-generation foundational model development, customer-facing API inference, and internal Claude deployments.
- Crucially, Anthropic notes that it manages compute capacity in aggregate rather than on a discrete project-by-project basis, recognizing expenses as capacity becomes available under long-term take-or-pay commitments.
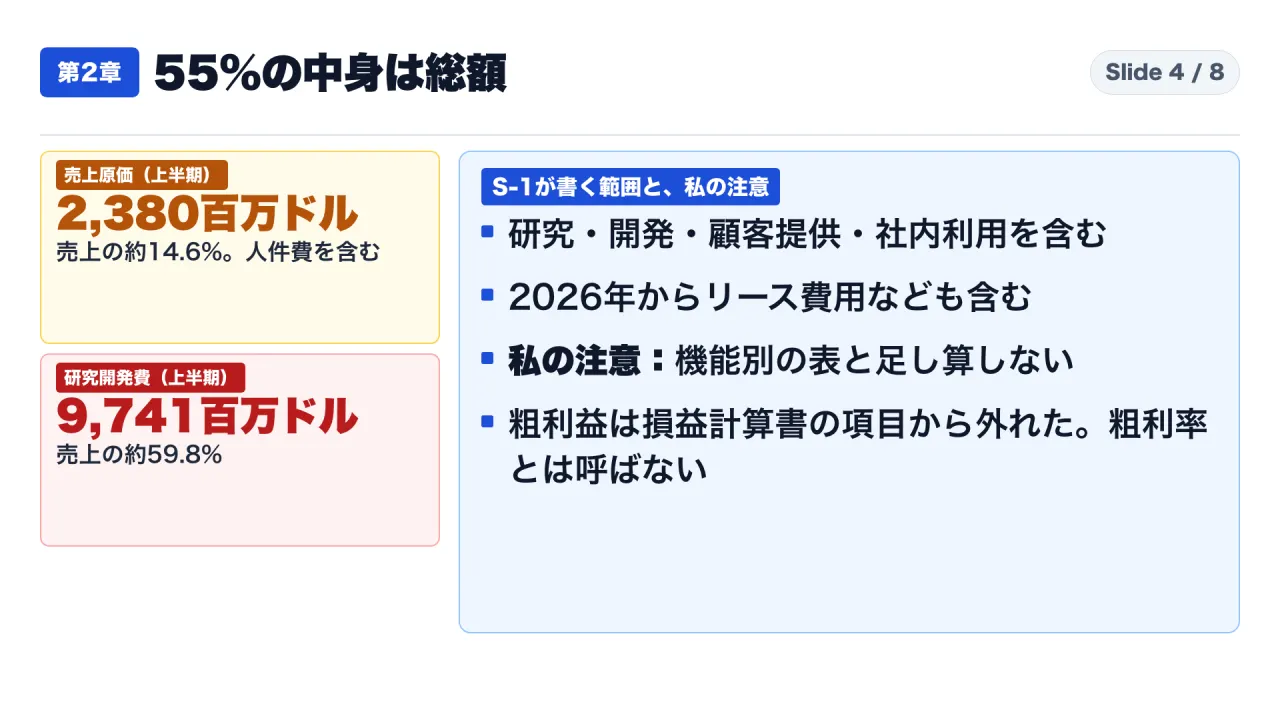
- From 2026 onward, the definition incorporates server lease obligations: operating leases, finance lease amortization, variable lease costs, and depreciation of owned server infrastructure.
The Functional Expense Allocation (Note 8)
To understand customer serving economics, analysts must consult Note 8: Supplemental Financial Information, which provides a functional expense breakdown:
| Functional Category (H1 2026) | Amount ($ Millions) | Author Calculated % of Revenue | Primary Cost Drivers |
|---|---|---|---|
| Cost of Revenue | $2,380 | ~14.6% | Substantially all customer-serving compute, plus third-party hosting, personnel, and allocated overhead. |
| Research & Development | $9,741 | ~59.8% | Frontier model training, research compute, internal Claude utilization, and research engineering personnel. |
Two Critical Governance Cautions
- Do Not Add Functional Percentages to Match 55%: Cost of revenue (14.6%) and R&D (59.8%) incorporate personnel compensation, facilities, and indirect overhead. They represent an entirely different accounting classification than the nature-based compute line item ($8,945 million).
- 14.6% Is Not a Statutory “Gross Margin”: In 2025, Anthropic modified its presentation from a functional income statement to a nature-of-expense presentation. Consequently, “Gross Profit” and “Gross Margin” do not appear as formal line items on the face of the audited statement of operations.
Operating Expense Structure Across H1 2026
Total operating expenses for H1 2026 reached $16,979 million, exceeding revenue by $693 million (operating loss of -$693 million):
| Expense Category | H1 2025 (% of Revenue) | H1 2026 (% of Revenue) | Operational Trend |
|---|---|---|---|
| Compute & Infrastructure | 201% | 55% | Compressed 146 percentage points due to revenue surge |
| Personnel Costs | 46% | 19% | Operating leverage across core engineering headcount |
| Sales, Marketing & Partnerships | 10% | 19% | Expanded 9 percentage points as enterprise distribution scaled |
| General & Administrative | 26% | 11% | Fixed administrative cost absorption |
While compute and personnel demonstrated operating leverage, sales and marketing expenses increased significantly, underscoring the commercial acquisition investments required to sustain top-line growth.
3. Explaining the Decline: Management Claims vs. Information Exclusions
Management’s Explanation of Operating Leverage
Anthropic attributes the decline in compute expense intensity to structural factors:
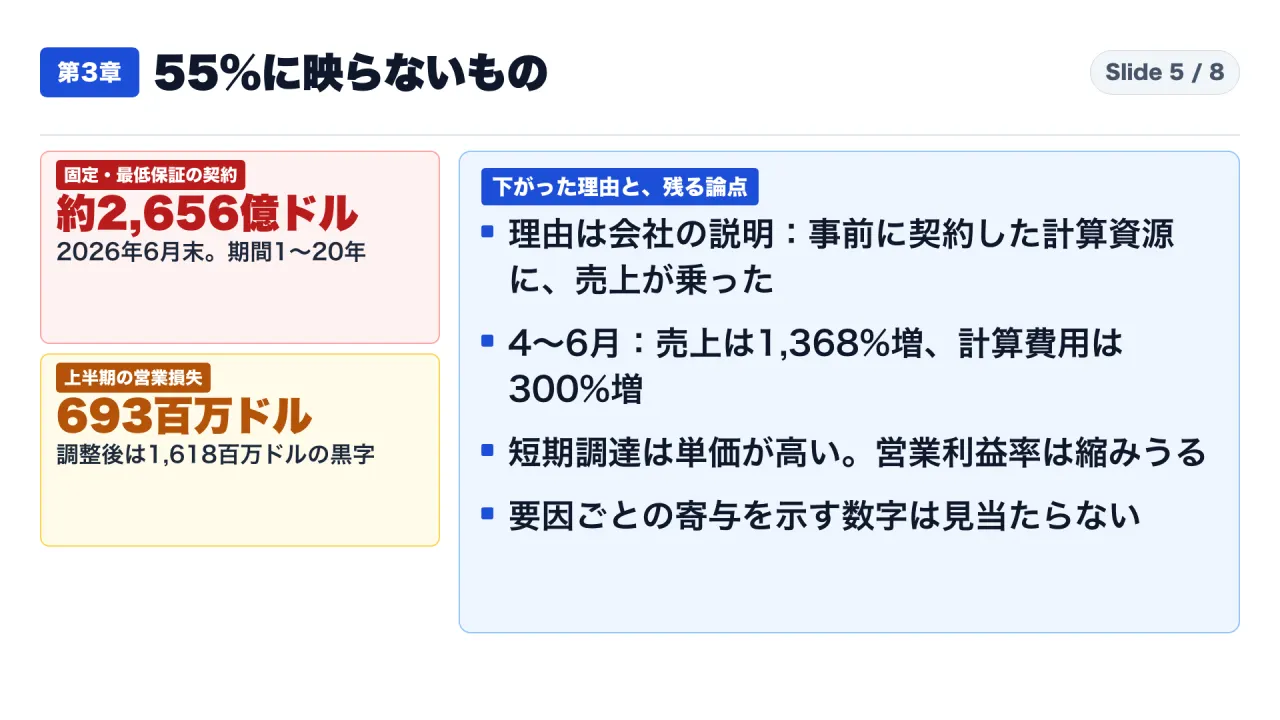
- Contractual Lag: Long-term compute commitments procured 12 to 18 months prior remained fixed in absolute dollar terms while revenue surged 1,368% year-over-year in Q2 2026.
- Three Optimization Pillars:
- Training and Algorithmic Optimization: Algorithmic efficiencies in foundational pre-training.
- Inference Architecture: Dynamic context caching, speculative decoding, and model distillation.
- Multi-Silicon Diversification: Distributing workloads across four parallel hardware families: AWS Trainium, Google TPU, NVIDIA GPU, and AMD GPU.
- Recursive Engineering: Claude autonomously assisting research teams in software engineering and compiler optimization.
Analytical Guardrail: The S-1 does not publish a quantitative sensitivity table breaking down how much each pillar contributed to the margin improvement. Asserting that “Trainium and TPUs drove the margin turnaround” represents an unverified management narrative rather than an audited financial fact.
Four Major Financial Realities Omitted from the 55% Ratio
- $265.6 Billion in Future Take-or-Pay Commitments: Note 13 discloses that as of June 30, 2026, future payments under fixed or minimum purchase commitments totaled ~$265.6 billion spanning 1 to 20 years. These irrevocable future liabilities do not appear in the H1 2026 income statement ratio.
- Forward-Looking Margin Volatility: The S-1 warns that demand exceeding contracted capacity requires spot compute at higher rates. Furthermore, when new mega-scale clusters activate, infrastructure expenses precede associated downstream revenues, compressing operating margins.
- GAAP Loss vs. Non-GAAP Adjusted Profit: While Anthropic highlighted an Adjusted Operating Profit of +$1,618 million in H1 2026, its audited GAAP Operating Loss was -$693 million, excluding share-based compensation, non-cash corporate donations, and legal settlements.
- Non-Operating Items and Cash Flow Reality: Net loss was -$80,748 million (~$80.7 billion) for H1 2026, driven by a -$72,388 million non-cash charge reflecting fair-value adjustments on convertible notes. Operating cash flow reached +$3,929 million in H1 2026 (improving from -$1,513 million in H1 2025).
Enterprise Customer Concentration Metrics
- Customers >= $100,000: Expanded from over 950 (September 30, 2025) to over 11,900 (September 30, 2026). Customers >= $1 million reached over 1,900, while customers >= $10 million totaled approximately 250.
- Fortune 500 Spend Intensity: Enterprise spend across public Fortune 500 customers represents an average of less than 0.1% of their total reported operating expenses, indicating that enterprise generative AI procurement remains in early testing phases.
- Top 5 Concentration: Top 5 customers accounted for approximately 25% of total revenue across the nine months ended September 30, 2026, though no single customer exceeded 10%.
4. Strategic Interpretation: Capacity Absorption vs. Structural Efficiency
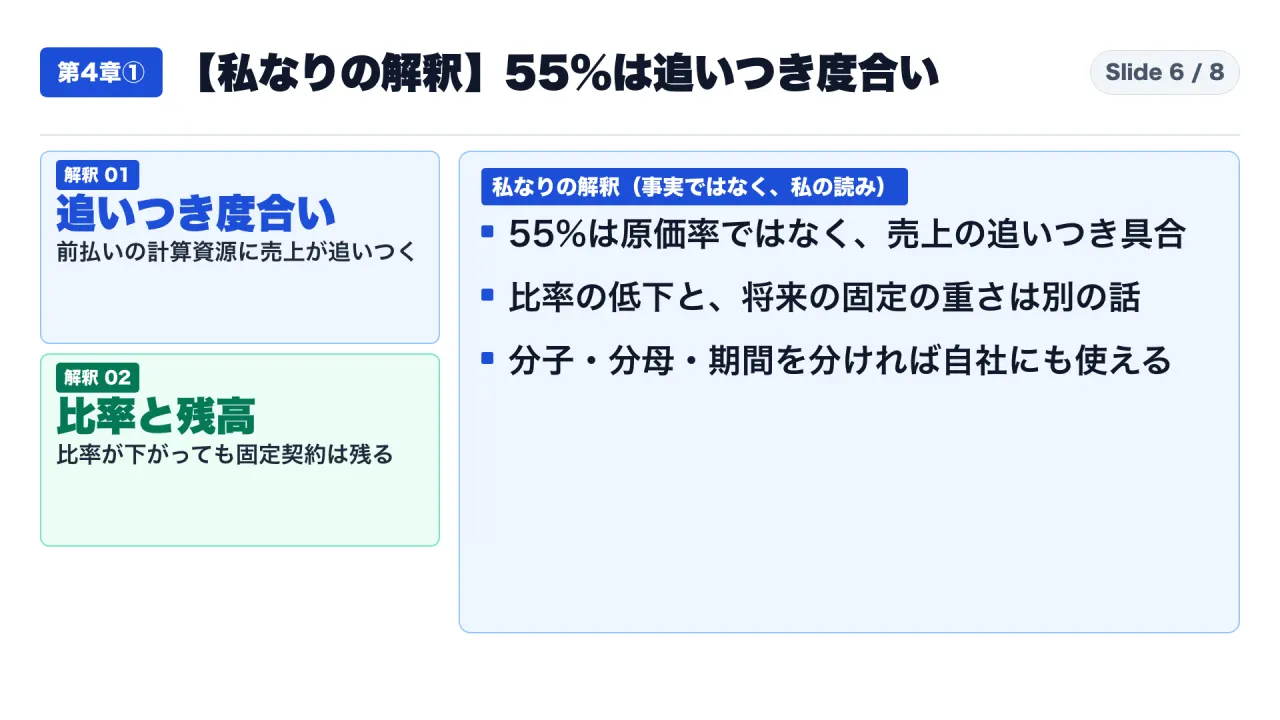
Synthesizing statutory evidence leads to three core strategic insights:
- The 55% Figure Reflects Capacity Absorption: The contraction from 1,056% to 55% documents a classic high-fixed-cost absorption curve. Anthropic locked in multi-year compute clusters 12 to 18 months in advance; when commercial enterprise demand accelerated in 2026, incremental revenue dropped straight to the bottom line against fixed server depreciation.
- Decline in Compute Intensity Does Not Diminish Balance-Sheet Risk: A 55% compute-to-revenue ratio coexists with $265.6 billion in long-term take-or-pay liabilities. If commercial demand decelerates while new capacity tranches activate, compute intensity will quickly rebound.
- Enterprise AI Budgeting Must Mirror This Decomposition: Corporate technology leaders cannot evaluate internal AI investments through a single percentage. Organizations must segregate experimental R&D compute from production inference costs.
5. Scope Boundaries and Non-Claims

This forensic review adheres to strict evidentiary boundaries:
- Not a Unit Cost Benchmark: 55% does not represent the cost of executing an individual Claude API call.
- No Attributed Causal Weights: The filing does not quantify the specific savings generated by multi-chip hardware vs algorithmic distillation.
- Preliminary Registration Status: Form S-1 represents a preliminary filing subject to amendment (Form S-1/A). Share prices, valuation, and capital raising totals remain unstated.
- No Investment Solicitation: This analysis does not evaluate equity value or provide financial recommendations.
6. Enterprise Implementation Playbook: Auditing Corporate AI Expenditures

Enterprise finance and technology executives managing internal AI budgets should implement a disciplined four-step audit framework:
Step 1: Segregate the Numerator into Three Dedicated Cost Pools
Never evaluate enterprise AI expenses under a single general ledger line item. Enforce mandatory resource tagging:
- Pool A (Production Serving): Direct API tokens and hosting infrastructure supporting live customer workflows.
- Pool B (R&D and Fine-Tuning): Model evaluation, internal prototyping, and fine-tuning experiments.
- Pool C (Internal Productivity): Corporate employee seat licenses and enterprise chat deployments.
Step 2: Align Numerators and Denominators Period-by-Period
Ensure revenue benchmarks match the scope of AI deployment:
- Evaluate business-unit AI infrastructure strictly against the specific business unit’s recognized revenue.
- Maintain consistent half-year and full-year comparative cadences to avoid distorting seasonality.
Step 3: Track Irrevocable Minimum Commitments Off-Balance-Sheet
Build a dedicated commitment tracking schedule:
- Isolate contractual cloud commitments, minimum annual spend guarantees, and cancellation penalties into a separate risk register.
- Never evaluate operational efficiency solely through trailing P&L expense ratios while ignoring future multi-year take-or-pay commitments.
Step 4: Cross-Functional Departmental Inquiries
| Department | Specific Technical Question | Governance Action |
|---|---|---|
| IT & Cloud Ops | Can our hyperscaler billing export separate production API calls from internal prototyping? | Establish resource tagging policies; report untagged infrastructure as shared overhead. |
| Corporate Finance | Does our reported “AI ROI ratio” include experimental model training or strictly customer serving? | Disclose the exact numerator composition in executive management reporting packs. |
| Procurement & Legal | What are our multi-year minimum annual volume commitments across LLM API contracts? | Maintain an off-balance-sheet commitment register with explicit step-down clauses. |
Primary Sources and References
- Anthropic PBC Form S-1 Registration Statement (Filed October 26, 2026): SEC EDGAR Preliminary Prospectus