How Much Physical AI Demand Is Actually Visible in Fanuc's Financial Results? Disentangling Earnings Surges from Corporate Roadmaps
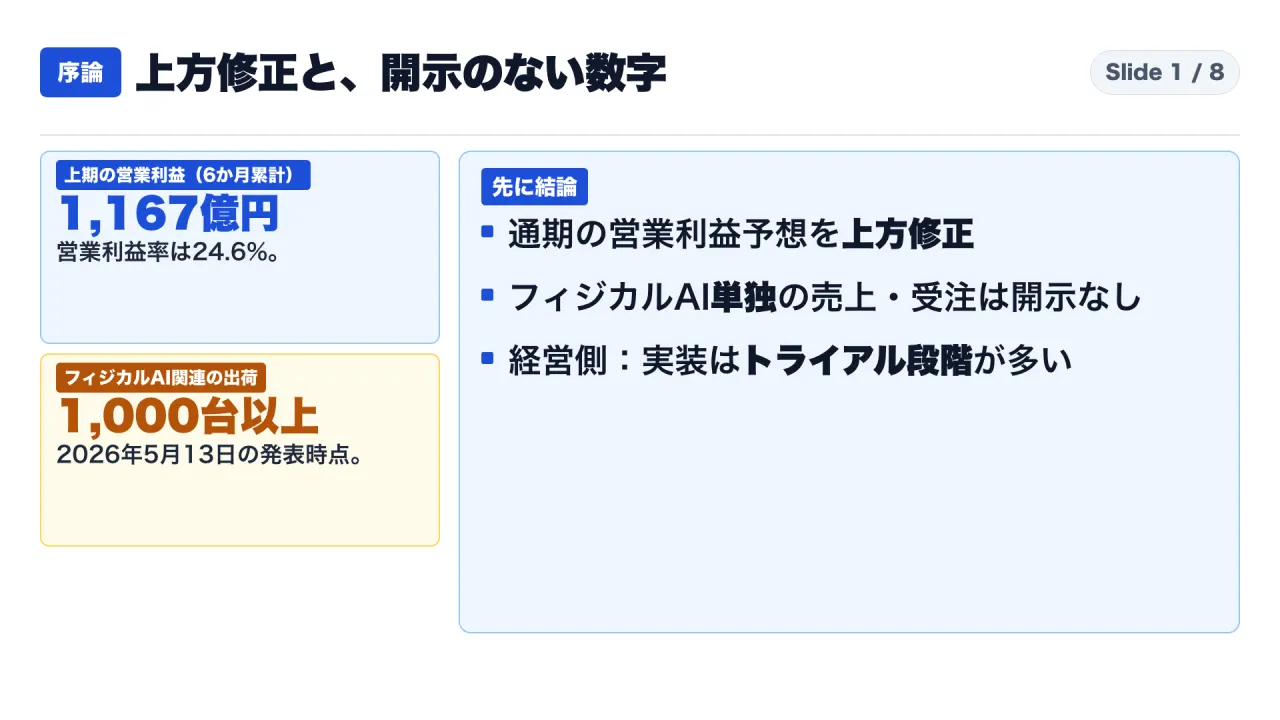
A forensic analysis of Fanuc’s FY2026 interim earnings reveals that while operating profit forecasts were revised upward by 10.4%, statutory filings disclose zero standalone Physical AI revenue, and management confirms implementations remain in trial stages.
Published: October 31, 2026 | Read time: ~10 min | Watch Video (Japanese)
Executive Summary: Interim Earnings Revisions vs. Physical AI Realities
Across industrial manufacturing, robotics, and capital budgeting, “Physical AI”──the fusion of artificial intelligence perception and reasoning with robotic manipulation──has emerged as a prominent theme. On October 23, 2026, Fanuc Corporation released interim results for the first half of fiscal year 2026 (April-September 2026), raising full-year operating profit guidance by 10.4% to 240.7 billion yen and forecasting record revenue exceeding 1 trillion yen.
Concurrently, trade commentary highlighted Fanuc’s announcement from May 2026 that it had shipped “over 1,000 robots for Physical AI applications,” alongside alliances with Google, NVIDIA, Fujitsu, and Hitachi. Aligning Fanuc’s first-half operating margin of 24.6% with surging Physical AI shipments led commentators to infer that Physical AI was already driving corporate profitability.
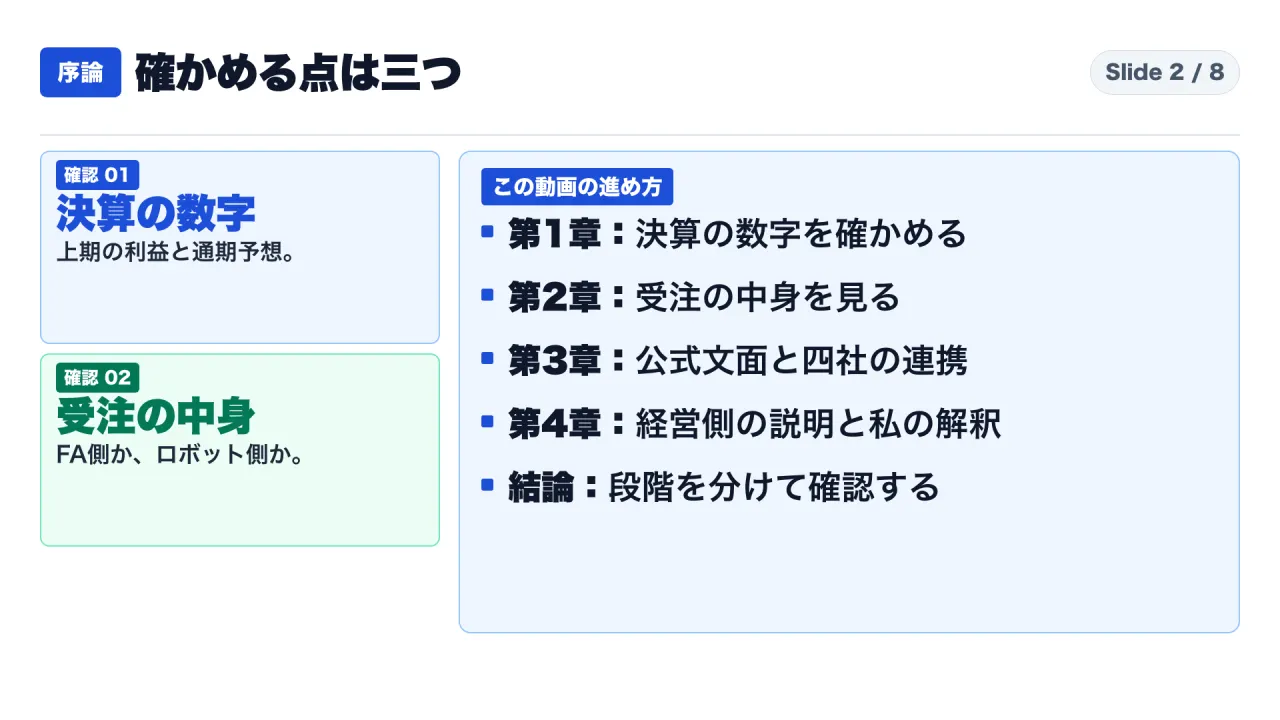
However, an empirical examination of regulatory earnings releases, investor call transcripts, and partnership agreements reveals three core facts:
- Physical AI is not disclosed as a standalone revenue or profit line. Statutory disclosures contain no standalone revenue, operating income, or order figures for Physical AI.
- Management confirms customer adoption remains in trial phases. During investor calls, executive leadership explained that while customer inquiries are substantial, factory implementations remain in exploratory testing, with broad demand expansion expected in future periods.
- The earnings surge was driven by Factory Automation (FA) machine tool CNCs, not robotics. Second-quarter FA orders surged 130.1% year-over-year to 112.2 billion yen, surpassing Robot division orders (103.4 billion yen). Management attributed FA demand to semiconductor equipment, AI datacenter infrastructure, and machine tools used for cutting humanoid robot components.
This analysis evaluates Fanuc’s disclosures, harmonizing observation windows across quarters, analyzing order surges between FA and Robotics, and mapping the maturity phases of corporate alliances.
Analytical Methodology and Evidentiary Designations
To preserve evidentiary boundaries, four labels are applied:
- [Fact]: Verifiable figures, dates, and statements extracted directly from Fanuc regulatory releases, financial statements, and technical documentation.
- [Company Explanation]: Strategic rationale, qualitative assessments, and forward-looking guidance stated by Fanuc management.
- [Calculated Value]: Independent mathematical derivations calculated directly from published primary figures.
- [Interpretation]: Structured analytical deductions derived from primary source evidence.
All financial figures reflect Japanese Yen (JPY) as presented in primary documents, based on foreign exchange assumptions of 150 JPY per USD and 175 JPY per EUR for the second half of fiscal 2026.
1. Interim Earnings and Upward Revisions: Reconciling Margins
Top-Line Results and Revised Guidance
On October 23, 2026, Fanuc disclosed consolidated financial results for the first half of fiscal year 2026 (April 1 to September 30, 2026):
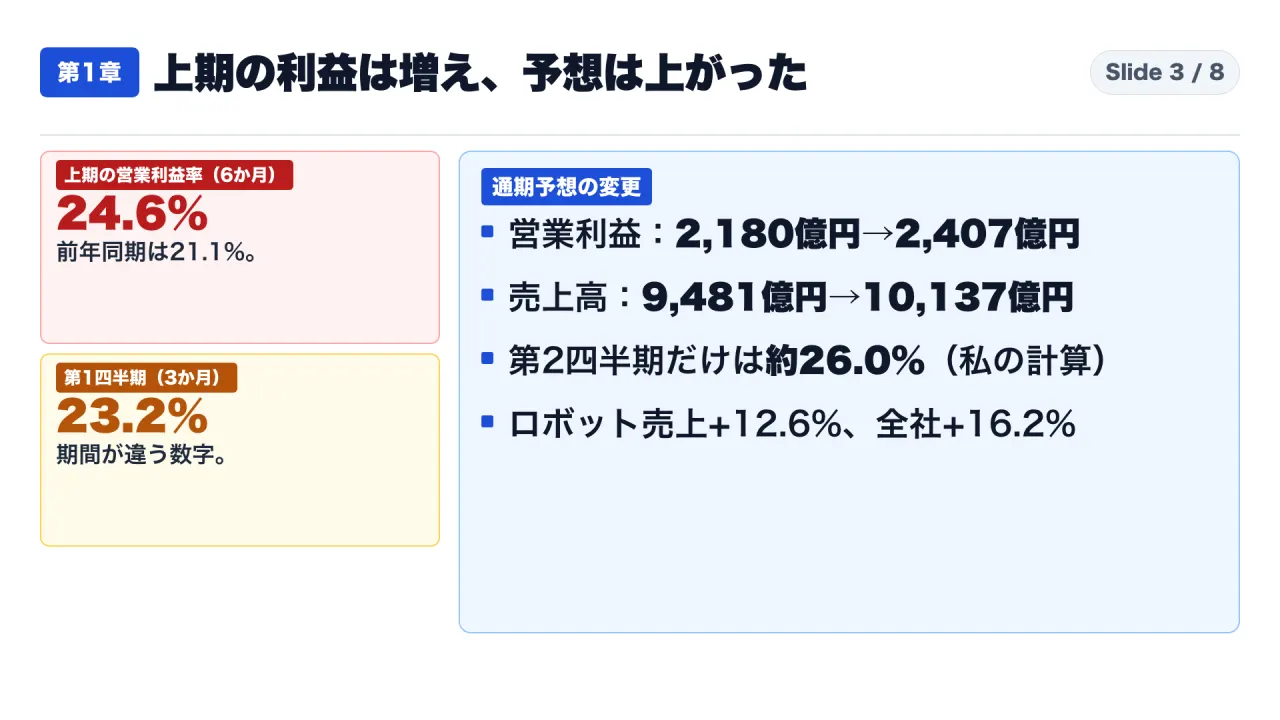
- [Fact]: Net sales reached 473.7 billion yen, expanding 16.2% year-over-year compared to 407.6 billion yen.
- [Fact]: Operating profit totaled 116.7 billion yen, increasing 35.7% year-over-year from 86.0 billion yen.
- [Fact]: Operating profit margin stood at 24.6%, up from 21.1% in H1 FY2025.
- [Fact]: Full-year operating profit guidance was revised upward by 10.4%, from 218.0 billion yen (issued July 31, 2026) to 240.7 billion yen (23.7% projected margin).
- [Fact]: Full-year net sales guidance was raised 6.9% to 1,013.7 billion yen, surpassing the record of 857.8 billion yen from fiscal 2025.
| Metric | H1 FY2025 Actual | H1 FY2026 Actual | Previous FY2026 Guidance | Revised FY2026 Guidance |
|---|---|---|---|---|
| Net Sales | 407.6 Billion Yen | 473.7 Billion Yen | 948.1 Billion Yen | 1,013.7 Billion Yen |
| Operating Profit | 86.0 Billion Yen | 116.7 Billion Yen | 218.0 Billion Yen | 240.7 Billion Yen |
| Operating Margin | 21.1% | 24.6% | 23.0% | 23.7% |
Harmonizing Observation Windows: 3-Month vs. 6-Month Metrics
Fanuc reported an operating margin of 23.2% in Q1 (April-June) and 24.6% for H1 (April-September). Contrasting 23.2% with 24.6% directly compares a three-month period against a six-month cumulative total.
- [Calculated Value]: Isolating the standalone second quarter (July-September 2026):
- Q2 Standalone Sales: 473.7B (H1) - 231.0B (Q1) = 242.7 billion yen.
- Q2 Standalone Operating Profit: 116.7B (H1) - 53.5B (Q1) = 63.2 billion yen.
- Q2 Standalone Operating Margin: 63.2B / 242.7B = approximately 26.0%.
- [Interpretation]: While operating profitability expanded from 23.2% in Q1 to approximately 26.0% in Q2, valid analysis requires comparing equal quarters rather than mixing quarterly and cumulative figures.
Divisional Sales Composition: Robotics Lags Corporate Growth
In the first half of fiscal 2026, division sales grew year-over-year: FA +15.4%, Robomachine +31.2%, Service +12.7%, and Robot +12.6% (194.3 billion yen).
- [Interpretation]: Robot division growth (+12.6%) lagged corporate growth (+16.2%). Management noted automotive and general industrial demand was steady in the Americas, with Chinese demand supported by general industry. Disclosures contain zero mention of Physical AI as a revenue driver.
2. Order Intake Analysis: The FA Surge (+130.1%) vs. Robot Bookings (+12.6%)
In the second quarter of fiscal 2026 (July-September), total orders reached 306.0 billion yen, up 49.0% year-over-year:
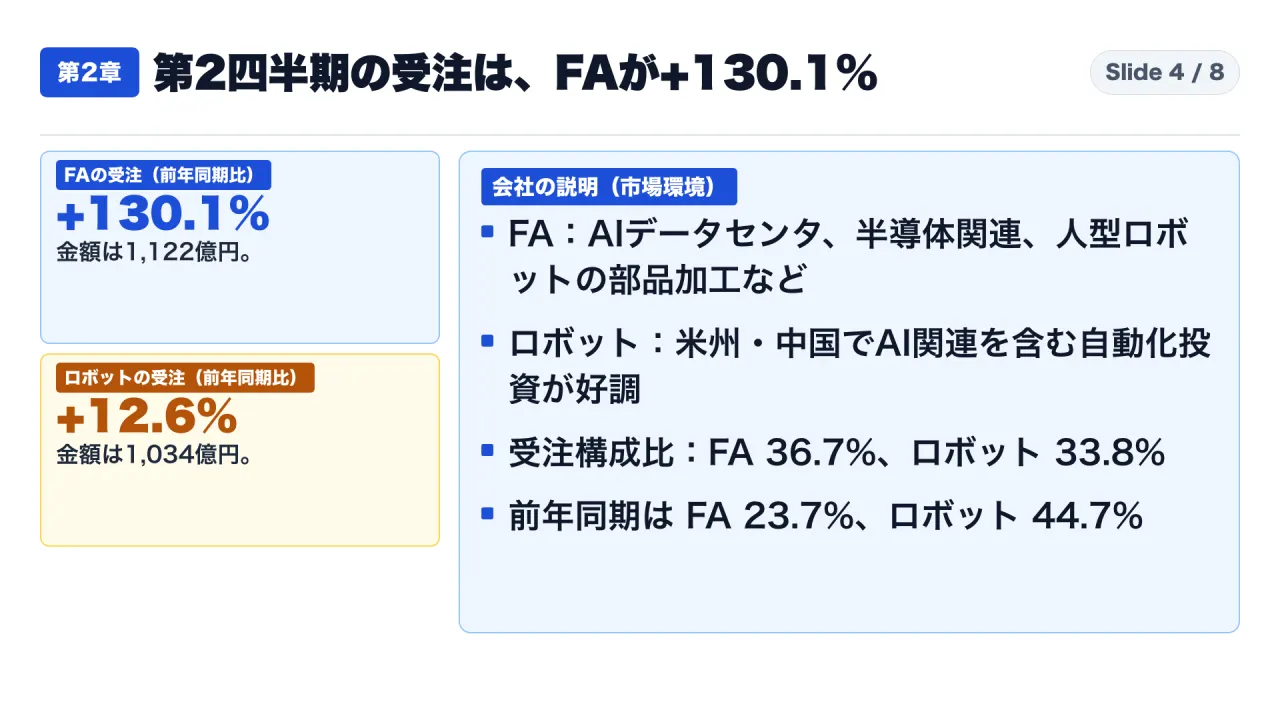
- [Fact]: FA Division orders surged 130.1% year-over-year to 112.2 billion yen.
- [Fact]: Robot Division orders grew 12.6% year-over-year to 103.4 billion yen.
- [Calculated Value]: FA orders exceeded Robot orders by 8.8 billion yen (112.2B - 103.4B).
- [Fact]: In order mix, FA expanded from 23.7% in Q2 FY2025 to 36.7%, while Robot contracted from 44.7% to 33.8%.
| Division | Q2 FY2025 Orders | Q2 FY2026 Orders | YoY Growth | Q2 FY2026 Order Share |
|---|---|---|---|---|
| Factory Automation (FA) | 48.7 Billion Yen | 112.2 Billion Yen | +130.1% | 36.7% |
| Robot | 91.8 Billion Yen | 103.4 Billion Yen | +12.6% | 33.8% |
Dissecting Demand Drivers: Machine Tools vs. Robotics
- [Company Explanation]: Management documented FA demand drivers in China as AI datacenters, semiconductor equipment, humanoid robot component machining, and New Energy Vehicles (NEVs).
- [Interpretation]: The phrase “humanoid robot component machining” in FA describes CNC systems sold to machine tool builders who cut parts for third-party robots. It does not signify sales of Fanuc robots.
- [Company Explanation]: In the Q1 conference call, management noted extended lead times prompted customers to place advance orders, creating uncertainty over whether FA order growth would persist.
3. Technology Architecture and Corporate Alliances
Fanuc has introduced technical capabilities and corporate alliances to position its hardware for AI integration. Examining primary texts reveals these initiatives remain in pre-commercial stages.
Three Open Platform Technical Features
Fanuc’s documentation highlights three open architecture capabilities:
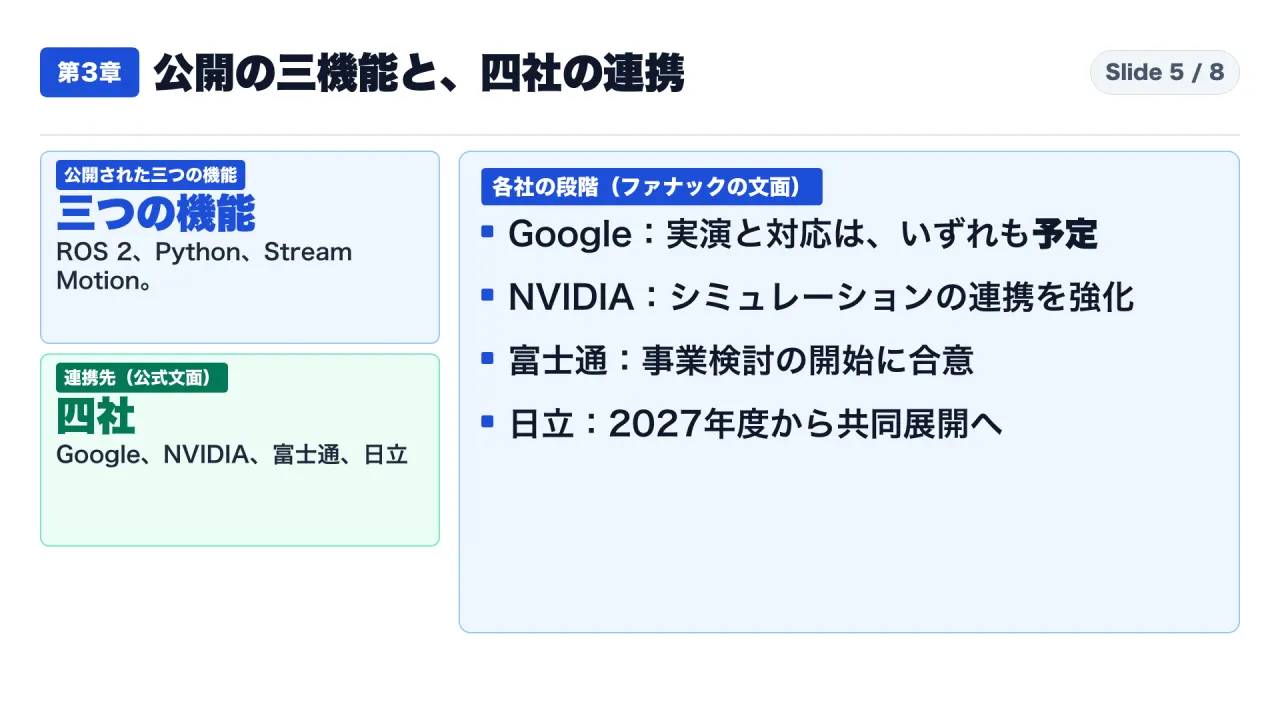
- Dedicated ROS 2 Driver: Open-source driver on GitHub interfacing Fanuc robots with ROS 2.
- Native Python Execution: Direct execution of Python scripts onboard the R-50iA controller without an external PC.
- Stream Motion: High-speed interface providing real-time trajectory streaming at a 1-millisecond cycle time (described by Fanuc as “industry leading”, unverified independently).
The Four Corporate Alliances
- Google (May 13, 2026): Collaborative demonstration using Gemini Enterprise AI agents to orchestrate robots. Fanuc confirmed planned compatibility with Alphabet’s Intrinsic platform and participation in DeepMind’s Gemini Robotics Trusted Tester program.
- NVIDIA (May 15, 2026): Simulation integration connecting NVIDIA Isaac Sim with Fanuc ROBOGUIDE software for digital twin verification.
- Fujitsu (July 16, 2026): Feasibility study agreement on speech-driven robot control and kitting operations.
- Hitachi (September 30, 2026): Partnership deploying Hitachi’s Ibaraki plant as “Customer Zero” to validate kitting and changeover through fiscal 2027, with joint commercial rollout scheduled from fiscal 2027 onward.
- [Interpretation]: None of the four alliances represent current commercial revenue. They encompass exhibition demonstrations (Google), simulation workflows (NVIDIA), feasibility studies (Fujitsu), and multi-year R&D targeting deployment from fiscal 2027 (Hitachi).
4. Executive Telemetry: High Inquiries, Pre-Commercial Trials
Management Commentary on Implementation Status
During Fanuc’s Q1 earnings call, executive leadership addressed Physical AI commercialization:
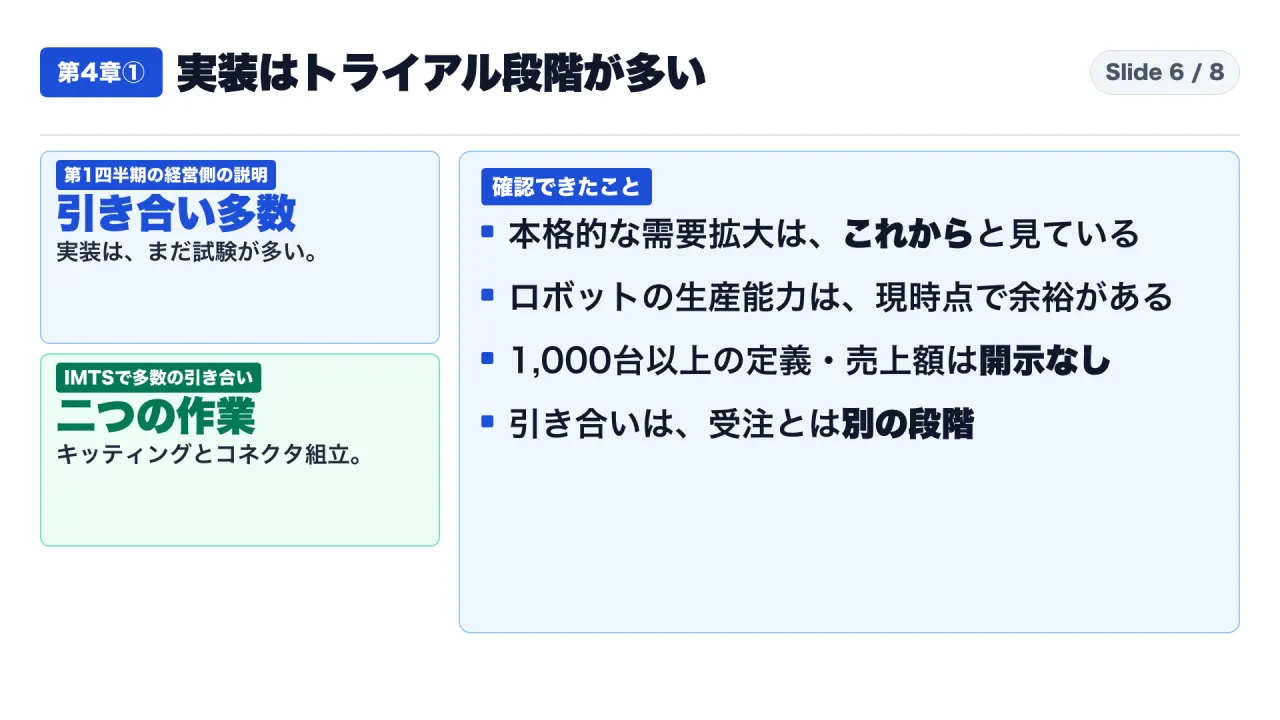
“[Company Explanation] Management (July 31, 2026): ‘Physical AI is an area of significant interest, and we are receiving inquiries from many customers… However, actual implementation remains largely in the trial stage. While we believe this will increasingly translate into concrete orders, full-scale demand expansion is expected to materialize going forward.’”
- [Company Explanation]: Leadership confirmed existing facilities provide adequate robot assembly capacity, with reserved land available if demand accelerates.
- [Company Explanation]: Providing standardized software modules alongside system integrators offers potential margin expansion, though no quantitative targets were released.
IMTS 2026 and the 1,000-Unit Metric
At IMTS 2026 (September, Chicago), Fanuc exhibited 43 robots and five Physical AI cells, citing high inquiries for AI kitting and connector assembly. Trade show inquiries, however, do not constitute backlog additions.
In its May 13, 2026 release, Fanuc stated that since iREX (December 2025), it had shipped “over 1,000 Fanuc robots for Physical AI applications.”
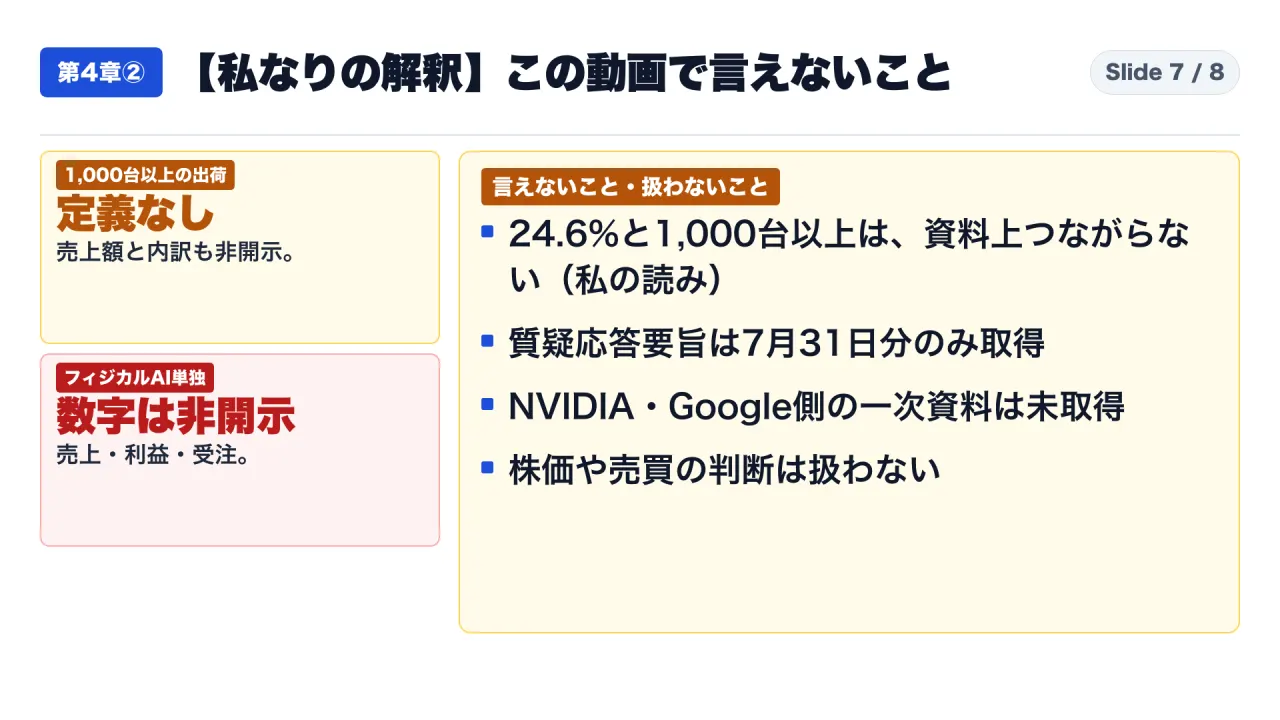
- [Interpretation]: Primary disclosures omit the application criteria defining “Physical AI related,” revenue generated, and the mix of collaborative models. These cumulative shipments reflect pilot deliveries rather than recurring volume production.
5. Synthesis: Decoupling the 24.6% Margin from the 1,000-Unit Metric
A review of Fanuc’s primary disclosures establishes that the first-half operating margin of 24.6% and cumulative shipments of over 1,000 Physical AI robots cannot be linked:
- Temporal and Categorical Mismatch: The 24.6% margin measures company-wide profitability over six months, whereas the 1,000-unit figure measures cumulative unit shipments since December 2025.
- Machinery CNC Leadership: Corporate growth was propelled by the FA division’s 130.1% order surge in China, while Robot division orders grew 12.6%.
- Trial Horizon: Management confirmed customer deployments remain exploratory, with alliances (Hitachi) targeting commercial scaling starting in fiscal 2027.
6. Delimited Analytical Scope and Explicit Non-Claims
- Undisclosed Financials: Standalone revenue, operating profit, and backlog for Physical AI do not exist in Fanuc statutory filings.
- Unverified Alliance Scope: Analysis of Google and NVIDIA collaborations is based solely on Fanuc releases; partner documentation was not examined.
- Self-Claimed Benchmarks: Stream Motion’s 1-millisecond cycle time as “industry leading” represents Fanuc positioning unverified by independent benchmarks.
- Calculated Q2 Margin: Derived Q2 operating margin of approximately 26.0% represents an independent calculation from rounded figures.
- No Investment Advisory: This analysis evaluates reporting transparency and provides no securities trading advice.
7. Strategic Playbook: A 3-Step Verification Protocol for Industrial Automation
Manufacturing leaders evaluating Physical AI should apply a three-step framework:
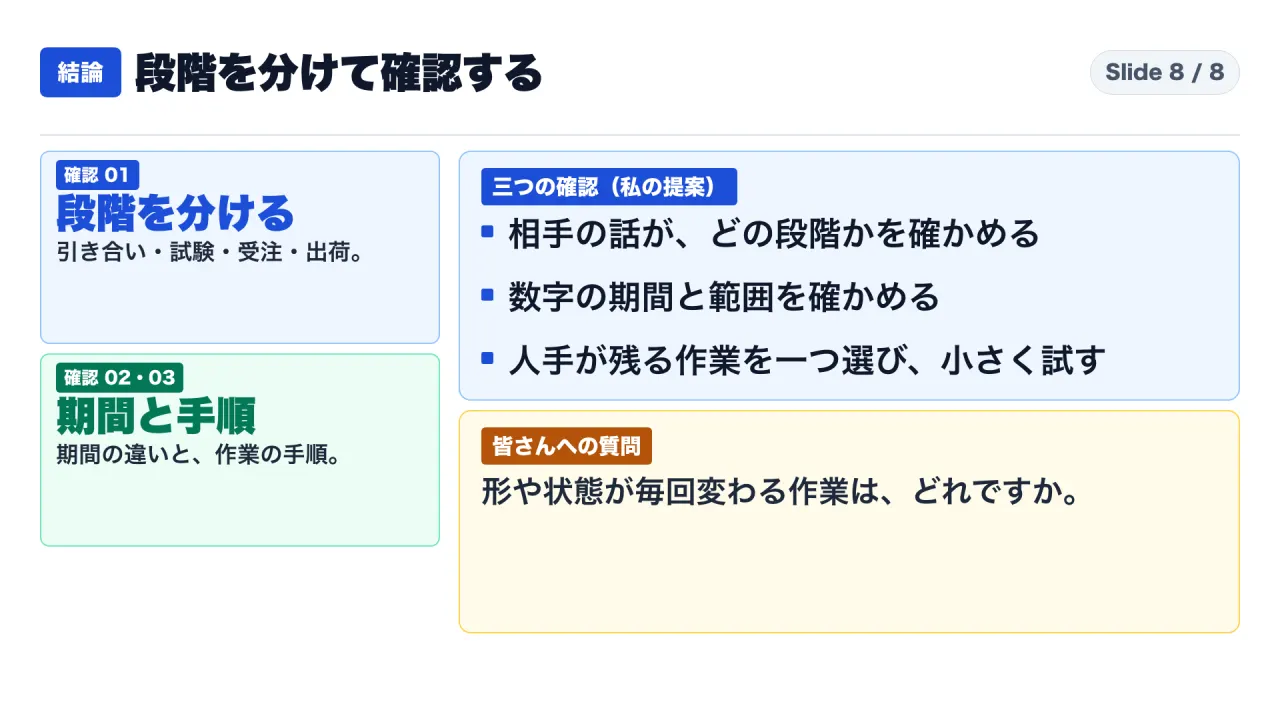
Step 1: Disentangle the Four Developmental Stages
Distinguish between supplier claims across four developmental gates:
- Inquiry (Hiki-ai): Preliminary interest at trade shows.
- Trial (Toraiaru): On-site prototyping and feasibility testing.
- Order (Juchu): Legally binding purchase contracts.
- Shipment (Shukka): Hardware unit deliveries (the 1,000-unit pilot metric).
Step 2: Harmonize Accounting Windows and Categories
Isolate quarterly performance (Q2 standalone at ~26.0%) from cumulative figures (H1 at 24.6%). Separate machine tool CNC automation (FA division +130.1%) from robotics automation (Robot division +12.6%).
Step 3: Implement Internal Pilot Metrics for Variable Factory Tasks
Isolate factory workflows where automation remains constrained by variable physical objects (e.g., bin picking, kitting, connector assembly, line changeover) and benchmark internal metrics: pick success rate, cycle time, intervention frequency, and recovery duration.
Frequently Asked Questions
Q1: Did Physical AI drive Fanuc’s upward earnings revision in October 2026?
A: No evidence in statutory filings supports this. Revisions were driven by Factory Automation (CNC systems) surging 130.1% in Q2 orders, fueled by AI datacenter infrastructure and semiconductor manufacturing equipment.
Q2: Was full-year operating profit guidance held flat or revised upward?
A: It was revised upward by 10.4%, from 218.0 billion yen (issued July 31, 2026) to 240.7 billion yen.
Q3: Did Fanuc’s operating margin improve from 23.2% to 24.6%?
A: Comparing 23.2% (Q1 standalone) directly to 24.6% (H1 cumulative) conflates timeframes. Independent calculation of standalone Q2 performance indicates an operating margin of approximately 26.0%.
Q4: Does shipping over 1,000 robots prove Physical AI is commercially mature?
A: No. The 1,000-unit metric represents cumulative shipments since December 2025 across undefined criteria. Management confirmed on July 31, 2026, that factory implementations remain in trial phases.
Q5: Are alliances with Google, NVIDIA, Fujitsu, and Hitachi generating immediate revenue?
A: No. These alliances represent technology demonstrations (Google), simulation tools (NVIDIA), feasibility studies (Fujitsu), and R&D targeting deployment from fiscal 2027 onward (Hitachi).
Primary Sources and References
- Fanuc Corporation Financial Results for Q2 FY2026 (October 23, 2026):
https://www.fanuc.co.jp/ja/ir/announce/pdf/2026/financialresult202609.pdf - Fanuc Corporation Q2 FY2026 Presentation Materials (October 23, 2026):
https://www.fanuc.co.jp/ja/ir/announce/pdf/2026/reference202609.pdf - Fanuc Corporation Q1 FY2026 Presentation Materials (July 31, 2026):
https://www.fanuc.co.jp/ja/ir/announce/pdf/2026/reference202606.pdf - Fanuc Corporation Q1 FY2026 Conference Call Q&A Summary (July 31, 2026):
https://www.fanuc.co.jp/ja/ir/announce/pdf/2026/qasummary202606.pdf - Fanuc Corporation News Release: Collaboration with Google (May 13, 2026):
https://www.fanuc.co.jp/ja/profile/pr/newsrelease/2026/news20260513.html - Fanuc Corporation News Release: Collaboration with NVIDIA (May 15, 2026):
https://www.fanuc.co.jp/ja/profile/pr/newsrelease/2026/news20260515.html - Fanuc Corporation News Release: Collaboration with Fujitsu (July 16, 2026):
https://www.fanuc.co.jp/ja/profile/pr/newsrelease/2026/news20260716.html - Fanuc Corporation News Release: Strategic Partnership with Hitachi (September 30, 2026):
https://www.fanuc.co.jp/ja/profile/pr/newsrelease/2026/news20260930.html - Fanuc Corporation Open Platform Technology Documentation (English):
https://www.fanuc.co.jp/en/product/robot/academia/3point.html