Why the AI Boom Is Paradoxically Stalling PC Sales: Inside the Memory Allocation Squeeze and the 4-Party Economic Divide
Intel’s Q3 2026 earnings disclosures, paired with financial telemetry from Amazon and Advantest, reveal how hyperscale AI capital expenditure siphons global memory wafer capacity away from personal computing, driving Intel’s projected gross margin down to 38.0% while test equipment vendors flourish.
Published: October 31, 2026 | Read time: ~10 min | Watch Video (Japanese)
Executive Summary: The Margin Paradox in Advanced Silicon
When Intel Corporation reported its financial results for the third quarter of 2026 on October 29, the headline numbers initially signaled an operational rebound. Quarterly revenue reached $14.9 billion, non-GAAP earnings per share (EPS) stood at $0.23, and adjusted gross margin arrived at 44.1%──outperforming prior corporate guidance by approximately two percentage points.
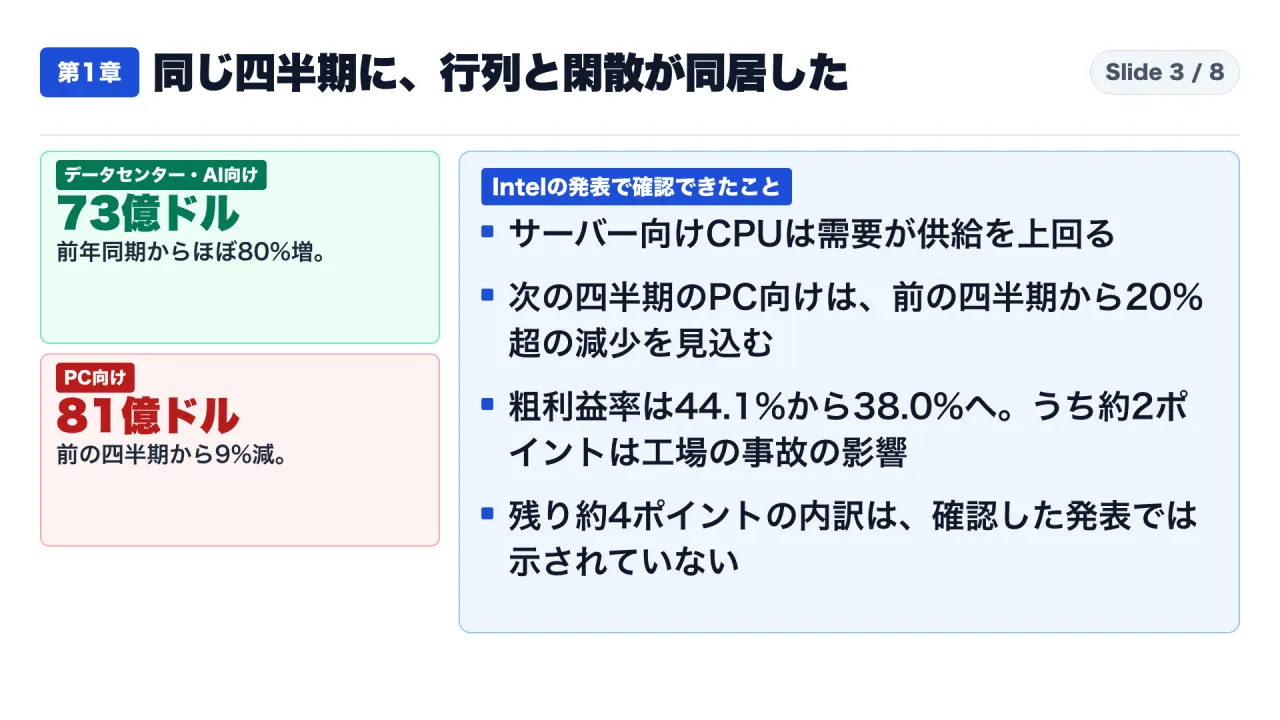
Yet Intel’s subsequent forward guidance triggered immediate scrutiny across technology procurement departments and capital markets. For the fourth quarter of 2026, management projected revenue between $15.0 billion and $16.0 billion (a midpoint of $15.5 billion), but forecasted non-GAAP gross margin to plummet by 6.1 percentage points to 38.0%.
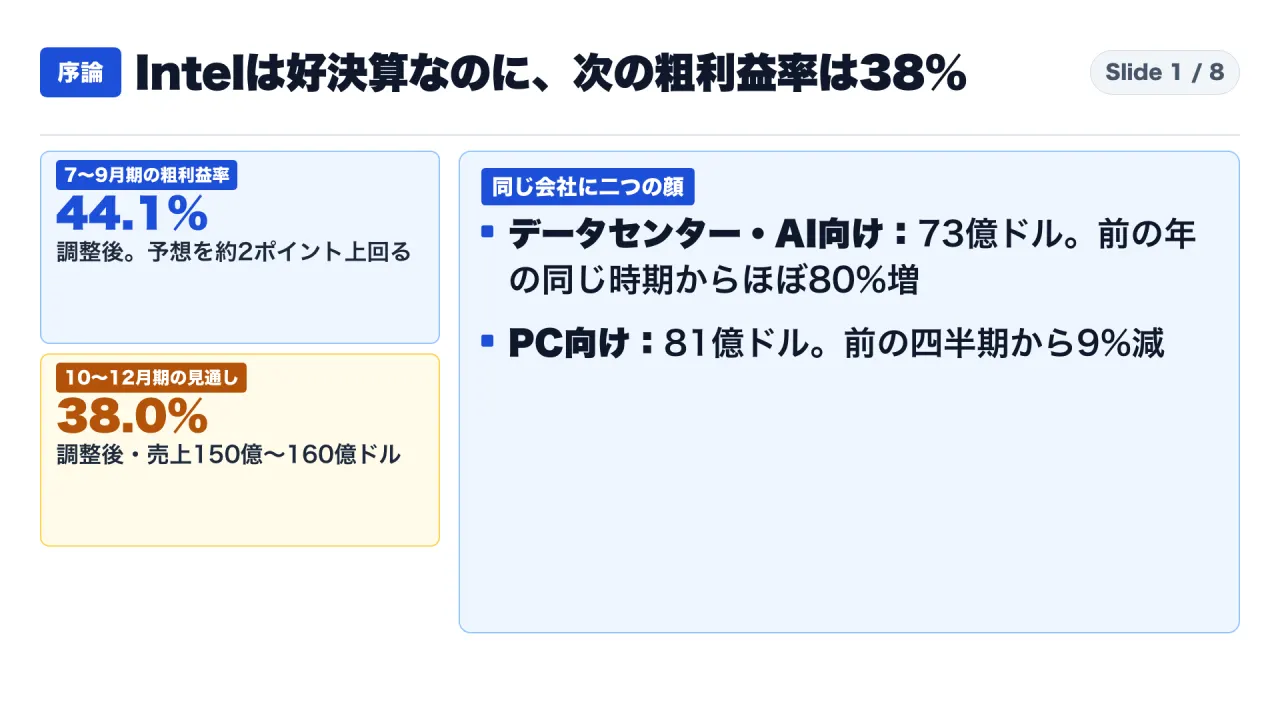
This disconnect──strong realized quarterly earnings paired with sharp margin erosion──exposes a fundamental structural shift within the semiconductor supply chain. While corporate investment into artificial intelligence infrastructure accelerates at historic velocity, that same capital expenditure is paradoxically depressing the personal computing market.
Inside Intel’s financial statements, two business units moved in diametrically opposed directions:
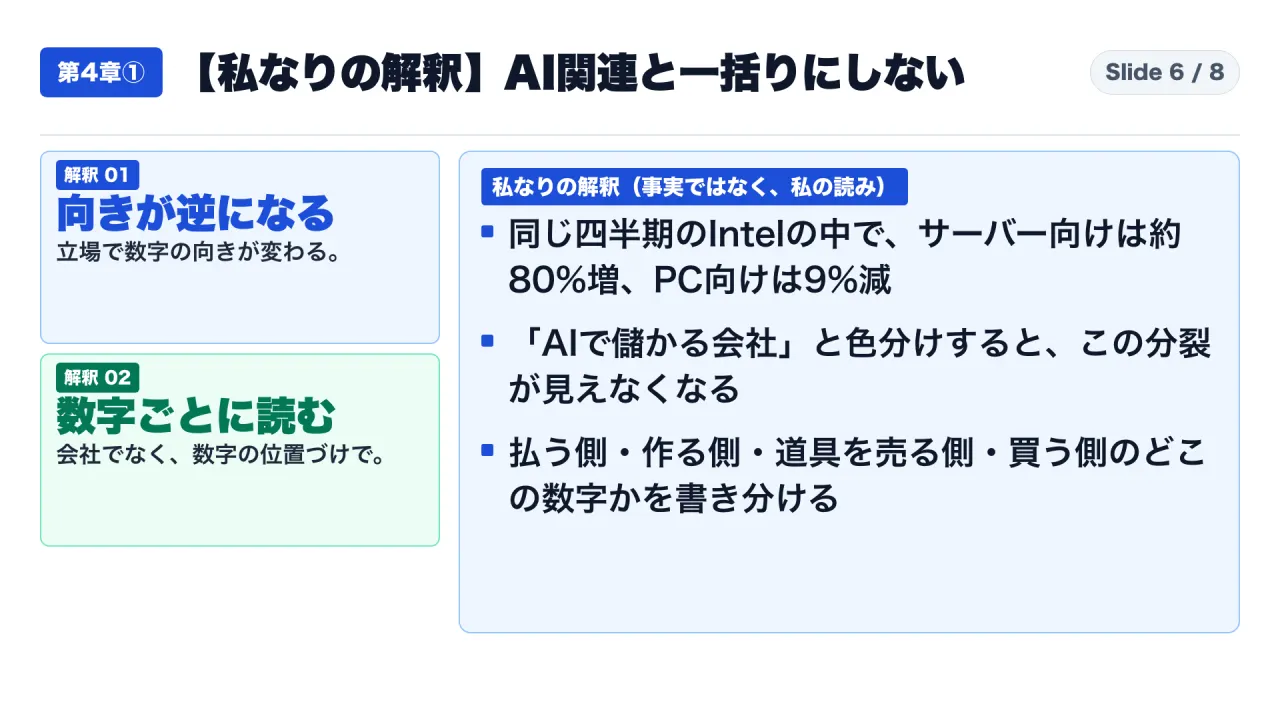
- Data Center and AI (DCAI): Revenue surged to $7.3 billion, advancing 17% sequentially and approximately 80% year-over-year, driven by demand far exceeding manufacturing supply.
- Client Computing Group (CCPG): Revenue contracted to $8.1 billion, down 9% sequentially and 5% year-over-year, leading Intel to forecast an approximate 12% contraction in total personal computer unit shipments across 2026.
This article dissects the physical and financial chain reaction connecting hyperscale AI clusters, global memory fab retooling, client PC bill-of-materials inflation, and enterprise procurement budgets. Drawing directly from primary regulatory filings from Intel Corporation, Amazon.com, Inc., and Advantest Corporation, this analysis outlines the contrasting economic realities across four distinct market positions.
The Four-Party Matrix: Why AI Capital Expenditure Produces Inverted Economic Realities
Treating “AI-related technology” as a homogeneous asset class creates severe blind spots in corporate IT planning. The identical macro-level wave of artificial intelligence investment produces opposite balance sheet outcomes depending on where an organization sits within the compute ecosystem:
| Market Position | Representative Entity | Financial Metric and Horizon | Verified Directional Reality |
|---|---|---|---|
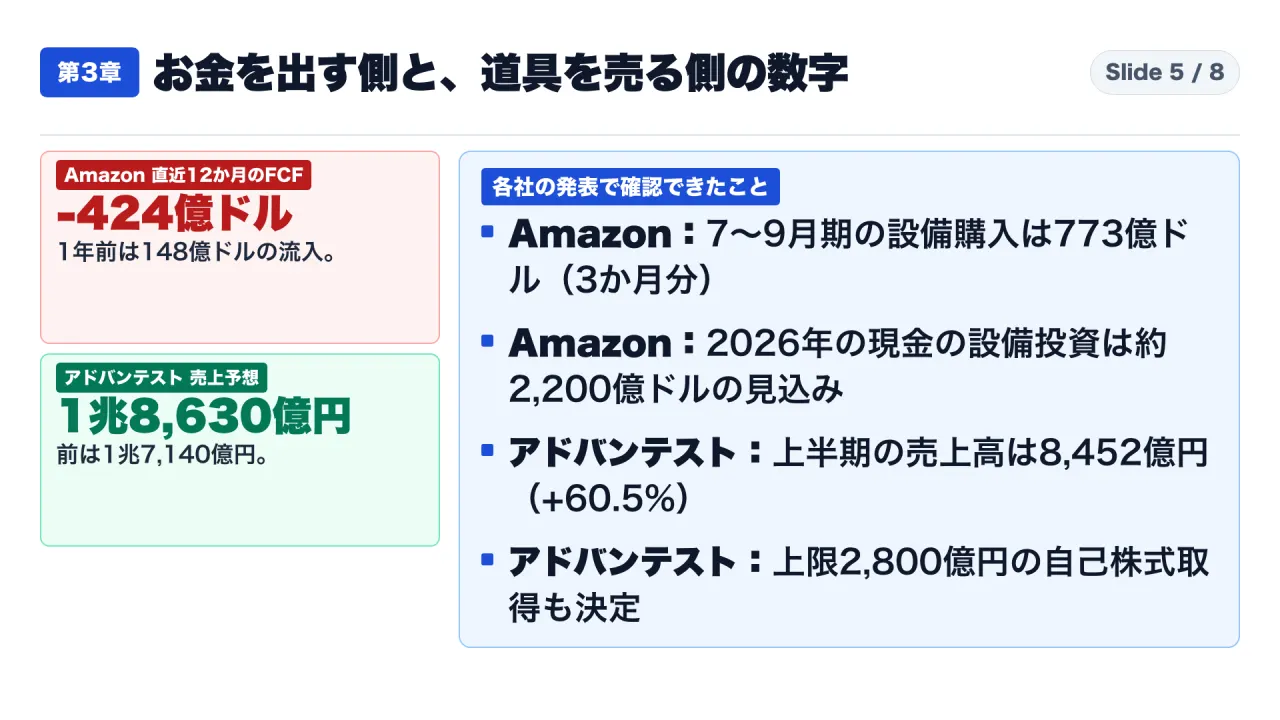
| Capital Spender | Amazon.com, Inc. | Trailing twelve-month (TTM) CapEx expanded from $51.9B to $83.0B; TTM Free Cash Flow dropped 42% from $47.7B to $27.9B. | Cash flow compressed by massive cloud infrastructure investments. |
| Silicon Fabricator | Intel Corporation | Q3 revenue $14.9B; DCAI revenue up 80% YoY to $7.3B, but CCPG client revenue down 9% QoQ to $8.1B; Q4 gross margin guided down to 38.0%. | Severe internal divergence between server growth and PC volume contraction. |
| Tool and Equipment Vendor | Advantest Corporation | Full-year net sales forecast raised from 1,714 billion yen to 1,863 billion yen; operating income guided to 720 billion yen; announced 50 billion yen share buyback. | Explosive revenue and margin expansion from high-density memory testing equipment. |
| Hardware Buyer / Client Segment | Enterprise IT / PC OEMs | PC shipment forecast down ~12% in 2026; DRAM and storage BOM costs escalating due to server wafer allocation. | Budget contraction, lengthened procurement cycles, and device refresh deferrals. |
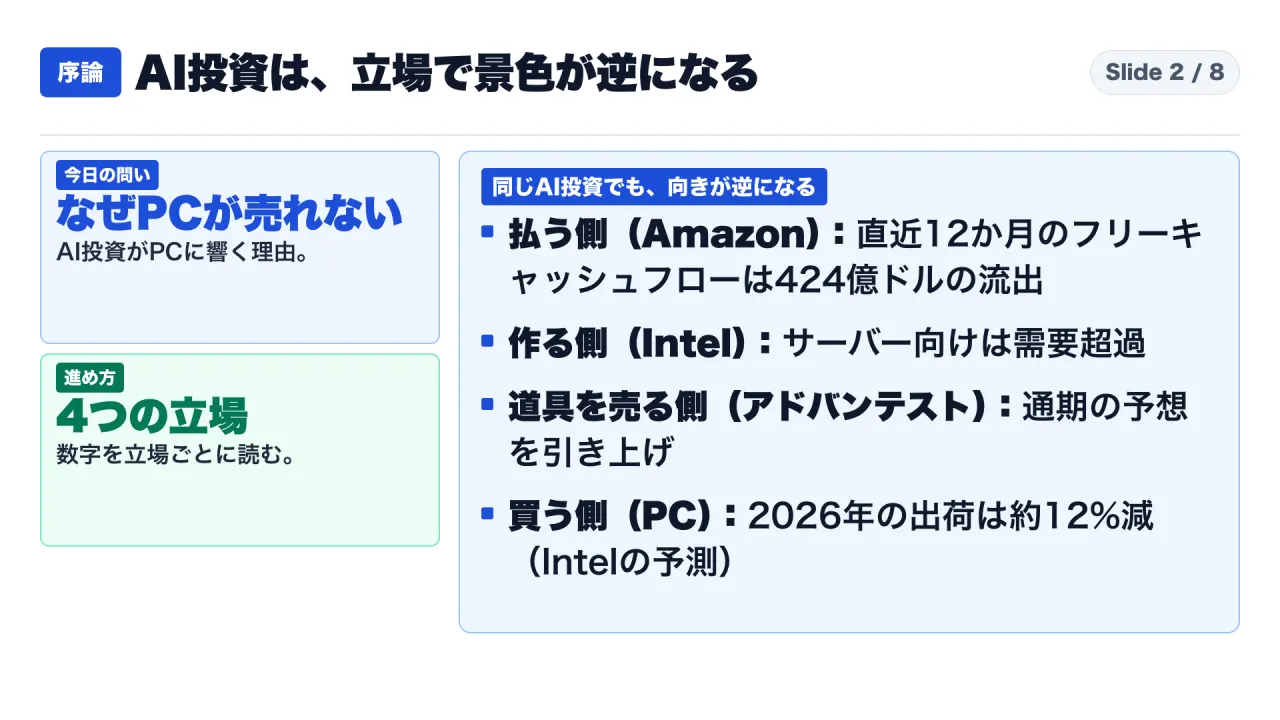
Understanding these diverging trajectories requires examining accounting definitions and reporting baselines:
- Gross Margin: The ratio of gross profit (revenue minus cost of sales) to total revenue, indicating fundamental production efficiency and pricing power.
- GAAP versus Non-GAAP: Intel’s non-GAAP metrics exclude specific acquisition-related costs, restructuring charges, and discrete fab disruption impacts to depict ongoing operational performance.
- Free Cash Flow: Operating cash flow minus property, equipment, and capital expenditures, reflecting actual cash generation available for discretionary allocation.
- Trailing Twelve Months (TTM): A continuous rolling twelve-month aggregation that neutralizes quarterly seasonality.
Intel’s Two Faces: Server Processors Surge 80% While Client PCs Retract
During the Q3 2026 earnings conference call, Intel’s CEO characterized the DCAI segment’s top-line performance as the strongest observed in that division in fifteen years. However, when examining quarterly results on an apples-to-apples basis, the division between data centers and client computing becomes unmistakable:
- Sequential Comparison (Q3 2026 vs Q2 2026): DCAI advanced 17%, while CCPG contracted 9%.
- Year-over-Year Comparison (Q3 2026 vs Q3 2025): DCAI expanded nearly 80%, while CCPG declined 5%.
Explaining the 6.1 Percentage Point Margin Compression
How does an organization beating quarterly expectations justify guiding next-quarter gross margin down from 44.1% to 38.0%? Intel’s financial disclosures attribute this 6.1 percentage point drop to specific operational drivers:
- Cleanroom Accident Disruption: An operational incident occurring in October 2026 at Intel’s Kiryat Gat manufacturing campus in Israel caused an estimated $300 million financial impact, contributing approximately 200 basis points (2.0 percentage points) of gross margin compression.
- Client PC Volume Retraction and Factory Absorption: The remaining roughly 410 basis points of margin decline reflect lower expected client PC processor volumes, manufacturing startup costs, and packaging cost friction across modern multi-die architectures.
When client PC original equipment manufacturers (OEMs) pull back orders, fixed depreciation costs across massive silicon wafer fabrication plants are spread over fewer finished dies, directly eroding gross margins.
From AI to Memory, and Memory to PCs: Intel Management’s Causal Sequence
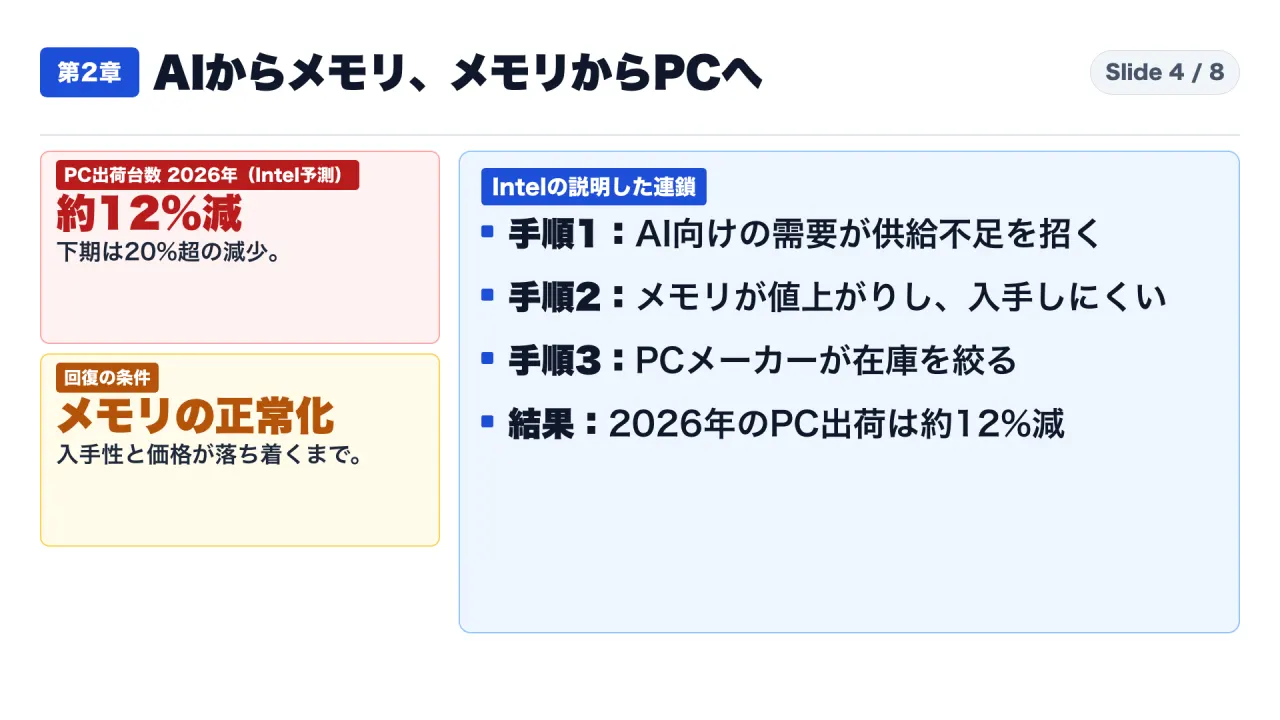
During the earnings presentation, Intel management outlined a direct five-stage chain reaction explaining why client computing is decelerating:
The Five-Stage Transmission Mechanism
- Hyperscale AI Capacity Buildout: Global cloud operators and sovereign entities allocate unprecedented capital to deploy generative AI clusters, demanding unprecedented quantities of high-bandwidth memory (HBM) and high-density server DDR5 modules.
- Wafer Fab Production Reallocation: Leading memory manufacturers (such as SK Hynix, Samsung, and Micron) aggressively reallocate cleanroom wafer capacity away from commodity client PC DRAM and NAND towards complex, high-margin HBM stacks.
- Severe Memory Market Tightening: Intel’s CEO noted that the broader computing industry faces one of the most severe memory supply shortages in semiconductor history. Memory packaging yield challenges further limit net usable bit supply.
- PC OEM Supply Friction: Personal computer manufacturers cannot secure sufficient memory modules at predictable prices. Inability to procure matching memory configurations halts PC assembly lines, leaving OEMs with unbalanced component inventories.
- Client PC Shipment Compression: Confronted by component shortages and elevated bill-of-materials costs, PC OEMs reduce processor purchases from Intel. Intel’s internal forecasting models project total 2026 personal computer unit shipments to decline by approximately 12%.
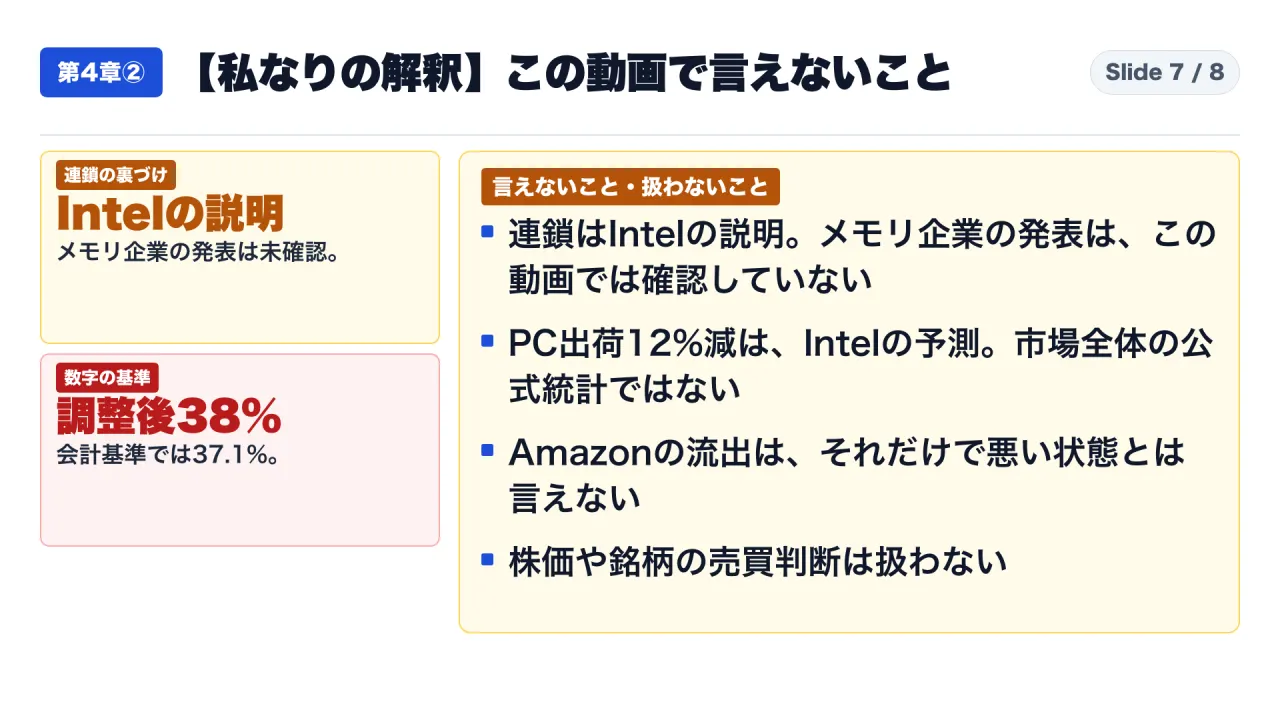
While this causal chain reflects Intel management’s operational explanation, enterprise buyers must recognize that Intel’s disclosures do not provide third-party audit data for global memory wafer allocations or independent validation of the 12% shipment forecast.
Outside the Silicon Core: Telemetry from Amazon and Advantest
Validating Intel’s thesis requires examining public filings from corporations operating at opposite ends of the compute value chain: the capital spender financing infrastructure and the equipment manufacturer supplying testing tools.
Amazon: Core Retail and Cloud Health Masking Capital Absorption
On October 29, 2026, Amazon.com, Inc. announced its financial results for the third quarter ended September 30, 2026. The operating performance of its underlying business units remained robust:
- Net Sales: Reached $201.9 billion, climbing 12% year-over-year compared to $180.2 billion in Q3 2025.
- Operating Income: Rose to $21.5 billion, expanding 24% year-over-year compared to $17.4 billion in Q3 2025.
However, the cash flow statement tells an entirely different story regarding infrastructure reinvestment:
Amazon Trailing Twelve Months (TTM) Financial Comparison:
Operating Cash Flow:    $112.7B (Q3 2025) -> $110.9B (Q3 2026) [-2%]
Capital Expenditures:   $51.9B  (Q3 2025) -> $83.0B  (Q3 2026) [+60%]
Free Cash Flow:         $47.7B  (Q3 2025) -> $27.9B  (Q3 2026) [-42%]
Amazon invested $83.0 billion into capital assets over the trailing twelve months──predominantly directed toward data center land, electrical substations, custom silicon, and server clusters for Amazon Web Services (AWS). Despite generating over $200 billion in quarterly sales, Amazon’s free cash flow contracted by 42% because capital expenditure expanded by $31.1 billion.
Advantest: Upward Earnings Guidance and Capital Return
Concurrently, on October 28, 2026, Japanese semiconductor test equipment leader Advantest Corporation released its fiscal 2026 second-quarter financial results. As semiconductor architectures incorporate multi-layer HBM stacks and multi-die chiplets, testing times and test complexity increase exponentially.
Advantest raised its consolidated full-year earnings guidance across every major financial metric:
- Net Sales: Revised upward from 1,714 billion yen to 1,863 billion yen.
- Operating Income: Forecasted to reach 720 billion yen.
- Share Repurchase: Authorized a board resolution to acquire up to 50 billion yen of its own common stock.
Advantest noted that surging demand for advanced memory testing systems and complex system-on-chip (SoC) testers directly underpinned its earnings upgrade. While equipment providers celebrate record order backlogs, this operational telemetry confirms that advanced packaging and memory manufacturing bottlenecks remain severe.
Analytical Synthesis: The Hazard of Monolithic “AI-Related” Labeling
Synthesizing these primary source filings yields a critical governance takeaway: aggregating enterprise technology under a generic “AI” label obscures operational risk.
Three Analytical Inferences
- Decouple Silicon Portfolios: Within a single enterprise like Intel, high-density server processors and standard client PC silicon experience opposing economic pressures. Strong AI demand does not guarantee uniform revenue growth across corporate divisions.
- Follow the Physical Wafer Allocation: When hyperscale operators commit tens of billions of dollars to specialized compute clusters, component fabricators reconfigure cleanroom lithography lines to capture high-margin demand. Commodity components──such as standard laptop DDR5 and client SSDs──suffer production displacement.
- Scrutinize Financial Horizons and Accounting Standards: Comparing Amazon’s trailing twelve-month free cash flow to Intel’s quarterly non-GAAP margin guidance or Advantest’s full-year guidance requires accounting discipline. Analysts must normalize reporting periods and accounting standards before drawing macroeconomic conclusions.
Methodological Boundaries: Verified Facts versus Unsubstantiated Assertions
To maintain strict analytical integrity, technology leaders must distinguish audited disclosures from corporate narratives:
| Narrative Assertion | Verification Status | Regulatory and Documentary Evidence |
|---|---|---|
| Intel Q3 revenue of $14.9B and non-GAAP gross margin of 44.1% | Audited Fact | Confirmed in Intel’s official Q3 2026 earnings release and Form 10-Q filing. |
| Intel Q4 gross margin outlook of 38.0% | Corporate Guidance | Disclosed in Intel’s Q3 2026 Prepared Remarks; subject to forward operational risks. |
| Amazon TTM Free Cash Flow decline of 42% | Audited Fact | Calculated directly from cash flow statements in Amazon’s Q3 2026 earnings release. |
| Advantest FY2026 full-year sales revision to 1,863 billion yen | Corporate Guidance | Documented in Advantest’s official Tokyo Stock Exchange release on October 28, 2026. |
| AI memory crowding out client PC shipments by ~12% | Company Forecast | Stated by Intel management during earnings remarks; unverified by independent macroeconomic telemetry. |
Enterprise IT Procurement Playbook: Managing Hardware Refresh Cycles
For enterprise Chief Information Officers, IT procurement directors, and hardware purchasing managers planning client PC or server fleet renewals across the upcoming twelve months, these market dynamics require actionable risk management:
Tactical Verification Steps for Corporate Buyers
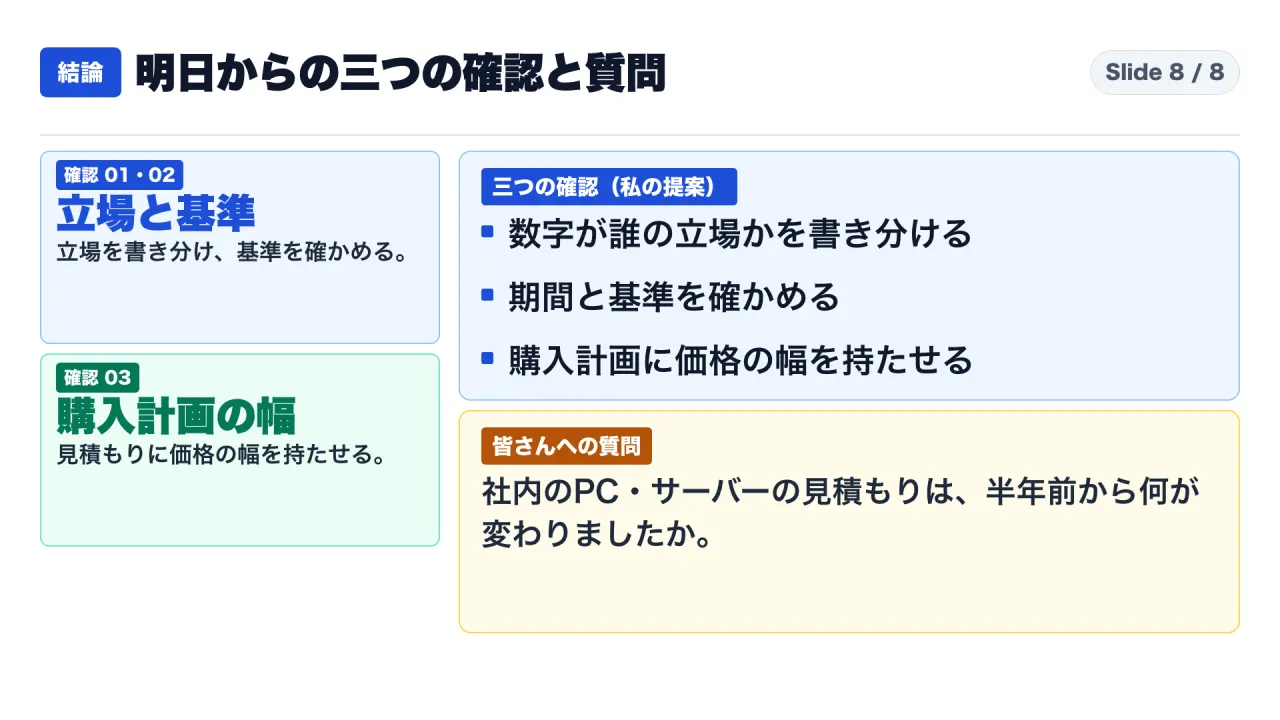
- Standardize Quotation Baselines: When evaluating PC refresh proposals, compare current vendor bids against historical pricing from six months prior, holding hardware configurations (CPU SKU, RAM capacity, SSD endurance) strictly identical.
- Inquire on Memory Supply Guarantees: Ask OEM hardware vendors whether quoted pricing and delivery timelines are contingent on memory module availability or subject to bill-of-materials escalation clauses.
- Incorporate Lead-Time Elasticity: Avoid committing to fixed corporate deployment dates without obtaining written vendor fulfillment commitments. Expect standard 30-day quotation validity windows to compress to 14 days or fewer.
- Establish Budgetary Contingency Bands: Model PC procurement budgets with an upward tolerance band of 10% to 15% to absorb memory cost pass-throughs from original equipment manufacturers.
Enterprise Procurement Verification Protocol:
[ ] Baseline Configuration Locked: CPU generation, memory density, and storage class verified against prior purchase order.
[ ] Price-Lock Validity Verified: Quotation expiration terms explicitly documented in vendor contract.
[ ] Memory Allocation Assessed: OEM confirmation received regarding dedicated memory module inventory.
[ ] Delivery Window Cushion: Fleet rollout schedules incorporate a 45-day operational buffer.
Frequently Asked Questions and Governance Traps
Q1: Does Intel’s strong Q3 performance indicate that the personal computer market has recovered?
No. Intel’s revenue beat was driven by strong data center demand and pricing, while client computing revenue contracted 9% sequentially. Management forecasts full-year 2026 PC unit shipments to decline by approximately 12%.
Q2: Did Amazon’s 42% free cash flow drop signal fundamental operating weakness?
No. Amazon’s operating income grew 24% year-over-year to $21.5 billion. The free cash flow decline was driven entirely by an increase in capital expenditures, which surged from $51.9 billion to $83.0 billion on a trailing twelve-month basis.
Q3: Can Advantest’s upward earnings revision be used as proof that all AI companies are thriving?
No. Advantest manufactures specialized semiconductor test equipment. Its earnings expansion reflects high demand for testing complex HBM and advanced packaging, even as downstream device assemblers face margin compression.
Q4: Should enterprise IT departments accelerate PC purchases immediately to beat memory price hikes?
Procurement decisions should be guided by internal lifecycle requirements and vendor quotation terms rather than speculative price timing. IT leaders should request written price-lock guarantees and verify component lead times before accelerating hardware expenditures.
Primary Sources and References
- Intel Reports Third-Quarter 2026 Financial Results (October 29, 2026)
- Intel Corporation Q3 2026 Prepared Remarks Transcript (October 29, 2026)
- Amazon.com Announces Third Quarter Results (October 29, 2026)
- Advantest Corporation Financial Highlights and Forecast (October 28, 2026)
- Advantest Corporation FY2026 Q2 Financial Summary (October 28, 2026)
- Advantest Corporation Share Repurchase Resolution (October 28, 2026)