Can Salary Premiums and Developer Layoffs Coexist? ── Reading the Randstad AI Survey Against Barclays' Headcount Cuts
While Randstad reports non-tech enterprises paying up to 17% salary premiums for AI talent, Barclays projects ~5,000 headcount cuts citing developer productivity gains—proving that macroeconomic demand metrics and corporate restructuring reflect entirely different operational dynamics.
Published: October 31, 2026 | Read time: ~10 min | Watch Video (Japanese)
Executive Summary: Two Seemingly Contradictory Signals
During late October 2026, technology leaders and human resource directors were confronted with two prominent, seemingly contradictory announcements regarding engineering employment in the age of artificial intelligence.
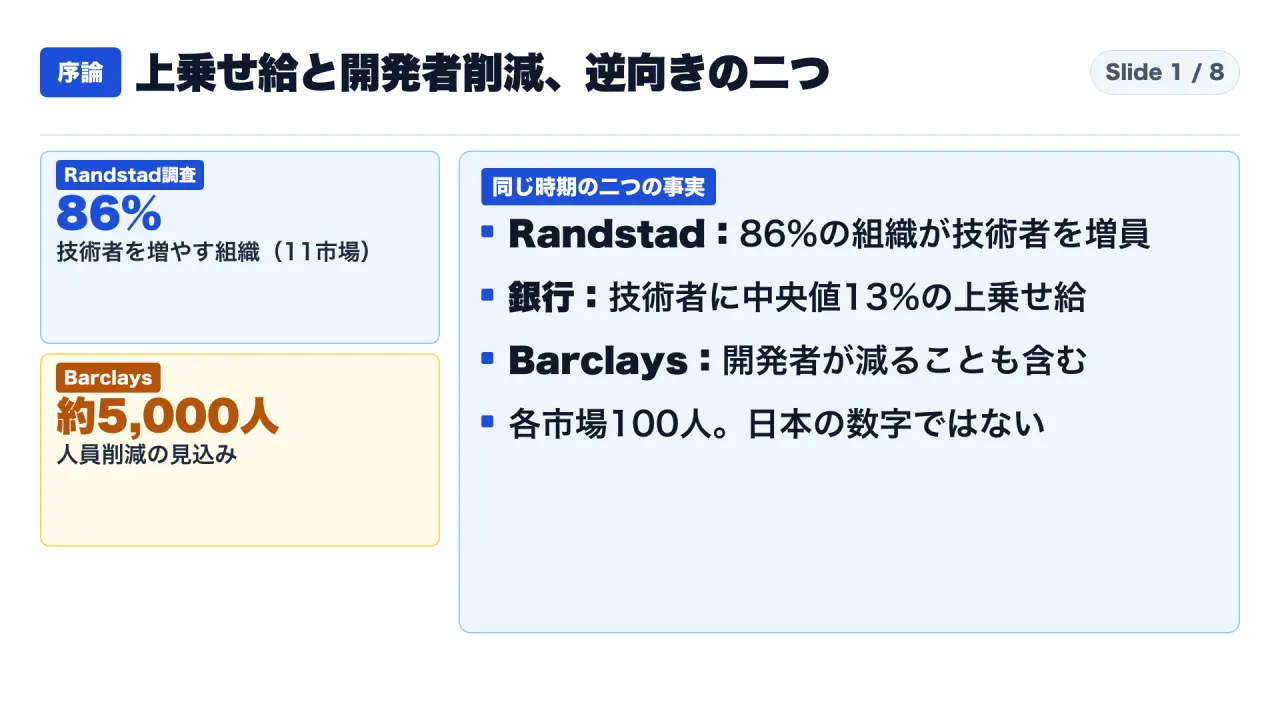
On October 29, 2026, global recruitment firm Randstad released its study, “Tech Talent in Transition: Building the AI-Ready Workforce.” The headline findings suggested surging demand: 86% of surveyed employers reported expanding their technical workforces, non-technology enterprises were paying salary premiums up to 17%, and job postings requiring generative AI capabilities had surged more than fivefold.
Just seven days prior, on October 22, 2026, British multinational bank Barclays presented its Q3 2026 financial results. Executive management projected an estimated reduction of approximately 5,000 full-time equivalent (FTE) employees—roughly 5% of its global workforce—under its 2026 Structural Cost Actions (SCAs). Leadership explicitly stated that approximately 60% of these actions centered on group support functions, where headcount reductions included software developers whose productivity had been augmented by artificial intelligence.
These disclosures appear incompatible. Is the enterprise market bidding up software talent, or is artificial intelligence driving engineering layoffs?
The primary finding of this cross-examination is that the contradiction is an optical illusion born of conflating fundamentally different metrics:
- Randstad measured changing hiring qualifications and recruitment sentiment across 1,100 senior enterprise decision-makers in 11 countries, supplemented by job posting indices.
- Barclays reported an individual financial institution’s multi-year operational restructuring budget, subject to collective bargaining, where efficiency gains from coding assistants are integrated alongside branch closures and customer call automation.
Neither data point proves that traditional software engineering has ended, nor does it guarantee that acquiring a basic AI certification will yield a 17% pay raise. Understanding the real transformation requires separating statistical baselines, examining corporate incentives, and distinguishing task execution from professional accountability.
Methodology & Denominators: Survey Architecture
To evaluate Randstad’s assertions objectively, one must inspect the survey mechanics, sample boundaries, and commercial context.
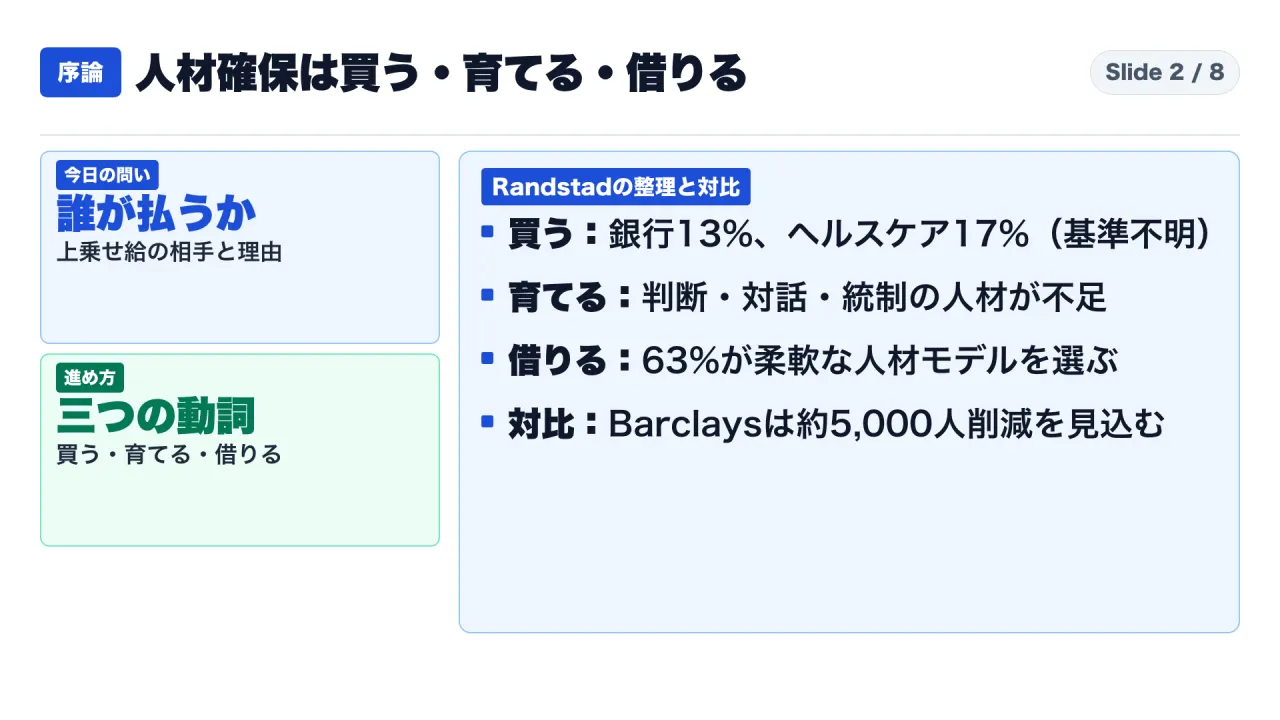
Randstad operates across 39 global markets with ~38,000 employees, generating 23.1 billion euros in 2025 revenue. Its October 2026 report combines two inputs:
- Senior Executive Polling: Conducted in August 2026 across 11 markets (Australia, Belgium, France, Germany, India, Italy, Japan, Netherlands, Spain, UK, US). Exactly 100 senior leaders were polled per market (1,100 total respondents via Evalueserve).
- Market Intelligence Telemetry: Analysis across 20M+ job postings and ~100M candidate profiles.
Three methodological boundaries must be maintained:
- Sample Distribution: The “86% of employers” reflects 86% of the 1,100 surveyed decision-makers—not an exhaustive global census.
- Geographic Representation: Japan’s sample comprised 100 respondents, offering an indicative sentiment snapshot rather than a definitive national census.
- Reporting Access: Public disclosures include global and US releases and a summary portal; full whitepapers require gated registration.
Randstad structures talent acquisition into three pillars: Buying (external hiring), Building (internal reskilling), and Borrowing (contingent talent).
“Buying” Talent: Deconstructing the 13% and 17% Salary Premiums
The most publicized element of Randstad’s release was the assertion that non-technology enterprises are actively outbidding traditional technology firms to secure digital talent.
The Stated Claims
Randstad reported that non-tech sectors are leveraging balance sheets to attract engineering talent:
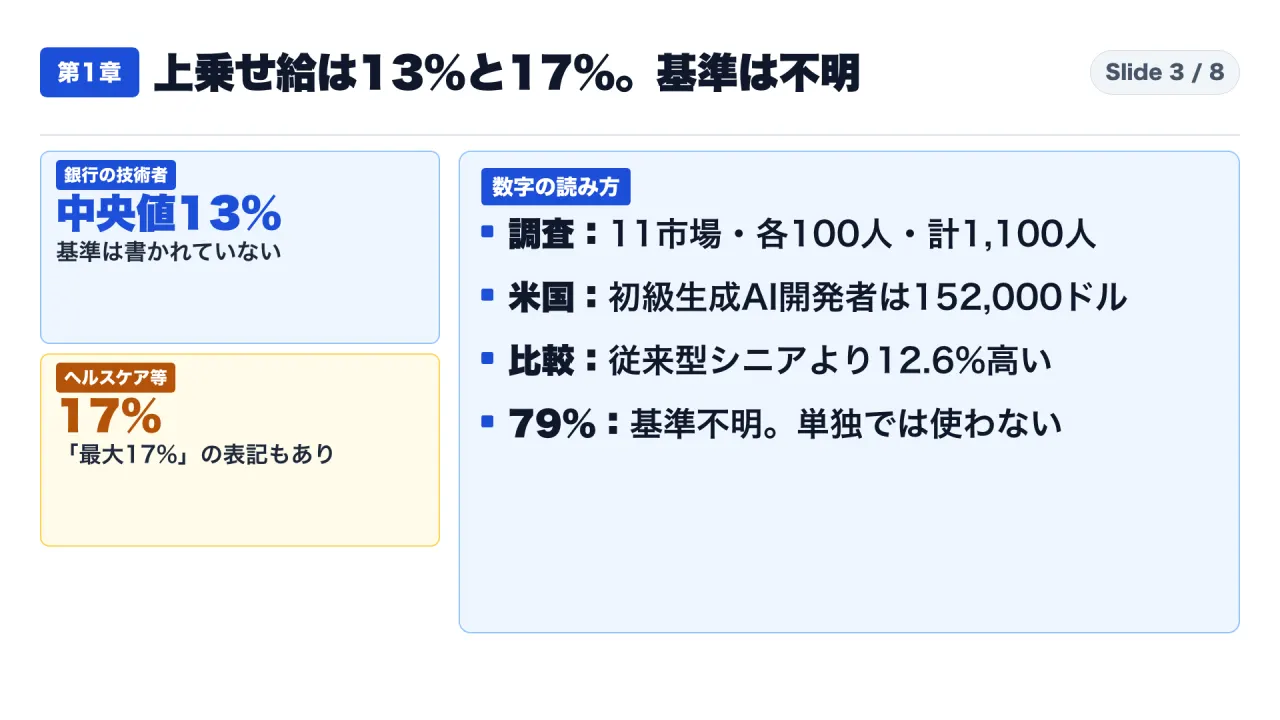
- Commercial banking institutions are paying a median 13% salary premium for software developers.
- Healthcare and life sciences organizations are paying up to 17% more for specialized technical talent.
- 55% of surveyed non-tech organizations globally (and 70% in the United States, 15 percentage points above global averages) reported actively hiring engineers following major tech-sector layoffs.
In its US-specific disclosure, Randstad provided concrete baseline figures: an entry-level generative AI developer in the United States commanded an average starting salary of $152,000, compared to $135,000 for a traditional senior software developer—an exact premium of 12.6% (152,000 divided by 135,000 equals 1.1259).
Missing Baselines and Analytical Limitations
A rigorous audit reveals critical missing parameters behind these percentages:
- Undefined Comparators: The release states that banks pay a “median 13% premium,” but fails to define the reference baseline. Does this represent 13% above traditional internal bank IT scales, general national engineering averages, or Big Tech compensation? Without a documented baseline, the percentage cannot be translated into absolute earnings.
- Linguistic Variance: The 17% healthcare premium is framed as “up to 17% more” in executive summaries but referred to as “17% more” in narrative paragraphs. An upper ceiling differs fundamentally from a median distribution.
- Unverified Outliers: Randstad’s portal mentions that entry-level generative AI talent commands a “79% salary premium,” yet omits geographic scope, role descriptions, and sample sizes. The 79% figure cannot be treated as verified empirical data.
- Local Labor Insulation: Applying these figures to Japanese labor agreements is structurally invalid. Japanese enterprise hiring operates under distinct collective bargaining frameworks, lifetime employment norms, and structured grade pay systems that do not mirror Anglo-American spot-market bidding.
“5x Job Postings” vs. Barclays’ ~5,000 Reductions: Resolving the Paradox
The apparent clash between surging AI demand and developer layoffs crystallizes when contrasting Randstad’s hiring metrics with Barclays’ Q3 2026 earnings disclosures.
The Surge in AI Job Requirements
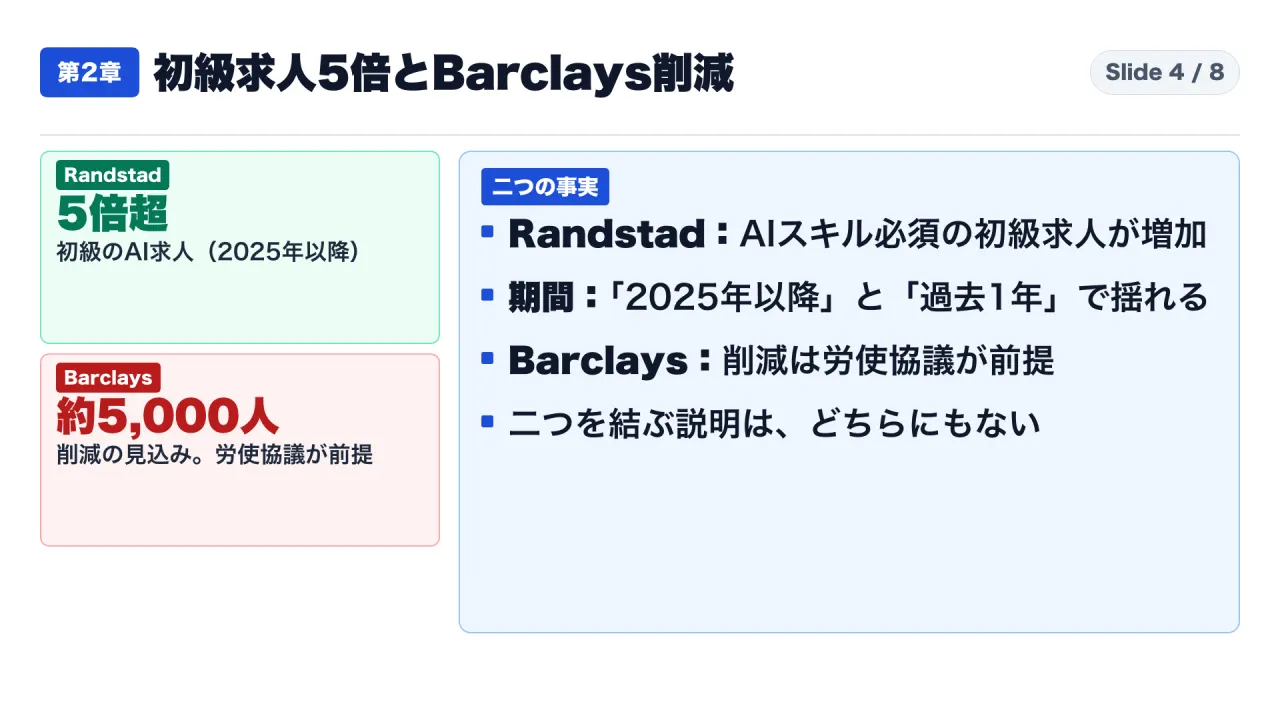
Randstad states that entry-level technical job postings requiring AI capabilities expanded by more than 5x since 2025 (with press releases alternately describing the surge as occurring “over the past year”). The underlying direction is unambiguous: enterprise job descriptions increasingly treat familiarity with AI frameworks and coding copilot environments as mandatory baseline criteria rather than optional electives.
Barclays’ Projected Headcount Reduction
On October 22, 2026, Barclays Group Chief Executive C.S. Venkatakrishnan and Finance Director Anna Cross delivered their Q3 2026 results. The presentation outlined the bank’s multi-year efficiency drive:
- Headcount Projection: Management projected a reduction of approximately 5,000 full-time equivalent staff (roughly 5% of Barclays’ ~100,000 global workforce) stemming from 2026 Structural Cost Actions (SCAs).
- Functional Allocation: Management indicated that approximately 60% of structural actions targeted group support functions, explicitly noting that this included developers whose productivity had been augmented by artificial intelligence.
- Financial Context: Barclays booked 201 million GBP in Q3 restructuring charges, delivering approximately 700 million GBP in gross annual structural efficiencies over the preceding two years, with cumulative gross cost reductions projected to exceed 1.1 billion GBP by 2027.
Critical Restructuring Boundaries
A careful review of Barclays’ investor transcripts establishes essential caveats:
- Projected, Not Realized: The 5,000 figure is a forward-looking management estimate tied to multi-year restructuring programs, not an executed layoff tally.
- Mandatory Consultation: Reductions remain strictly subject to national collective bargaining agreements and employee consultation procedures across the UK and Europe.
- Broad Operational Scope: The ~60% support function category is not exclusive to software engineers. The presentation highlighted customer automation initiatives that drove a 10% annual reduction in customer call center volume and a 10% reduction in average branch staffing.
- Undisclosed Developer Headcount: Barclays never disclosed how many of the 5,000 projected reductions consist of software engineers versus back-office operational, compliance, or administrative personnel.
The two reports measure fundamentally different phenomena. Randstad captures the rising qualification floor across open requisitions, while Barclays illustrates how enterprise automation allows mature institutions to constrain back-office headcount growth while expanding transaction volume.
“Building” and “Borrowing”: The Shift to Governance and Integration
Both disclosures confirm an underlying reality: as generative AI automates routine, boilerplate syntax generation, enterprise demand shifts decisively from raw code production toward system architecture, critical evaluation, and risk governance.
The Critical Skills Deficit
Randstad’s findings illustrate that technical managers struggle far more to recruit professionals possessing analytical rigor and interpersonal influence than raw coders:
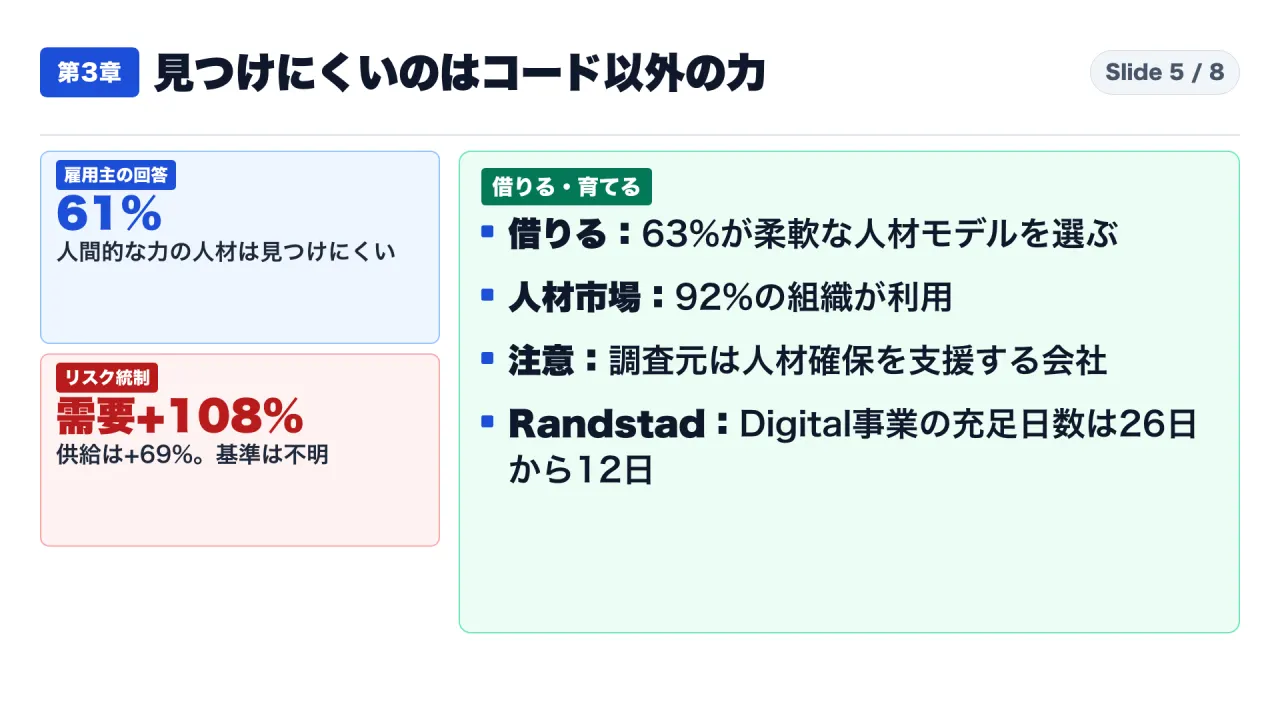
- Critical Thinking and Communication: 61% of employers across all 11 markets (and 69% in the United States) reported that finding candidates with strong critical thinking, communication, and stakeholder management skills is significantly more difficult than finding candidates with purely technical coding capabilities.
- System Design and Workflow Integration: 41% of US technology executives cited system architecture and the ability to integrate AI into existing business workflows as their single hardest hiring challenge. Global demand for system design skills increased by 308% compared to 2020.
- The Risk Governance Chasm: Enterprise demand for AI risk governance skills—encompassing compliance, data privacy, and model accountability—surged by 108%, while the labor market supply of qualified professionals grew by only 69%.
- Skill-Based Hiring vs. Degrees: 73% of job postings prioritized verifiable practical skills over traditional university degrees. In the US, 54% of technology decision-makers placed greater weight on professional certifications than degrees, though 35% maintained four-year computer science degree prerequisites.
The Contingent Workforce Mechanics (“Borrowing”)
Randstad noted that 63% of enterprise organizations cite flexible talent arrangements (contractors, freelancers, and managed service providers) as their primary mechanism for acquiring emerging AI capabilities. Furthermore, 92% of organizations utilize digital talent platforms, with 42% designating them as their primary hiring channel.
However, a critical analytical perspective must be maintained: Randstad is a staffing services agency. Identifying contingent labor (“borrowing”) as the optimal enterprise strategy aligns directly with its core commercial business model.
This dynamic is reflected in Randstad’s own Q3 2026 financial report (released October 21, 2026):
- Quarterly Revenue: 6,115 million euros (+5.3% reported, +3.9% organic growth).
- Underlying EBITA: 211 million euros (+10% organic growth; 3.5% margin).
- Internal Workforce: 37,010 full-time equivalents, down 3% organically year-over-year.
- Digital Business Performance: In Randstad Digital, the average time required to fill client roles halved from 26 days to 12 days via automated matching platforms. Yet, organic revenue per working day in Randstad Digital declined by 2% year-over-year.
A surging demand for AI skills does not automatically generate frictionless top-line expansion for staffing intermediaries, nor does it eliminate economic cyclicality.
Analytical Interpretation: Decoupling Execution from Accountability
Synthesizing these primary records suggests an overarching structural thesis: enterprise compensation models are decoupling task execution from professional accountability.

In legacy software workflows, organizations paid software engineers primarily to execute the mechanical translation of specifications into syntax. As AI coding tools accelerate syntax generation, the economic value of raw execution approaches zero.
Consequently, salary premiums do not reward developers simply for typing prompts into an AI assistant. Instead, premiums accrue to engineers who possess the domain expertise, architectural discernment, and regulatory comprehension required to take formal responsibility for AI-generated outputs. When an automated system produces code containing latent concurrency bugs, security vulnerabilities, or compliance failures, the AI tool incurs no liability. The human engineer who evaluated, tested, and signed off on the commit bears full responsibility.
Analytical Limits: What the Evidence Cannot Prove
To prevent organizational missteps, technical leaders must observe strict analytical boundaries.

- Non-Applicability to Japanese Wage Negotiations: Citing Randstad’s 13% or 17% figures as justification for Japanese enterprise compensation adjustments is invalid given differing labor structures and the survey’s 100-person domestic sample.
- No Guaranteed Return on Certifications: The survey measures employer screening preferences; it provides zero statistical proof that acquiring a commercial AI certificate guarantees salary enhancement.
- Barclays Is Not an Industry Census: Barclays’ projected reductions reflect bank-specific capital allocation and European branch rationalization, not an industry-wide collapse of technical employment.
- Staffing Agency Alignment: The preference for contingent talent (“borrowing”) reflects the commercial positioning of the survey author and must be weighed against internal capability building.
Strategic Blueprint: Three Action Mandates for Workforce Leaders
To navigate these labor transitions effectively, enterprise engineering leaders, HR strategists, and technology professionals should execute three practical operating principles.

Mandate 1: Decouple Roles into Execution vs. Accountability
Engineering managers and individual contributors must inventory their monthly responsibilities:
- Isolate Execution Tasks: Identify mechanical activities delegated to AI (boilerplate generation, test stubbing, regex drafting).
- Codify Accountability Gates: Explicitly document who reviews code correctness, verifies data lineage, and takes responsibility for production deployment. Career value resides entirely in the accountability tier.
Mandate 2: Audit Workforce Metrics Across Three Strict Criteria
Whenever confronted with macroeconomic labor statistics, evaluate three structural components:
- The Exact Denominator: What specific cohort is being measured (global survey respondents vs. national census)?
- The Comparator Baseline: What is the reference value against which premiums or growth rates are calculated?
- The Geographic and Legal Context: How do local employment protections, collective bargaining laws, and corporate grading structures alter the metric?
Mandate 3: Move Beyond Binary “Hire vs. Fire” Workforce Planning
Rather than framing AI adoption as an aggressive hiring spree or a broad layoff exercise, organizations must refine job architectures:
- Revise Requisition Profiles: Stop evaluating candidates on algorithmic trivia easily solved by coding models. Test candidates on system architecture, failure-mode analysis, and code auditing.
- Establish Governance Ownership: If engaging contingent talent or external agencies for AI implementation, designate internal senior engineers who maintain long-term architectural custody and regulatory accountability.
Primary Sources and References
- Randstad Global Press Release, “86% of employers are growing tech teams as AI reshapes demand” (October 29, 2026): https://www.randstad.com/press/2026/randstad-tech-talent-report-2026/
- Randstad Research Portal, “Tech Talent Report 2026: Building the AI-Ready Workforce” (October 2026): https://www.randstad.com/tech-talent-report-2026/
- Randstad USA Press Release, “AI Adoption Accelerates Talent Demand with 93% of U.S. Employers Growing Tech Workforce” (October 29, 2026): https://www.randstadusa.com/about/press-room/press-releases/ai-adoption-employers-grow-tech-workforce/
- Randstad N.V., “Q3 2026 Financial Results Press Release” (October 21, 2026): https://www.randstad.com/s3fs-media/rscom/public/2026-10/Q3_2026_Press_Release.pdf
- Randstad N.V., “Q3 2026 Earnings Call Transcript” (October 21, 2026): https://www.randstad.com/s3fs-media/rscom/public/2026-10/Q3_2026_Earnings_Call_Transcript.pdf
- Barclays PLC, “Q3 2026 Results Presentation” (October 22, 2026): https://home.barclays/content/dam/home-barclays/documents/investor-relations/ResultAnnouncements/Q32026Results/Q326-Results-Presentation.pdf
- Barclays PLC, “Q3 2026 Results Management Speech” (October 22, 2026): https://home.barclays/content/dam/home-barclays/documents/investor-relations/ResultAnnouncements/Q32026Results/Q326%20Results%20Call%20Management%20Speech.pdf