How Should Working Professionals Read Roblox's Earnings? ── Dissecting YoY Declines, Bookings Divergence, and U.S.-Only Demographic Estimates
A financial and operational forensic analysis reveals how Roblox’s Q3 2026 metrics show simultaneous growth and contraction depending on period baselines, accounting standards, and geographic cohort definitions.
Published: October 31, 2026 | Read time: ~10 min | Watch Video (Japanese)
Executive Summary: The Relativity of Platform Earnings
When analyzing corporate earnings for digital platforms, executive summaries often present contradictory narratives. An investor reading headlines from Roblox Corporation’s third-quarter 2026 financial results could reasonably conclude that the platform experienced either robust expansion or sharp contraction. Both conclusions can be supported with authentic data points from the company’s regulatory filings.
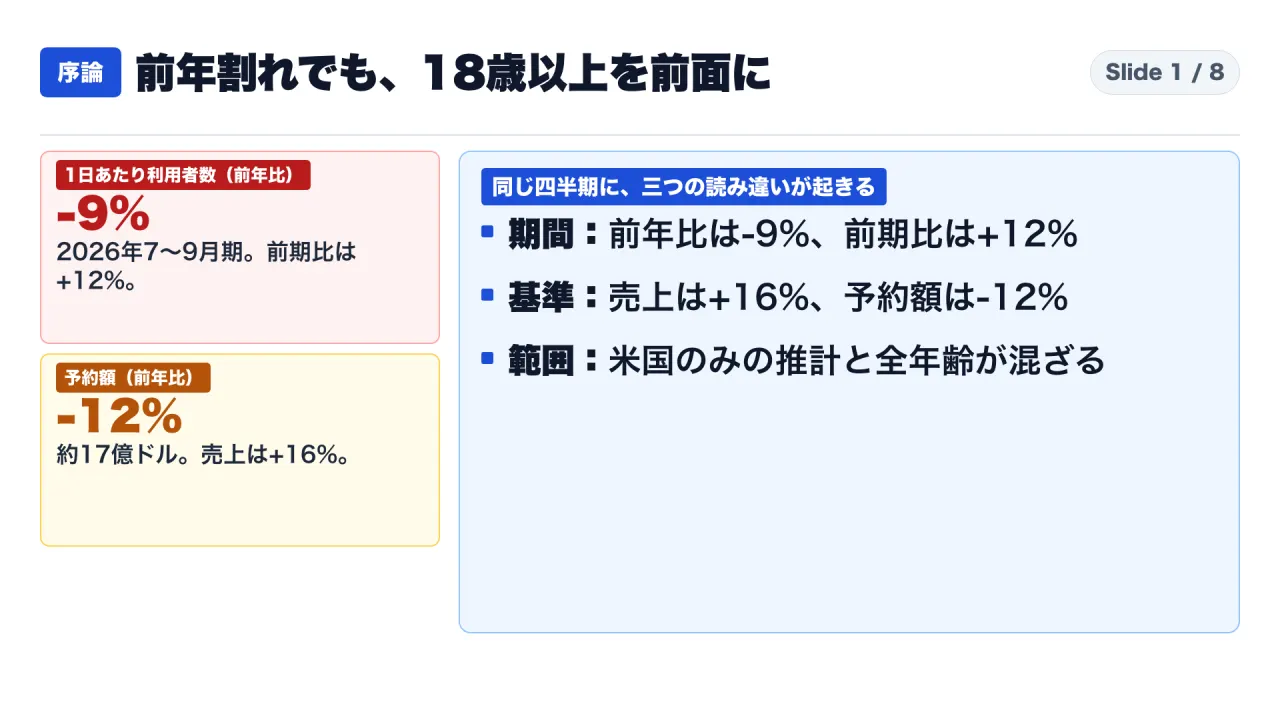
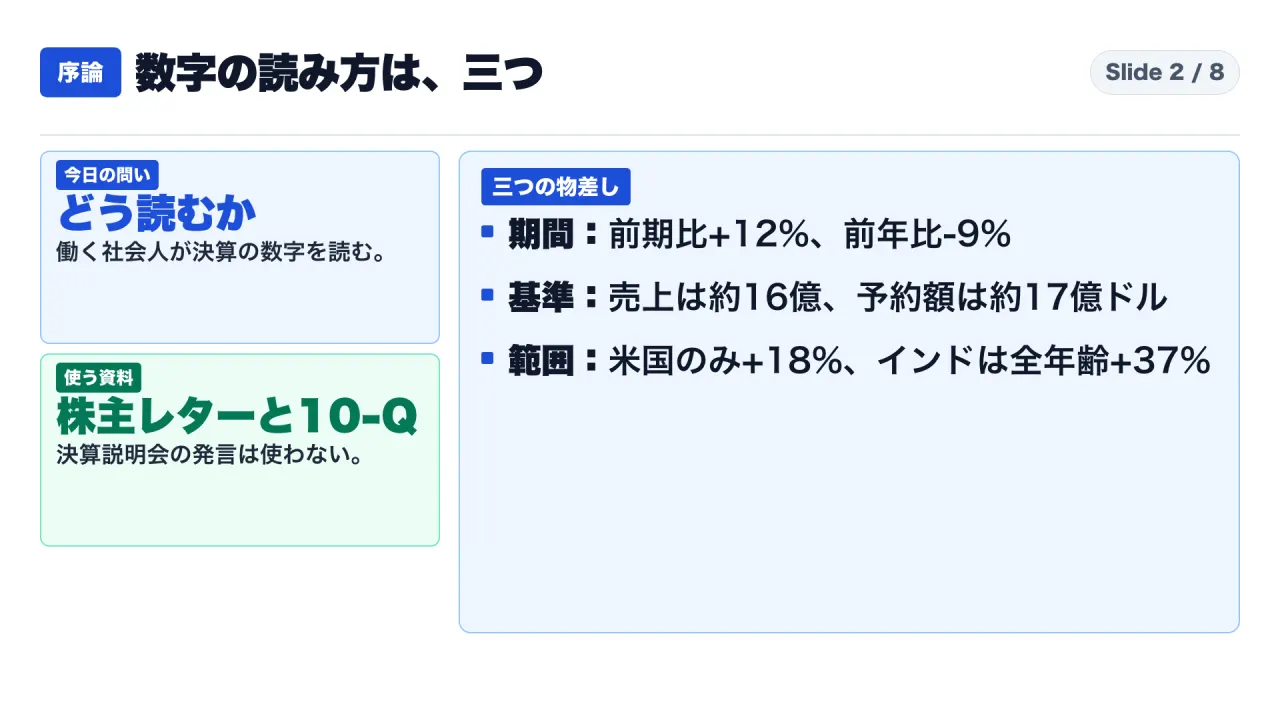
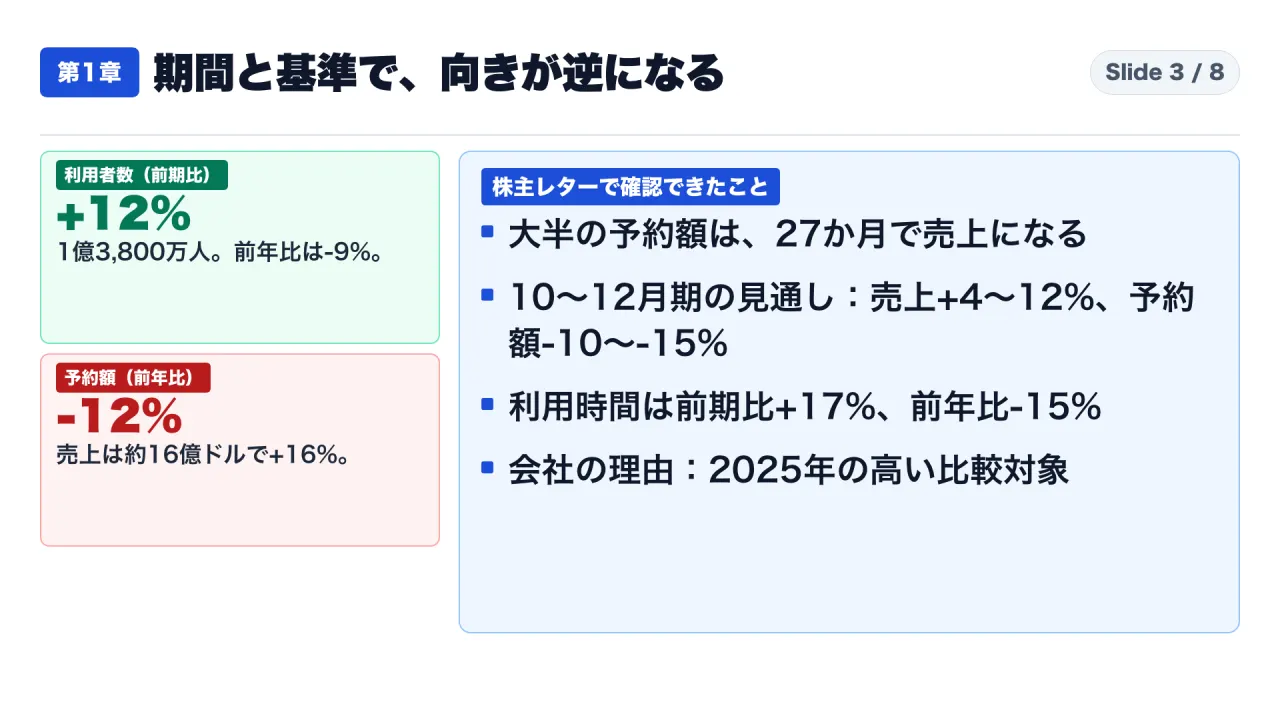
During the third quarter of 2026 (three months ended September 30, 2026), Roblox reported 138 million Daily Active Users (DAUs), representing a 12% increase compared to the prior quarter, but a 9% decline compared to the third quarter of 2025. Concurrently, GAAP revenue grew 16% year-over-year to approximately $1.6 billion, while Non-GAAP Bookings dropped 12% to approximately $1.7 billion.
Furthermore, while corporate communications heavily emphasized an 18% surge in users aged 18 and older alongside claims that mature users monetize at a 50% premium, primary footnotes reveal that these specific figures are modeled statistical estimates restricted strictly to the United States. Conversely, reported growth in international markets—such as a 33% increase in Japan and 37% in India—reflects all-ages user counts rather than adult adoption.
This analysis evaluates three primary corporate filings submitted to the SEC:
- Roblox Shareholder Letter (Exhibit 99.1 to Form 8-K, October 29, 2026).
- Roblox Form 10-Q (Quarterly Report for the period ended September 30, 2026).
- Roblox Form 8-K Item 2.02 earnings release (October 29, 2026).
To establish analytical clarity, this investigation isolates three methodological parameters:
- Baseline Period: Year-over-Year (YoY) vs. Quarter-over-Quarter (QoQ) vs. Two-Year Cumulative.
- Accounting Standard: GAAP Revenue vs. Non-GAAP Bookings.
- Demographic Scope: Global Verified Users vs. U.S. Modeled Extrapolations vs. All-Ages Totals.
Technical Baseline: Accounting Definitions and Platform Metrics
Evaluating Roblox’s earnings requires understanding the platform’s non-standard operational metrics:
- Daily Active Users (DAUs): Form 10-Q defines a DAU as an individual user who logs in and visits Roblox on a unique registered account on a given calendar day. Because this measures unique accounts rather than verified biological persons, individuals operating multiple accounts can influence this aggregate.
- Hours Engaged: Total aggregate session durations recorded across the platform, estimated via internal telemetry.
- Bookings (Non-GAAP): Measures economic sales activity within a given period without certain non-cash GAAP adjustments. Bookings primarily reflect sales of virtual currency (Robux) and prepaid digital gift cards.
- GAAP Revenue: Recognized ratably over the estimated average lifetime of paying users (modeled at 27 months for durable virtual goods).
- Change in Deferred Revenue: The net change in cash collected from virtual currency sales that has not yet been recognized as GAAP revenue. This component accounts for the mathematical variance between Bookings and Revenue.
- Age-Verification Cohort: Commencing in early 2026, Roblox transitioned demographic tracking from unverified self-reported birthdates to an age-verified framework based on government ID and facial biometric models.
Section 1: Growth vs. Contraction: The Divergence Between Revenue and Bookings
In the third quarter of 2026, headline performance metrics exhibited sharp opposing trajectories depending on the comparative baseline:
| Platform Metric | Q3 2026 Stated Value | Comparative Period Baseline | Context and Direction |
|---|---|---|---|
| Daily Active Users (DAUs) | 138 million | +12% vs. Q2 2026 (QoQ) / -9% vs. Q3 2025 (YoY) | +55% vs. Q3 2024 (2-Year) |
| Hours Engaged | ~34 billion hours | +17% vs. Q2 2026 (QoQ) / -15% vs. Q3 2025 (YoY) | +63% vs. Q3 2024 (2-Year) |
| GAAP Revenue | ~$1.6 billion ($1,572M) | +16% vs. Q3 2025 (YoY) | Derived from prior deferred revenue |
| Non-GAAP Bookings | ~$1.7 billion ($1,697M) | -12% vs. Q3 2025 (YoY) | Exceeded upper guidance ceiling |
| Monthly Unique Payers | 30 million | -16% vs. Q3 2025 (YoY) | Average Bookings per Payer +5% YoY |
Roblox management attributed year-over-year declines in DAUs, engagement, and Bookings to difficult comparisons against an exceptionally strong third quarter in 2025.
Mathematical Reconciliation: Revenue vs. Bookings
The reconciliation schedule provided in the Shareholder Letter details the mathematical bridge connecting GAAP revenue to Non-GAAP Bookings (in millions of dollars):
| Reporting Period | GAAP Revenue | Change in Deferred Revenue | Other Adjustments | Non-GAAP Bookings |
|---|---|---|---|---|
| Q3 2026 (3 Months) | $1,572M | $136M | -$11M | $1,697M |
| Q3 2025 (3 Months) | $1,360M | $573M | -$11M | $1,922M |
| 9-Month Cumulative 2026 | $4,483M | $534M | -$32M | $4,985M |
| 9-Month Cumulative 2025 | $3,476M | $1,116M | -$25M | $4,567M |
This financial bridge reveals two vital dynamics:
- The Source of the Bookings Contraction: While GAAP revenue expanded by $212 million year-over-year, the quarterly addition to deferred revenue plummeted from $573 million in Q3 2025 to $136 million in Q3 2026. Because bookings represent current cash sales, this deceleration drove the 12% decline.
- The 3-Month vs. 9-Month Paradox: While quarterly bookings contracted by 12%, nine-month cumulative bookings rose 9% (from $4,567 million to $4,985 million), and nine-month GAAP revenue surged 29% (from $3,476 million to $4,483 million). Evaluating a company solely across three months versus nine months completely reverses the trajectory of growth.
Q4 2026 Financial Guidance
For the fourth quarter of 2026, Roblox forecasted:
- GAAP Revenue: $1,470 million to $1,580 million (+4% to +12% YoY)
- Non-GAAP Bookings: $1,890 million to $2,000 million (-10% to -15% YoY)
- Free Cash Flow: Outflow between $(190) million and $(105) million, compared to positive free cash flow of $364 million in Q3 2026.
This pattern demonstrates the lagged mechanics of platform accounting: revenue expands as previous bookings amortize over 27 months, even as current sales contract.
Section 2: Demographic Dissection: U.S. Estimates vs. International Totals
Global Age Verification Baselines
Roblox highlighted mature users as its fastest-growing demographic. However, the denominator governing these figures requires scrutiny:
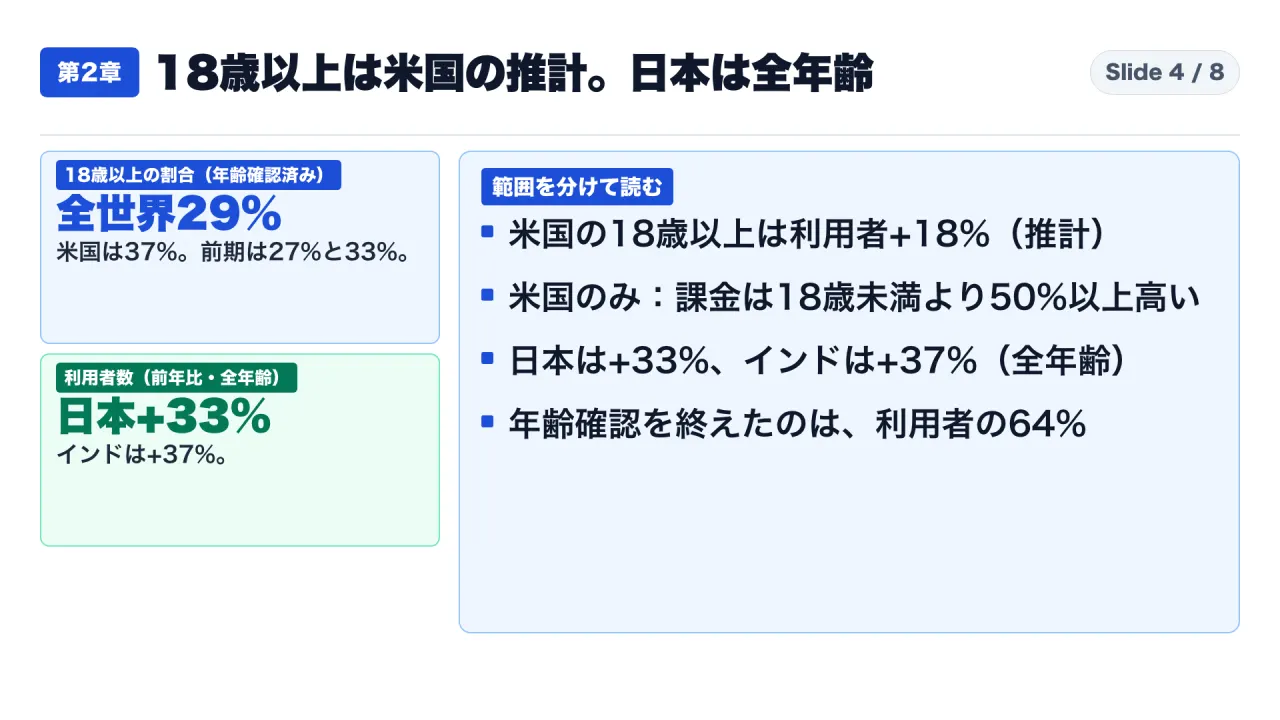
- Globally, users aged 18 and older accounted for 29% of age-verified DAUs in Q3 2026 (up from 27% in Q2). In the United States, 18+ represented 37% of age-verified DAUs (up from 33% in Q2).
- Crucially, only 64% of global DAUs are age-verified. Verification penetration stands at 80% in Australia, 75% in the U.S., and 75% in the UK.
- Across the global verified population over the trailing seven days, 29% were aged 18+, 37% were aged 13-17, and 34% were under 13. Combined, users under 18 still represent 71% of all verified active players.
The “18% Growth” Figure Is a U.S. Estimate
Corporate presentations emphasized an 18% growth rate in adult players. Regulatory footnotes reveal that this metric is neither global nor an empirical count:
- The 18% YoY growth in DAUs and 13% YoY growth in hours engaged applies strictly to the United States.
- Among U.S. users aged 18 to 34, DAUs grew 26% and hours grew 23%.
- Footnotes in the Shareholder Letter explicitly caution that demographic percentages are modeled estimates. Roblox extrapolated the verified 75% cohort across the remaining 25% unverified U.S. user base, acknowledging that unverified behavior may diverge from verified samples.
The 50% Monetization Premium and Creator Subsidies
Roblox asserted that U.S. users aged 18+ monetize at a rate more than 50% higher than users under 18. To stimulate mature content, Roblox instituted aggressive subsidies:
- Commencing June 8, 2026, the company increased creator payout rates by 42% on spending by verified U.S. users aged 18+.
- Marketing expenditures targeting the 18+ cohort increased roughly threefold compared to Q3 2025.
- Consequently, Developer Exchange (DevEx) fees rose to 24% of Bookings (up from 22% in Q3 2025), illustrating that pursuing older demographics carries significant margin pressure.
International Expansions Reflect All-Ages Totals
Roblox reported rapid international user expansion:
- Japan DAUs grew 33% YoY (hours engaged grew 22%).
- India DAUs grew 37% YoY (hours engaged grew 28%).
- Saudi Arabia DAUs grew 30%, France 12%, and Germany 13%.
These figures represent all-ages user totals, not adult cohorts. Form 10-Q and the Shareholder Letter disclose zero revenue figures or adult demographic breakdowns for Japan or India. Furthermore, Roblox noted that outside the U.S., daily user penetration remains below 2% of the population.
Section 3: AI Development and Platform Economies
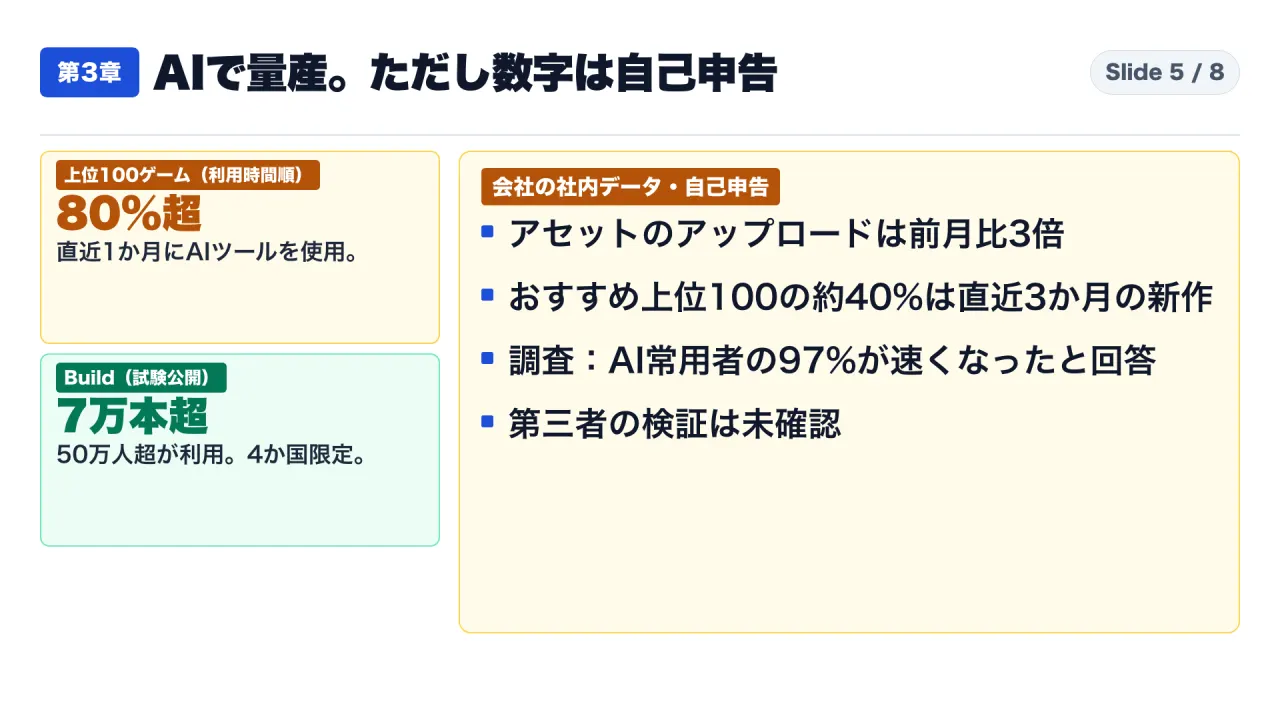
Roblox reported that AI-assisted content creation reached an inflection point across the platform:
| Disclosed AI Metric | Stated Baseline and Scope | Evidentiary Character |
|---|---|---|
| >80% of top 100 experiences used AI | Top 100 experiences by hours engaged (past month) | Internal platform telemetry |
| 3x surge in daily asset uploads | Month-over-month daily upload velocity | Internal platform telemetry |
| 3x increase in creator AI usage hours | Top-tier creators since Q2 2026 | Internal platform telemetry |
| ~5x increase in daily active MCP users | Model Context Protocol server integrations | Internal platform telemetry |
| >50% increase in AI-published games | Quarter-over-quarter expansion | Internal platform telemetry |
| >500,000 Build tool creators | Conversational AI generation; >70,000 published | Self-reported company metrics |
| 75% of Build users new to 3D engines | Creators lacking prior Roblox Studio experience | Self-reported company metrics |
| 97% report faster development | Survey of creators who daily use AI tools | Internal creator survey |
| ~40% of recommended top 100 are new | Experiences under 3 months old in top impressions | Internal platform telemetry |
These operational metrics derive from internal telemetry rather than independent audits. Furthermore, the 97% efficiency finding reflects a sample composed strictly of active daily AI users. While two experiences developed almost entirely via AI reached the top 20 concurrent player rankings, Roblox did not assert this was the first occurrence in platform history.
Engagement remains heavily concentrated: Form 10-Q notes that in December 2025, the top 50 experiences captured 51% of total engagement hours. AI infrastructure also expanded expenses: Infrastructure and Trust & Safety outlays grew 24% YoY to $258 million, driven by machine learning training and inference costs, with proprietary on-premise models processing 77% of AI requests.
Section 4: Author Commentary, Analytical Caveats, and Invariant Boundaries
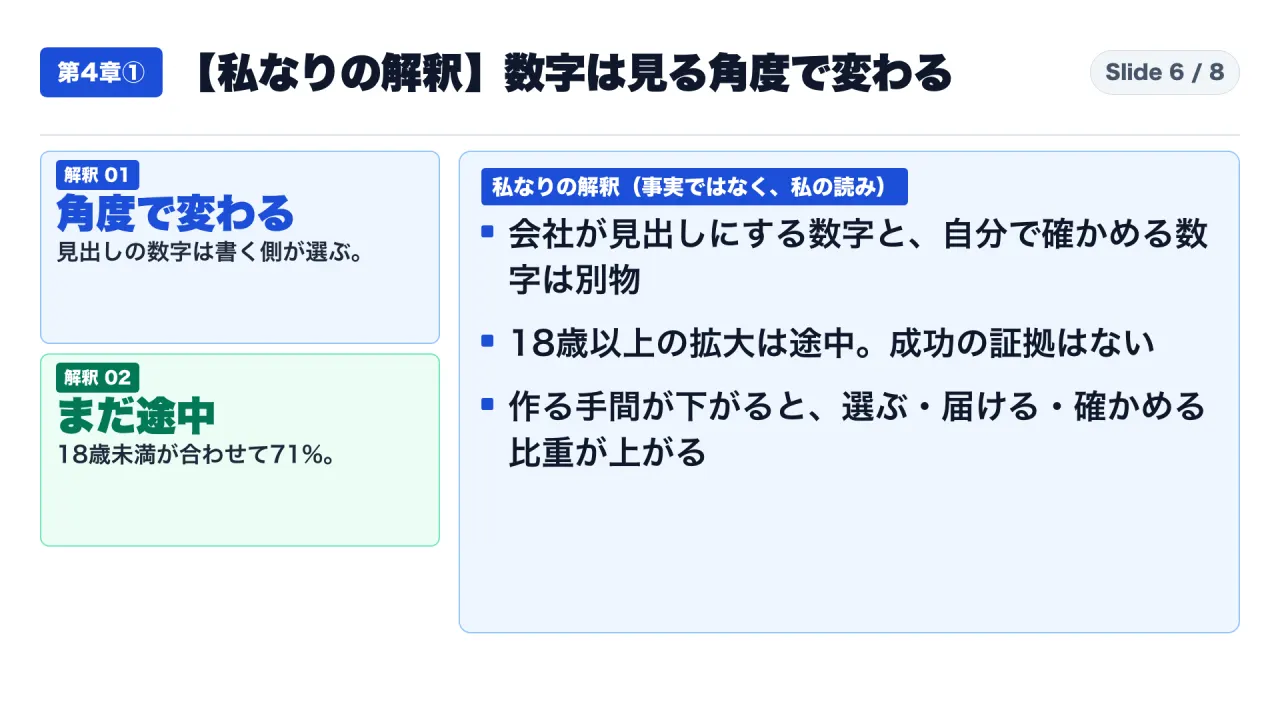
Three professional interpretations:
- Corporate Framing Selects Favorable Horizons: Highlighting 55% two-year growth or 12% quarterly rebounds distracts from a 9% annual user drop and 12% bookings contraction.
- Demographic Transition Is Early: With 71% of verified users remaining under 18, Roblox remains fundamentally a youth platform.
- AI Proliferation Increases Discovery Overhead: As procedural content floods the platform, discovery curation and distribution become the primary bottleneck.
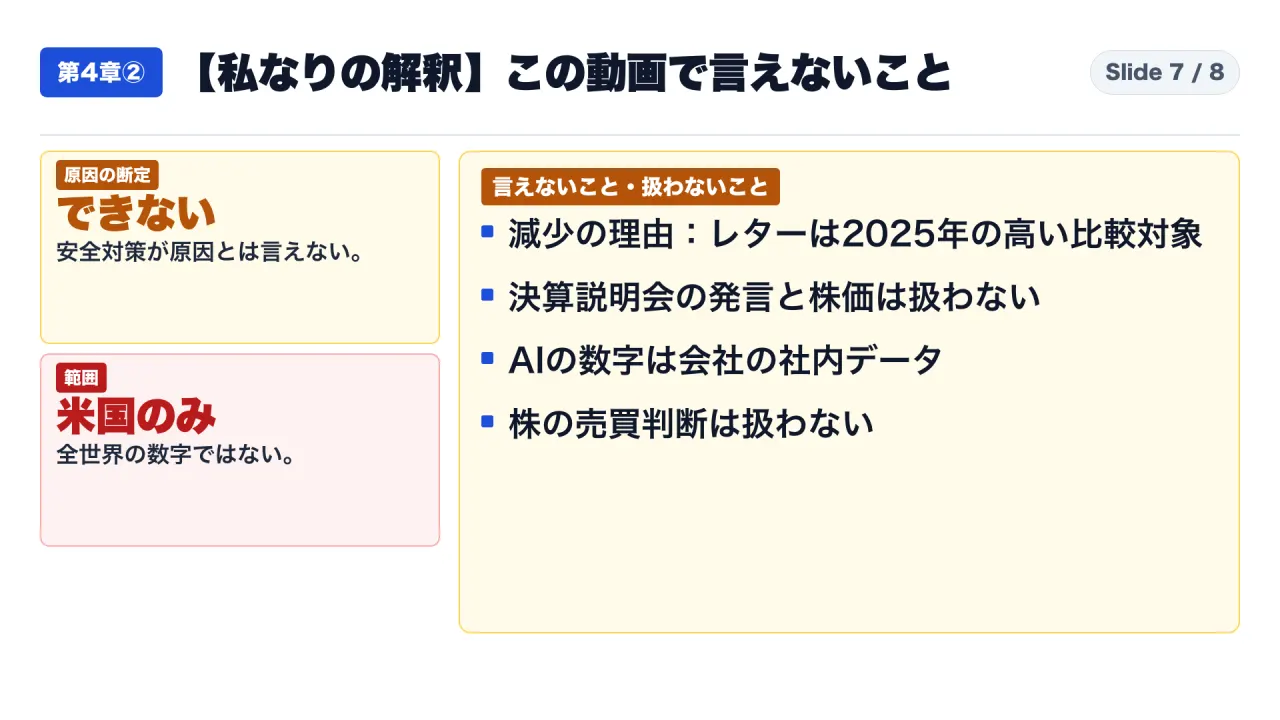
Seven invariant regulatory boundaries:
- User declines cannot be definitively linked to safety regulations; management attributed declines to difficult 2025 comparisons.
- The 18% growth rate applies strictly to modeled U.S. estimates.
- Adult monetization premiums cannot be generalized outside the U.S.
- Japan and India figures represent all-ages totals; regional revenue is undisclosed.
- AI tool metrics represent unverified internal telemetry.
- Earnings call commentary was unreviewed; only written SEC filings are analyzed.
- This study evaluates corporate accounting governance only, providing no investment advice.
Practical Playbook for Evaluating Platform Operating Metrics
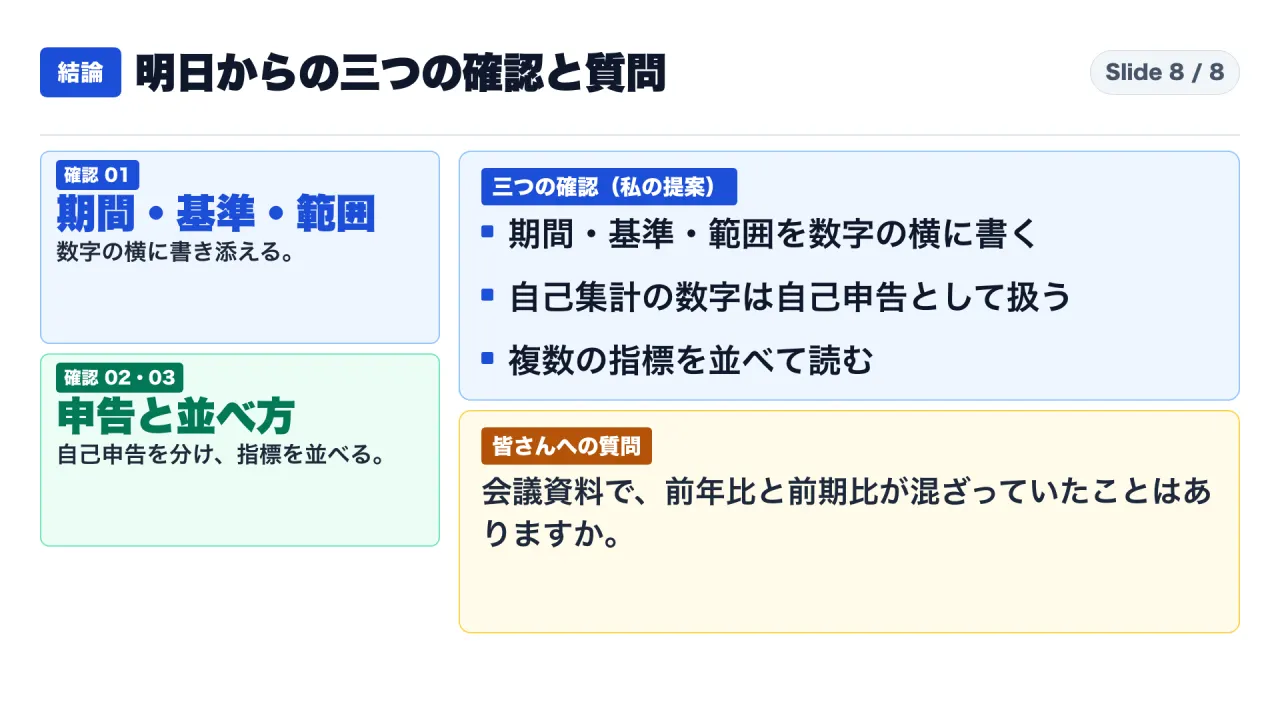
Professionals citing earnings metrics in corporate presentations should apply a three-step review.
Step 1: Enforce Triple-Axis Contextual Annotation
Never present an isolated figure without specifying three parameters:
- Time Baseline: Clarify whether a growth rate is YoY, QoQ, or multi-year cumulative.
- Accounting Metric: Differentiate GAAP Revenue from Non-GAAP Bookings.
- Demographic & Geographic Scope: Differentiate global figures from single-country estimates.
| Misleading Executive Shorthand | Contextually Accurate Reporting |
|---|---|
| “Roblox active users declined 9%” | “Roblox Q3 2026 DAUs declined 9% YoY, but grew 12% QoQ to 138 million.” |
| “Roblox generated $1.7 billion in revenue” | “Roblox recorded $1.7 billion in Bookings (-12% YoY) and $1.6 billion in GAAP Revenue (+16% YoY).” |
| “Adult users expanded by 18%” | “U.S. daily active users aged 18+ grew 18% YoY based on modeled estimates.” |
| “Japan expanded 33% due to adult users” | “Japan DAUs grew 33% YoY across all age groups combined; adult breakdowns are undisclosed.” |
Step 2: Classify Telemetry as Self-Reported Corporate Data
Verify the provenance of operational claims. If a metric derives from internal server logs or surveys (such as AI adoption percentages), explicitly designate it as self-reported company data.
Step 3: Construct Multi-Metric Dashboards
Avoid summarizing platform health with a single metric. Require presentations to display user counts, engagement hours, Bookings, and operating cash flows side-by-side.
Frequently Asked Questions
Q1: Did Roblox’s daily active user base expand or contract in Q3 2026?
Both descriptions are factually accurate depending on baseline: DAUs contracted 9% compared to Q3 2025, but expanded 12% compared to Q2 2026, and grew 55% compared to Q3 2024.
Q2: Why did GAAP revenue increase while Bookings declined?
GAAP revenue recognizes virtual currency sales ratably over an estimated 27-month user lifecycle, reflecting prior strong bookings, whereas Bookings measures current sales, which contracted 12% YoY as deferred revenue additions slowed.
Q3: Is the 18% growth rate in 18+ users an empirical global figure?
No. The 18% figure applies strictly to modeled estimates for the United States, derived by extrapolating the verified 75% user sample across unverified users.
Q4: Did adult players drive the 33% user growth in Japan?
Filings do not support this. The 33% growth in Japan reflects total all-ages daily active users; Roblox provides zero demographic age breakdowns for Japan.
Q5: Did increased child safety regulations cause the annual user drop?
Filings do not establish causality. While Form 10-Q notes global compliance actions, management attributed the user drop to tough prior-year comparisons.