"Over 3,000 Tokens per Second": Decoding Benchmark Numbers and Shared Memory Architecture in the HP ZGX Fury
A critical reading of sponsored benchmark claims versus official specifications reveals why aggregate throughput does not equal single-user speed and how two-tier memory hierarchies constrain multi-tenant LLM performance.
Published: October 31, 2026 | Read time: ~10 min | Watch Video (Japanese)
Executive Summary: Slogans versus Production Realities
In late October 2026, an overseas technology review covering HP’s enterprise AI workstation, the ZGX Fury, sparked discussion by reporting inference speeds exceeding “3,000 tokens per second.” For IT directors, DX leaders, and infrastructure managers evaluating on-premises large language model (LLM) hardware, such figures suggest performance capable of serving large teams.
However, examining the video transcript alongside official specifications from HP and NVIDIA reveals a fundamental operational disconnect:
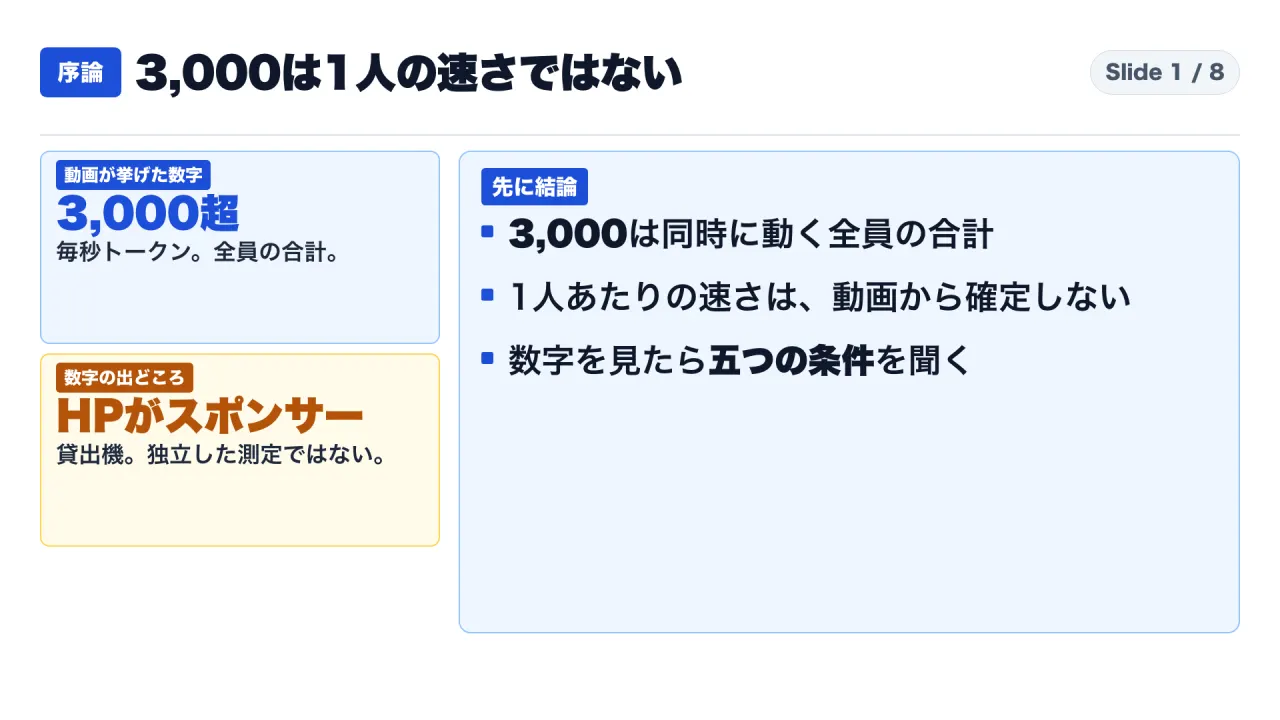
- The cited 3,000 tokens per second was explicitly characterized as an aggregate throughput metric combining multiple concurrent execution threads, not single-user speed.
- The disclosure originated from a single video whose creator disclosed HP sponsorship and a vendor loaner unit, rather than an independent laboratory audit.
- The demonstration omitted essential testing parameters: model architecture, quantization precision, prompt token length, and completion token length were not specified.
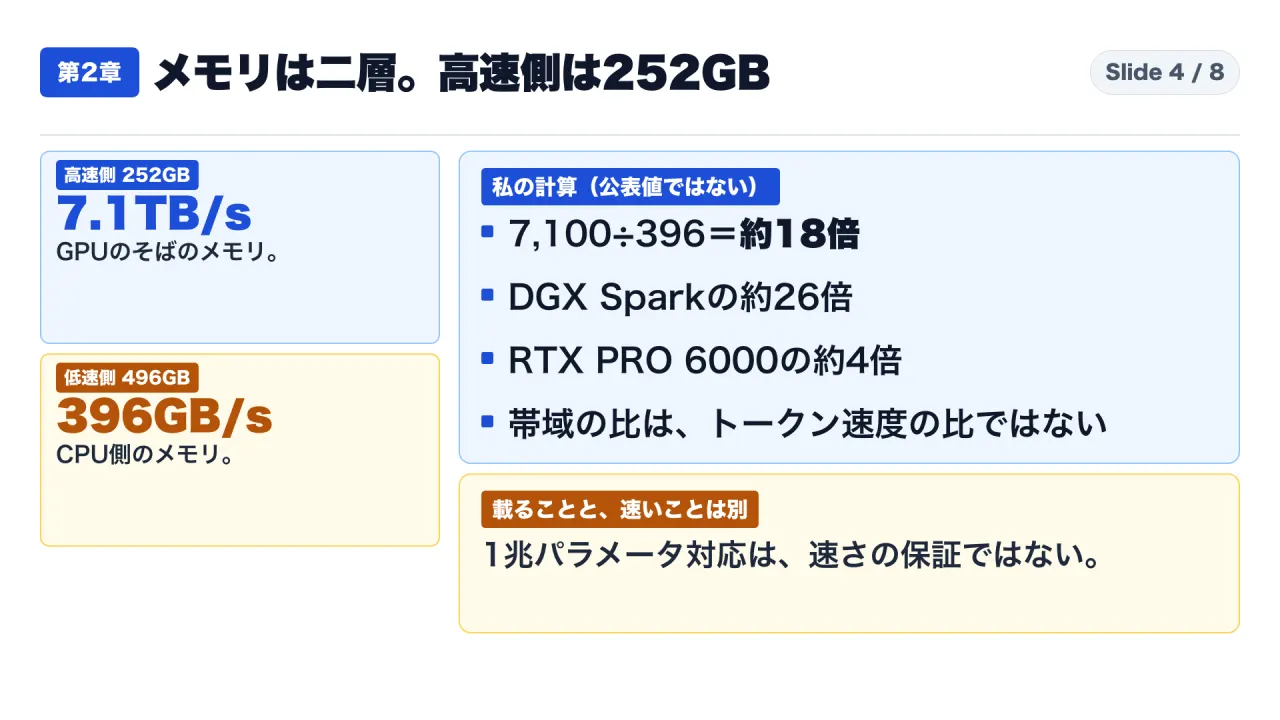
- The ZGX Fury relies on a two-tier memory hierarchy: 252 GB of HBM3e at 7.1 TB/s paired with 496 GB of LPDDR5X at 396 GB/s—an approximate 18-fold bandwidth disparity within the same coherent memory address space.
While HP officially states that the machine supports inference for models up to one trillion parameters, memory residency does not guarantee interactive generation speeds once model weights exceed the fast HBM3e partition.
This briefing analyzes the mechanics of multi-tenant LLM throughput, breaks down physical hardware specifications of the HP ZGX Fury and NVIDIA DGX Station platforms, and provides a five-point inquiry framework for enterprise procurement teams.
Analytical Methodology and Evidentiary Standards
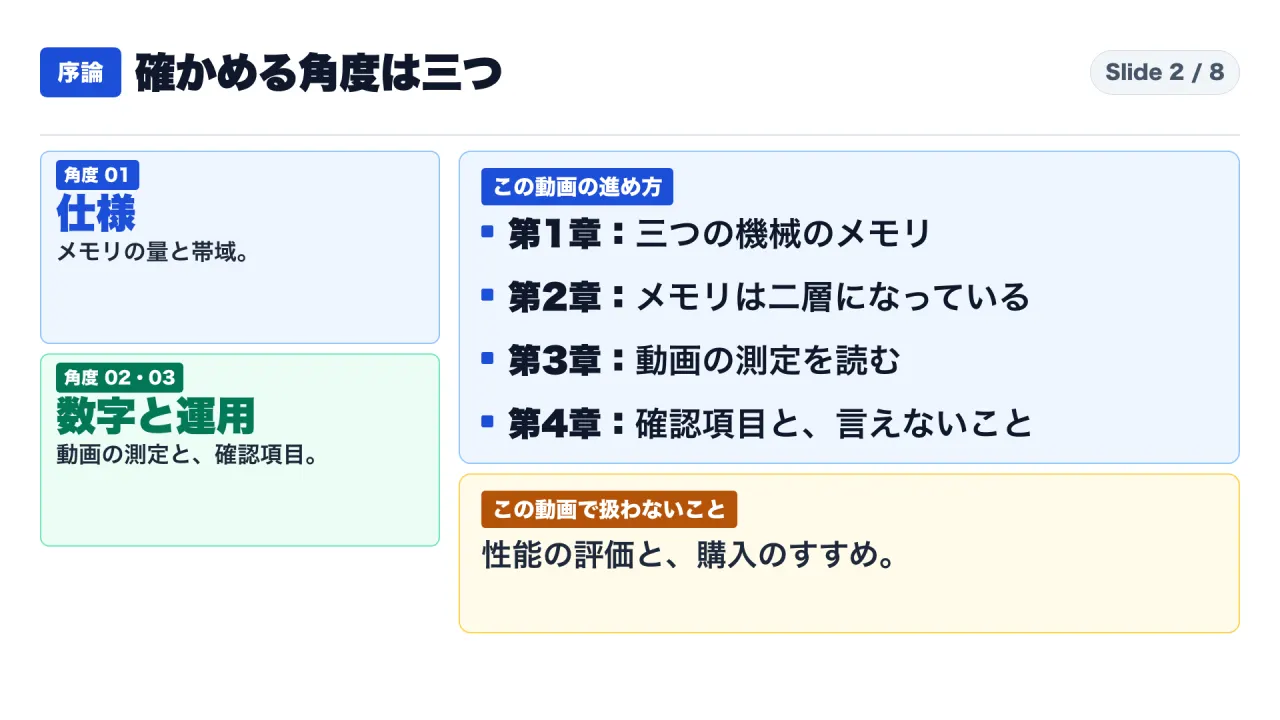
This analysis maintains strict boundaries across four data categories:
- Documented Fact: Specifications and statements extracted directly from official product documentation from HP Japan, HP Inc., and NVIDIA Corporation.
- Video Statements: Verbatim claims extracted from the transcript of the sponsored review video published on October 30, 2026.
- Author Calculations: Mathematical derivations (bandwidth ratios, per-user throughput estimates, and unit conversions) computed from published numbers.
- Interpretive Analysis: Systems architecture deductions, queue evaluations, and operational procurement recommendations.
Hardware specifications were cross-referenced against technical tables from HP and NVIDIA. Transcript citations reflect spoken English statements. The author did not operate physical evaluation units; this brief evaluates claims against documented architectural principles.
Section 1: The Memory Architecture Spectrum
To evaluate the ZGX Fury, its physical memory specifications must be positioned alongside adjacent enterprise workstation hardware.
Official Hardware Specifications
Published specifications establish distinct capacity and bandwidth tiers:
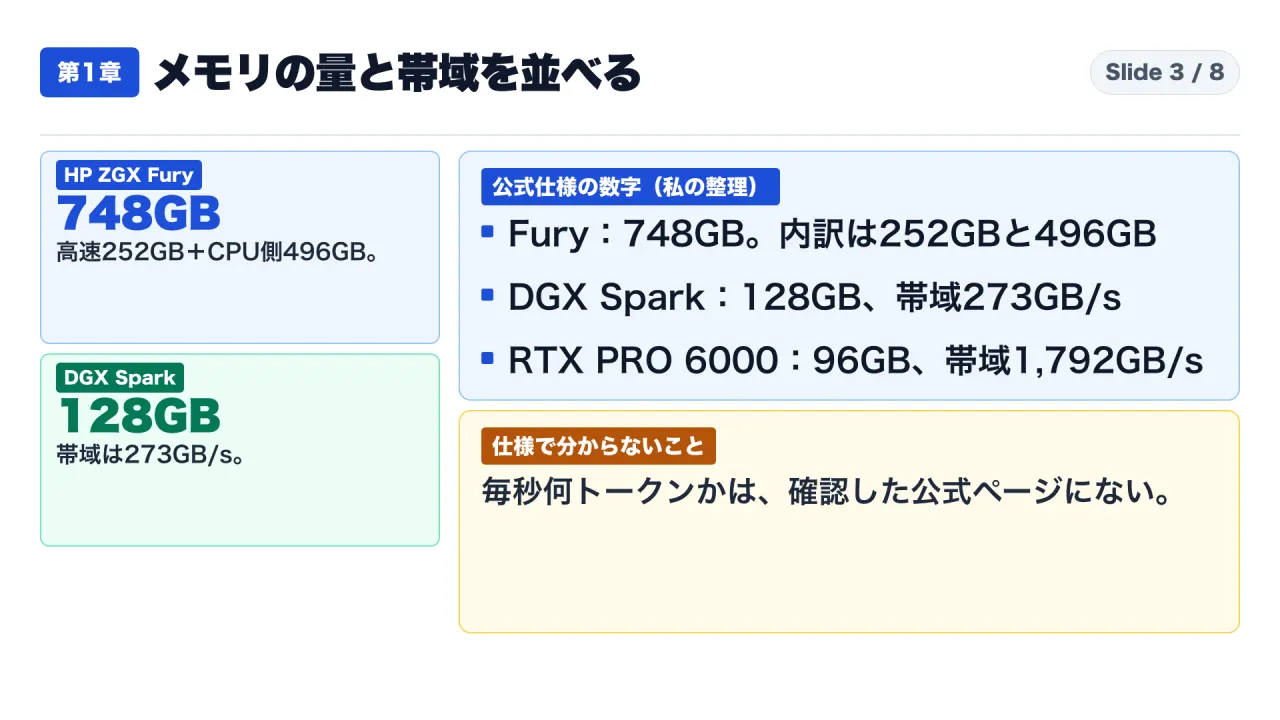
- NVIDIA DGX Spark: Configured with 128 GB of unified memory delivering 273 GB/s bandwidth.
- HP ZGX Nano: Built on the NVIDIA GB10 processor, providing 128 GB of unified memory.
- NVIDIA RTX PRO 6000 Blackwell Workstation Edition: A discrete PCIe workstation GPU equipped with 96 GB of GDDR7 memory delivering 1,792 GB/s bandwidth with a 600W maximum thermal design power (TDP).
- HP ZGX Fury (and NVIDIA DGX Station): Declared as featuring 748 GB of coherent system memory, comprising 252 GB of HBM3e on the GPU package and 496 GB of LPDDR5X on the CPU host architecture.
| Hardware Platform | Memory Capacity | Memory Bandwidth | Primary Source |
|---|---|---|---|
| HP ZGX Fury / DGX Station | 748 GB (252 GB HBM3e + 496 GB LPDDR5X) | 7.1 TB/s (HBM3e) / 396 GB/s (LPDDR5X) | HP Japan & NVIDIA Specs |
| NVIDIA DGX Spark | 128 GB Unified | 273 GB/s | NVIDIA Product Docs |
| HP ZGX Nano | 128 GB Unified (GB10) | Unspecified in brief | HP Announcement |
| NVIDIA RTX PRO 6000 Blackwell | 96 GB GDDR7 | 1,792 GB/s (TDP 600W) | NVIDIA Tech Specs |
In automotive engineering, cargo volume and top speed are measured independently; cargo capacity does not determine acceleration. Similarly, in LLM inference, memory capacity determines loadable model size, while memory bandwidth dictates token generation latency.
Section 2: The Two-Tier Asymmetric Memory Hierarchy
The defining characteristic of the HP ZGX Fury is the performance divergence between its two memory tiers.
The 18-Fold Bandwidth Disparity
According to technical specifications published by NVIDIA for the underlying DGX Station platform:
- The GPU-attached pool comprises 252 GB of HBM3e delivering 7.1 TB/s (7,100 GB/s) bandwidth.
- The CPU-attached host pool comprises 496 GB of LPDDR5X delivering 396 GB/s bandwidth.
Computing the ratio between these pools reveals that the HBM3e tier provides approximately 17.9 times the bandwidth of the LPDDR5X tier:
7,100 GB/s / 396 GB/s = 17.93x (approximately 18x)
Comparing the ZGX Fury’s HBM3e pool against adjacent platforms shows:
- Compared to the DGX Spark (273 GB/s), the 7,100 GB/s HBM3e pool offers approximately 26.0 times higher bandwidth (7,100 / 273 = 26.01x).
- Compared to the discrete RTX PRO 6000 Blackwell (1,792 GB/s), the HBM3e pool provides approximately 4.0 times higher bandwidth (7,100 / 1,792 = 3.96x).
Model Residency versus Inference Latency
HP states that the ZGX Fury supports inference for models up to one trillion parameters, supporting concurrent multi-user workloads dependent on model size.
However, memory residency must not be confused with sustained generation speed. When a model fits within the 252 GB HBM3e partition (such as quantized 70B models), weight streaming operates at 7.1 TB/s. When a model spills into the 496 GB LPDDR5X pool, memory access is throttled by the 396 GB/s channel. Neither HP nor NVIDIA publish token generation benchmarks for workloads distributed across this hybrid memory boundary.
Additionally, NVIDIA notes in its documentation that published Tensor Core throughput figures assume structured matrix sparsity unless noted otherwise.
Section 3: Deconstructing the “3,000 Tokens per Second” Benchmark
Analyzing the claims made in the October 30, 2026 video review highlights the distinction between aggregate platform capacity and individual response latency.
The Evidentiary Context of the Video
At timestamps 0:44 through 1:01, the reviewer explicitly confirms vendor sponsorship:
“HP sponsored this video and provided a loaner unit.”
While sponsorship does not invalidate observations, it establishes that data reflects an optimized vendor demonstration rather than an independent audit.
Three Conflicting Performance Claims
The video presents three performance claims without reconciling their test conditions:
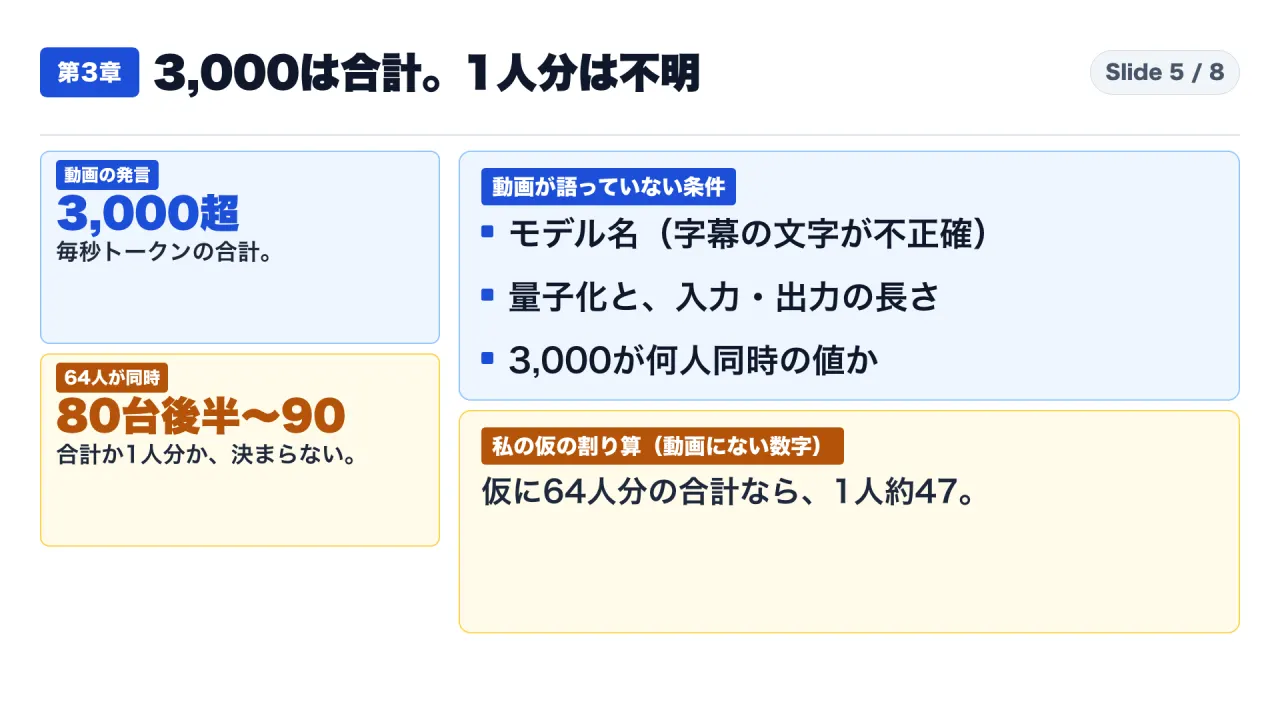
- Aggregate Peak Throughput (7:05–7:10): The presenter states total throughput exceeds “3,000 tokens per second in aggregate.” The words “in aggregate” confirm this represents the sum of multiple parallel generation streams.
- 16-User Concurrency (7:11–7:20): In a test simulating 16 simultaneous requests, the presenter notes performance remained “well over 1,300 tokens per second.” The transcript does not clarify whether this is cumulative aggregate throughput or a composite average.
- 64-User Concurrency (7:28–8:02): Under an intensive test with 64 concurrent streams, the presenter states that once generation begins, the system sustains “high 80s to 90 tokens per second.”
Mathematical Scrutiny of the 64-User Benchmark
The phrase “high 80s to 90 tokens per second” creates an irreconcilable mathematical ambiguity:
- Hypothesis A: 90 Tokens/Sec is Per-User Throughput: If each of 64 concurrent sessions receives 90 tokens/sec, total system throughput equals 5,760 tokens per second (64 x 90 = 5,760). This represents a completely different performance regime, nearly double the 3,000 aggregate figure cited earlier.
- Hypothesis B: 90 Tokens/Sec is Aggregate System Throughput: If 90 tokens/sec represents total cumulative throughput divided across 64 requests, each user receives 1.4 tokens per second (90 / 64 = 1.41). At 1.4 tokens/sec, interactive generation becomes unusable.
Similarly, assuming the 3,000 tokens/sec figure was achieved across 64 users yields approximately 46.9 tokens per second per user (3,000 / 64 = 46.88). However, the video never specifies how many concurrent streams produced the 3,000 token measurement.
The Mechanics of Multi-Tenant Batching
The relationship between aggregate capacity and user latency can be illustrated with a simplified model:
- Consider a shared LLM server delivering an aggregate throughput of 600 tokens per second.
- If 5 users query the server simultaneously, each receives 120 tokens per second (600 / 5).
- If 20 users query simultaneously, generation drops to 30 tokens per second (600 / 20).
- If 60 users query simultaneously, generation slows to 10 tokens per second (600 / 60).
While total system workload remains constant at 600 tokens/sec, individual response latency degrades by a factor of twelve as concurrency increases. Shared inference servers can produce impressive headline numbers under deep batching, but interactive productivity depends strictly on total throughput divided by active concurrency.
Missing Testing Parameters
The video transcript omitted four essential parameters:
- Model Architecture: The model name was garbled in spoken delivery and absent from subtitles.
- Quantization Format: Whether weights were loaded in FP16, BF16, INT8, or 4-bit precision was undisclosed.
- Prompt (Prefill) Length: The number of input context tokens processed prior to generation was unstated.
- Completion (Decode) Length: The length of generated output tokens was unstated.
Without identical model weights, context windows, and quantization precision, comparing inference numbers across systems is technically meaningless.
Section 4: Enterprise Deployment Considerations
Beyond computational throughput, deploying on-premises AI workstations requires evaluating electrical, thermal, software, and financial parameters.
Power, OS, and Form Factor
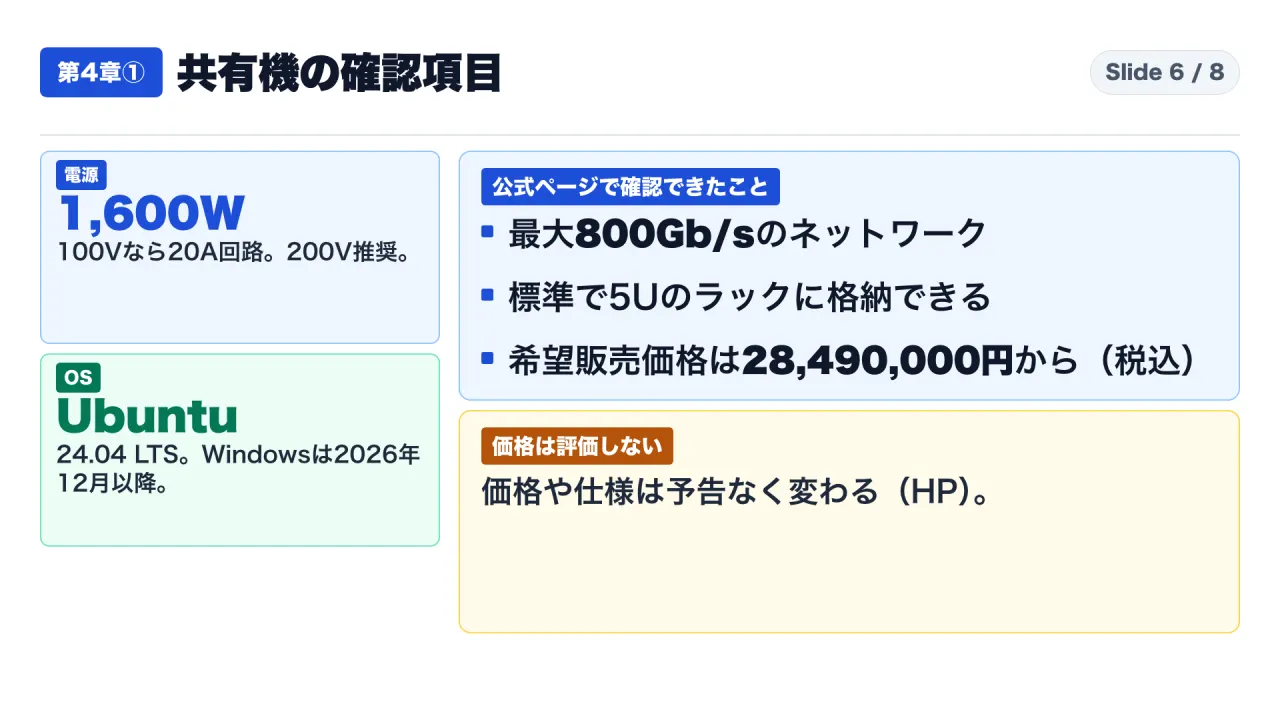
- Power Infrastructure: Official documentation confirms a 1,600W power supply unit. In 100V electrical environments (such as Japan), standard 15A circuits cannot support the unit at peak load. HP specifies a dedicated 20A circuit and officially recommends deployment on 200V commercial power infrastructure.
- Operating System Support: The system ships with Ubuntu 24.04 LTS. Microsoft Windows support is planned starting in December 2026.
- Physical Rack Integration: The workstation occupies 5U of rack height.
- High-Speed Interconnect: Network connectivity is powered by an NVIDIA ConnectX-8 SuperNIC providing up to 800 Gb/s aggregate bandwidth via dual QSFP112 ports (400 Gb/s each).
- Software Management Interface: HP bundles an OpenAI-compatible API endpoint alongside an integrated Baseboard Management Controller (BMC) supporting the Redfish API.
Commercial Pricing
According to the news release published by HP Japan on October 26, 2026, the suggested retail price for the HP ZGX Fury begins at 28,490,000 JPY (tax inclusive), with sales commencing on October 27, 2026. Enterprise procurement teams must evaluate this capital expenditure against ongoing cloud API consumption and operational hosting costs.
Technical Synthesis: What the Documentation Cannot Assert
To maintain analytical integrity, infrastructure leaders must understand what official sources leave unconfirmed:
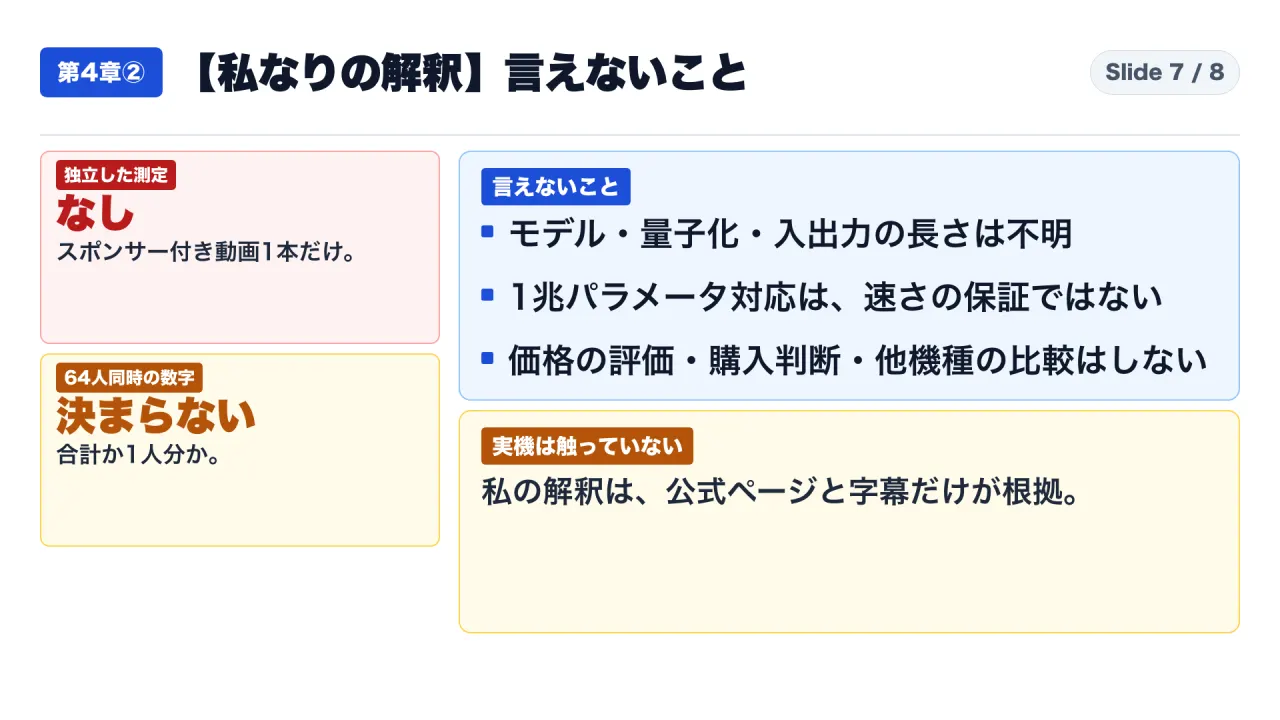
- Published specifications document memory capacity and bandwidth, but omit standardized token generation latency tables.
- The 3,000 tokens/sec claim represents an unverified aggregate metric from a sponsored demonstration, not an independent industry benchmark.
- Supporting a 1-trillion parameter model guarantees memory allocation capability, not generation velocity.
- Derived ratios in this brief (18x, 26x, 4x, 1.4 tokens/sec, 47 tokens/sec) represent author mathematical derivations, not vendor-published performance guarantees.
Procurement Framework: Five Mandatory Technical Inquiries
When evaluating enterprise AI server proposals promising high token throughput, engineering leaders should execute the following five-step technical evaluation:
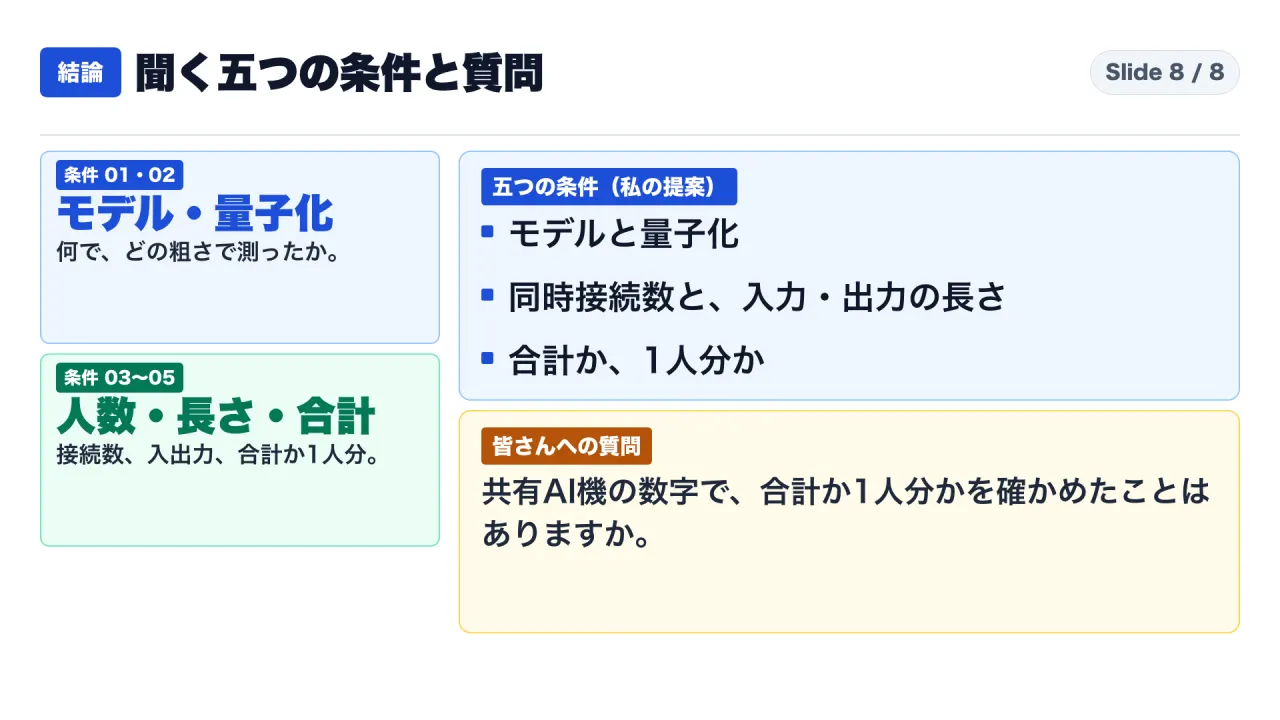
- Clarify Aggregate versus Single-Stream Throughput: Demand confirmation of whether metrics represent single-stream generation or cumulative batch output. Inquire into the exact concurrent request count (batch size) utilized during testing.
- Specify Model Architecture and Parameter Weighting: Identify the exact model checkpoint (e.g., Llama-3.1-70B, Qwen-2.5-72B, Mixtral-8x22B) and whether the entire parameter set resides within GPU HBM or spans CPU host memory.
- Verify Quantization Formats: Determine the exact quantization precision (FP16, BF16, INT8, FP8, or 4-bit AWQ/GPTQ) and assess associated quality trade-offs.
- Define Prompt and Completion Context Lengths: Require throughput measurements broken down by Time-to-First-Token and Inter-Token-Latency across representative prompt lengths (e.g., 2,048 input tokens with 512 output tokens).
- Model Enterprise Concurrency Profiles: Multiply expected simultaneous user counts by minimum acceptable interactive speeds (e.g., 20 developers requiring 30 tokens/sec = 600 tokens/sec aggregate requirement) to determine whether the platform’s sustained throughput envelope satisfies internal service level objectives.
Primary Sources and References
- HP Japan, HP ZGX Fury AI Station Technical Specifications: https://jp.ext.hp.com/workstations/zgx_fury_ai_station/
- HP Japan, Commercial Press Release (October 26, 2026): https://jp.ext.hp.com/info/newsroom/2026/20261026/
- NVIDIA Corporation, DGX Station Architecture and Technical Specifications: https://www.nvidia.com/en-us/products/workstations/dgx-station/
- NVIDIA Corporation, DGX Spark Technical Product Overview: https://www.nvidia.com/en-us/products/workstations/dgx-spark/
- NVIDIA Corporation, RTX PRO 6000 Blackwell Workstation Edition Specifications: https://www.nvidia.com/en-us/products/workstations/professional-desktop-gpus/rtx-pro-6000/
- HP Inc., HP ZGX Nano AI Station Overview: https://www.hp.com/us-en/workstations/zgx-nano-ai-station.html
- Independent Video Review, Broadcast Transcript (October 30, 2026): https://www.youtube.com/watch?v=lEFFa0Z5BIE