Why the Top 1% AI Spend Concentration Does Not Prove Weak Enterprise Demand
A rigorous, denominator-first examination of Ramp corporate card data, Apollo software distribution benchmarks, and Anthropic Form S-1 disclosures.
Japanese Edition: Read the original Japanese article on Substack
Video Episode (Japanese Audio): Watch on YouTube
Disclaimer: This analysis provides objective corporate finance, data engineering, and technology strategy analysis based strictly on publicly filed corporate records and verified datasets. It does not provide equity valuation, investment advice, or commercial product recommendations.
Executive Summary: The Structural Divide Between Spend Skew and Underlying Demand
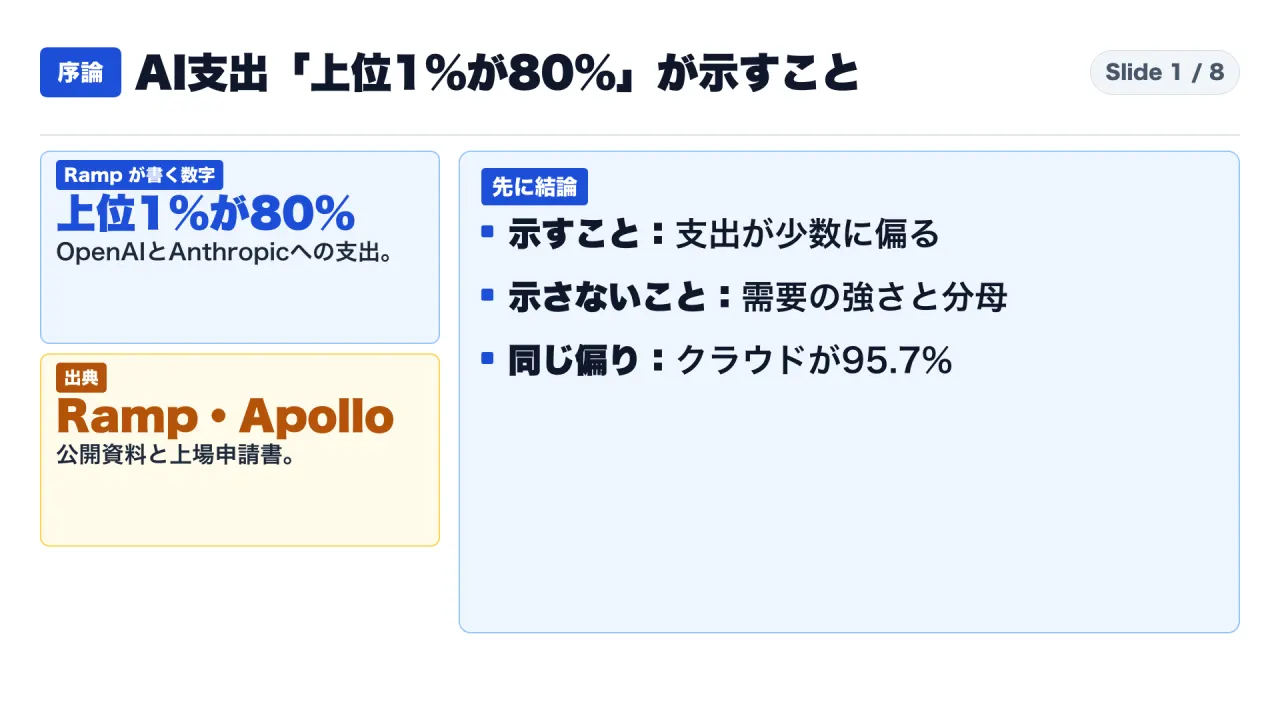
When commentary assesses corporate artificial intelligence adoption, a single metric frequently headlines the discussion: the assertion that eighty percent of corporate spending on OpenAI and Anthropic is generated by just one percent of customer companies. This figure, originally published by corporate card and spend-management provider Ramp, is commonly cited as evidence that broader enterprise demand for generative AI is illusory, that paying usage is confined to an insular circle of venture-backed startups, or that commercial viability has reached a premature plateau.
However, an exhaustive audit of the primary materials—specifically Ramp’s monthly AI Index datasets (spanning over 85,000 corporate card and invoice accounts), Ramp Economics Lab research letters published in September and October 2026, Apollo Global Management’s software distribution charts published in October 2026, economist Dean Baker’s analytical commentary, and Anthropic’s Form S-1 initial public offering registration statement filed with the US Securities and Exchange Commission—reveals a fundamentally different economic reality.
The concentration metric measures spend skew within a specific customer base; it does not measure aggregate market demand, user utility, or long-term enterprise utility. Across traditional enterprise infrastructure, comparable concentration is entirely standard: Apollo’s empirical data demonstrates that the top ten percent of corporate spenders account for 95.7% of traditional cloud infrastructure spend and 91.8% of non-AI Software-as-a-Service (SaaS) spend, compared to 95.6% for OpenAI and Anthropic. Furthermore, corporate spend reflects the product of unit price and physical volume. Between March and October 2026, blended model token pricing plummeted by 41% to 51%, while physical token consumption expanded by double digits. As a result, stable top-line expenditure coexisted with rapid physical workload growth.
To evaluate enterprise AI reality without narrative distortion, technology executives and financial analysts must separate verified ledger observations from commentator deductions across five foundational questions: what the primary records disclose, what remains unmeasured, and how Japanese and global enterprises should audit their internal compute allocation.
The Audit Framework: Three Benchmark Metrics with Divergent Denominators
Evaluating claims of extreme market concentration requires examining three distinct quantitative figures that are often conflated in public debate:
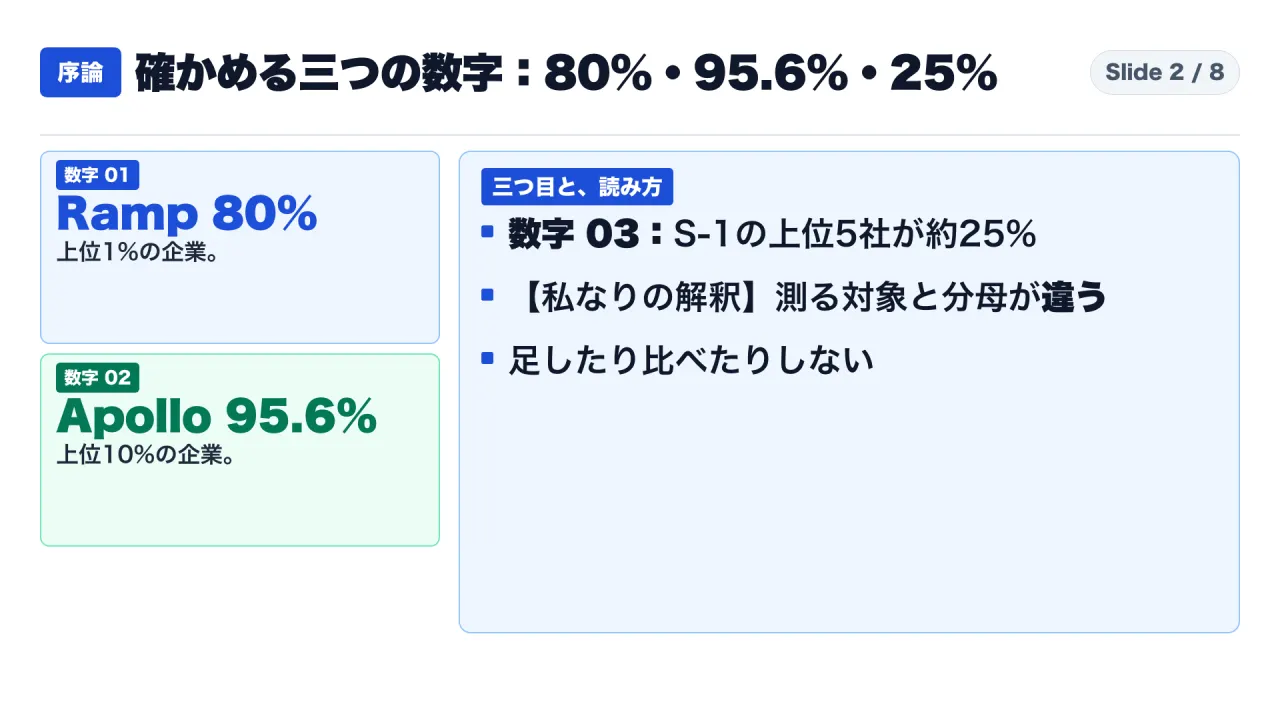
- Ramp’s Top 1% Share (80%): Ramp stated in an October 14, 2026 research letter that eighty percent of enterprise spending on OpenAI and Anthropic is driven by the top one percent of spending companies.
- Apollo’s Top 10% Share (95.6%): Apollo Global Management published a distribution chart citing Ramp Economics Lab data showing that the top ten percent of spending companies generate 95.6% of spending on OpenAI and Anthropic.
- Anthropic’s Form S-1 Customer Concentration (~25%): In its official SEC S-1 registration statement, Anthropic disclosed that for the nine months ended September 30, 2026, its top five customers accounted for approximately 25% of total revenue, with no single customer exceeding 10%.
While all three metrics reflect concentrated enterprise demand, they represent entirely distinct populations and accounting perimeters. Conflating customer card transactions on Ramp with Anthropic’s global enterprise contract base produces severe interpretive errors.
Chapter 1: Ramp’s Measured Perimeter and the Extreme Disparity in Per-Employee Medians
Sample Scope and Inherent Measurement Boundaries
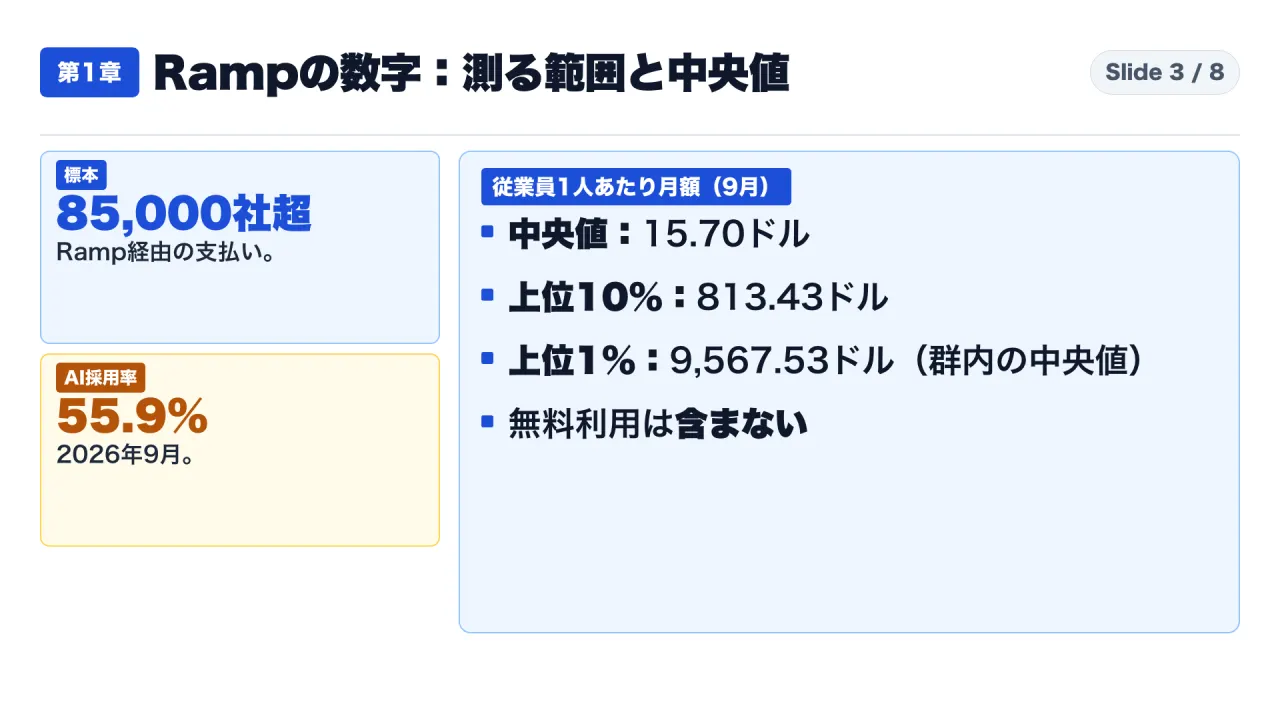
Ramp’s AI Index tracks corporate card transactions and automated invoice payments across an active pool of more than 85,000 corporate customers. Within this sample, Ramp defines the enterprise AI adoption rate as the proportion of active accounts registering at least one payment to an AI product or platform within a calendar month.
In September 2026, Ramp measured an enterprise AI adoption rate of 55.9%, reflecting an increase of 0.6 percentage points month-over-month and 12.1 percentage points year-over-year.
However, Ramp’s documentation explicitly highlights key structural limitations. First, free service tiers, open-source models deployed on local workstations, and employee subscriptions reimbursed via personal expense reports do not appear in corporate card or automated invoice transactions. Consequently, transaction logs capture corporate payments rather than universal operational tool adoption.
The 609-Fold Gap in Group Medians
For companies with positive AI expenditures, Ramp provides per-employee monthly spending metrics across distribution tiers. Crucially, the values reported for the top ten percent and top one percent represent the group-internal median (the middle spender within that percentile bracket), not an arithmetic mean.
| Customer Tier (Per-Employee Monthly Spend) | August 2026 | September 2026 | Relative Ratio vs Median (Sep 2026) |
|---|---|---|---|
| All Paying Companies (Overall Median) | $14.74 | $15.70 | 1.0x (Baseline) |
| Top 10% Spenders (Tier Median) | $740.47 | $813.43 | 51.8x |
| Top 1% Spenders (Tier Median) | $8,568.17 | $9,567.53 | 609.4x |
In September 2026, the median spending company paid $15.70 per employee per month—equivalent to standard workplace seat licenses such as ChatGPT Plus or Team tiers. In contrast, the median spender within the top one percent allocated $9,567.53 per employee per month, representing a 609.4-fold disparity.
Mathematical Distinctions Between Medians and Aggregate Percentages
A critical analytical pitfall is equating the 609-fold median ratio with the statement that the top one percent accounts for eighty percent of aggregate dollar spend. The group-internal median ($9,567.53) indicates that half of the companies in the top percentile spent above that figure per employee. However, calculating total dollar concentration requires knowledge of the underlying headcount and absolute spend distribution across all 85,000 firms.
Furthermore, Ramp’s index tracks AI spend as a percentage of total non-payroll operational spend, recording 5.77% in September 2026 and 5.96% in August 2026. Ramp’s public research letters do not provide the detailed denominator definition for non-payroll spend, preventing independent mathematical reconciliation between per-employee figures and overall budget allocations.
Chapter 2: Concentration Is an Industry-Wide Architecture, Not an AI Anomaly
Apollo’s Enterprise Software Distribution Benchmarks
On October 24, 2026, Apollo Global Management published an investment research briefing titled “No Signs of AI Payoff Outside the Tech Sector,” accompanied by five distribution charts. One chart, titled “AI Spending Is Highly Concentrated in a Few Firms,” presented distribution data attributed to Ramp’s economics research team.
The chart broke down enterprise spend between the top ten percent of spending firms and the remaining ninety percent across major technology categories:
| Technology Spend Category | Top 10% of Spending Firms | Lower 90% of Spending Firms | Category Definition / Infrastructure Scope |
|---|---|---|---|
| Model Serving and Inference | 99.5% | 0.5% | Dedicated inference endpoints and specialized API gateways |
| Neocloud Infrastructure | 99.0% | 1.0% | Accelerated GPU-first cloud compute providers |
| Traditional Cloud Compute | 95.7% | 4.3% | Core infrastructure (AWS, Azure, Google Cloud Platform) |
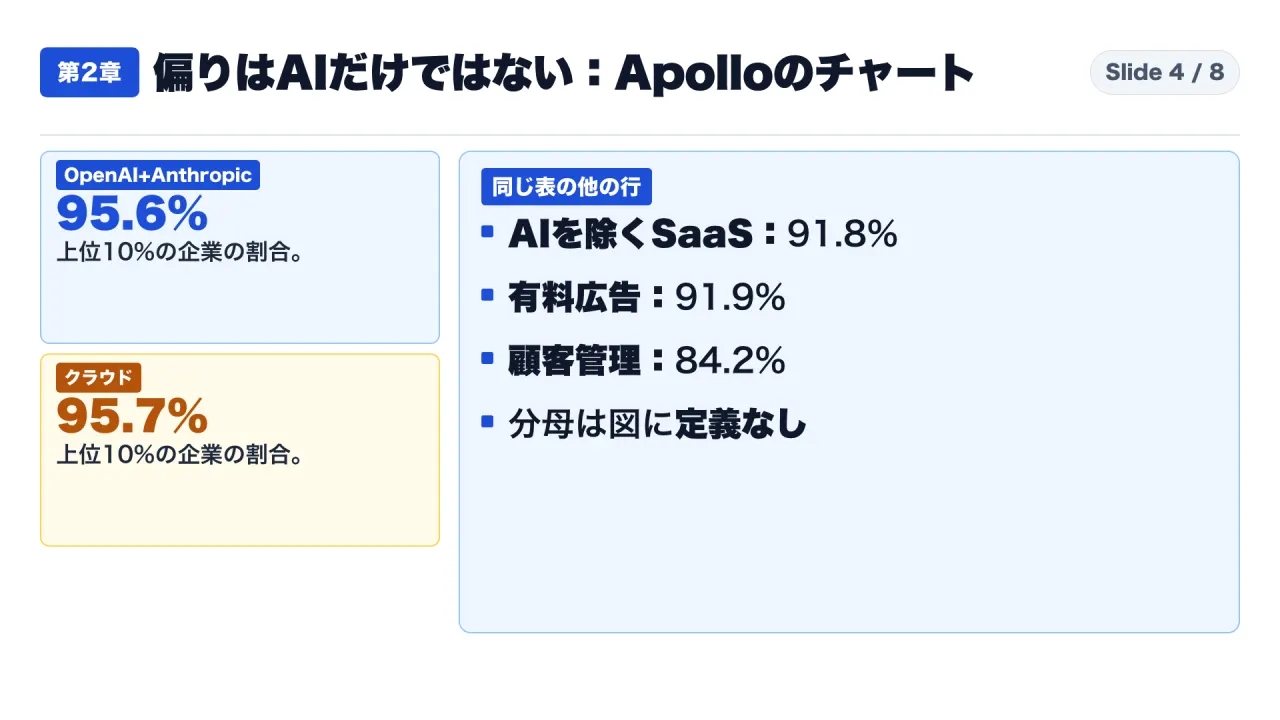
| OpenAI and Anthropic APIs | 95.6% | 4.4% | Direct proprietary model provider billing |
| Paid Digital Advertising | 91.9% | 8.1% | Performance marketing and enterprise ad platforms |
| Non-AI SaaS Software | 91.8% | 8.2% | Traditional enterprise productivity and workflow software |
| Customer Relationship Management (CRM) | 84.2% | 15.8% | Enterprise customer data and sales pipeline platforms |
The Structural Reality of B2B Compute Distribution
Apollo’s benchmark table establishes that customer skew in AI is neither unique nor unprecedented. The top ten percent concentration for OpenAI and Anthropic (95.6%) is nearly identical to traditional cloud compute (95.7%) and is separated from non-AI enterprise SaaS (91.8%) by just 3.8 percentage points.
Consider a baseline cohort of 100 enterprise customers. Across standard corporate software, the top ten accounts routinely generate over ninety percent of billings, leaving the bottom ninety accounts to divide less than ten percent. This distribution reflects the fundamental nature of compute: heavy computational workloads (such as algorithmic processing, large-scale media rendering, and data warehousing) naturally concentrate within engineering-heavy enterprises, whereas general workplace software distributes lightly across administrative seats.
Consequently, observing that generative AI spend is concentrated in top-tier accounts proves that large computational workloads exist; it does not demonstrate that AI adoption has stalled across mainstream organizations.
Chapter 3: Dissecting the Top 1%: Venture Capital Backing vs Market Assumptions
Measured Characteristics of Top Spenders
In an accompanying chart titled “The AI Circularity Is Also Seen in Token Spending,” Apollo segmented AI spend tiers based on venture capital financing:
| Customer Spend Tier | Venture Capital Backed | Non-Venture Backed | Measured Distribution Perimeter |
|---|---|---|---|
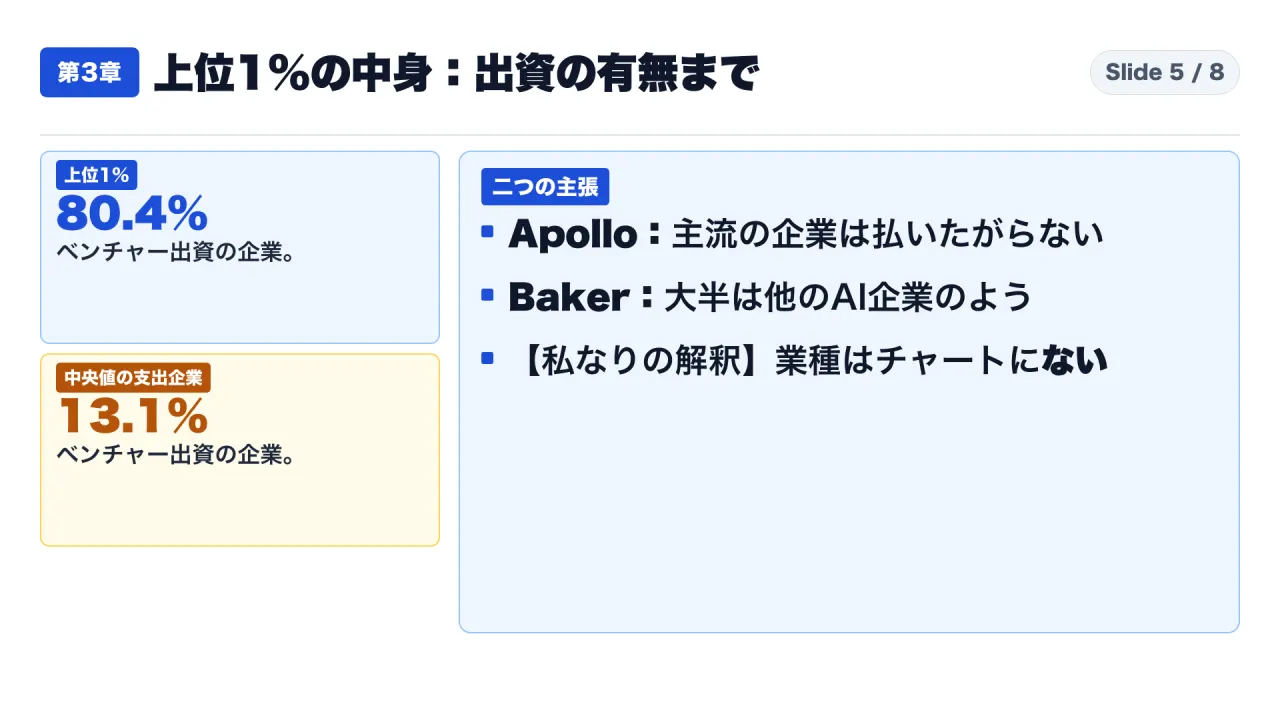
| Top 1% of AI Spenders | 80.4% | 19.6% | Ramp corporate accounts in top 1% of AI spend |
| Median AI Spending Company | 13.1% | 86.9% | Ramp corporate accounts at the median spend tier |
The data confirms that 80.4% of the companies in the top spend percentile have received venture capital funding, compared to only 13.1% among median spenders.
Distinguishing Primary Data from Analytical Interpretations
Based on this distribution, Apollo argued that venture-funded firms are aggressively expanding compute expenditures, whereas mainstream corporate America does not require frontier models and remains reluctant to pay premium pricing. Apollo concluded that because AI spending remains isolated in a narrow segment of the economy, macroeconomic spillovers are minimal, asserting that AI has delivered “zero financial payoff” to non-tech corporate America.
Economist Dean Baker cited Ramp and Apollo’s data in an October 26, 2026 analysis, writing that “the vast majority of heavy users appear to be other AI companies.” Baker posited that primary demand consists of startups building ancillary AI tools funded by venture capital without profitable underlying business models.
However, an audit of the primary data reveals an essential boundary:
- Financing Status vs Industry Classification: The chart classifies enterprises solely by venture capital backing. It does not provide industry sector classifications (such as fintech, healthcare, logistics, e-commerce, or defense technology). A venture-funded company is not automatically an AI foundation model company.
- Company Percentage vs Spend Share: The data records that 80.4% of top-tier companies are venture-backed; it does not measure the exact proportion of dollar billings contributed by those firms.
- Speculation vs Evidence: Baker’s conclusion that heavy users are “other AI companies” represents an unverified deduction outside the dataset. Neither Ramp nor Apollo provides a verified ledger proving that customer workloads consist primarily of recursive AI training.
Chapter 4: Spend vs Physical Volume, Estimate Revisions, and S-1 Boundaries
The Spend De-coupling: Unit Price Collapse vs Volume Expansion
A fundamental tenet of financial analysis is that total expenditure equals unit price multiplied by physical volume (Expenditure = Price * Quantity). In corporate technology, flat or moderate spend growth frequently masks massive underlying volume expansion when unit prices drop rapidly.
Ramp’s research letters explicitly document this dynamic:
- In its October 14, 2026 letter, Ramp noted that while token spend remained nearly flat throughout August and September 2026, underlying token consumption expanded substantially.
- For the week ending October 23, 2026, weekly token spend rose 8.9% compared to the prior month’s baseline, while physical token volume surged by 37.1%.
- The blended market price per million tokens across OpenAI and Anthropic fell to $0.56, representing a 26.8% decline from $0.76 four weeks earlier.
- In its September 9, 2026 letter, Ramp recorded that effective token prices had dropped 41% from a peak of $1.15 in March 2026 down to $0.68.
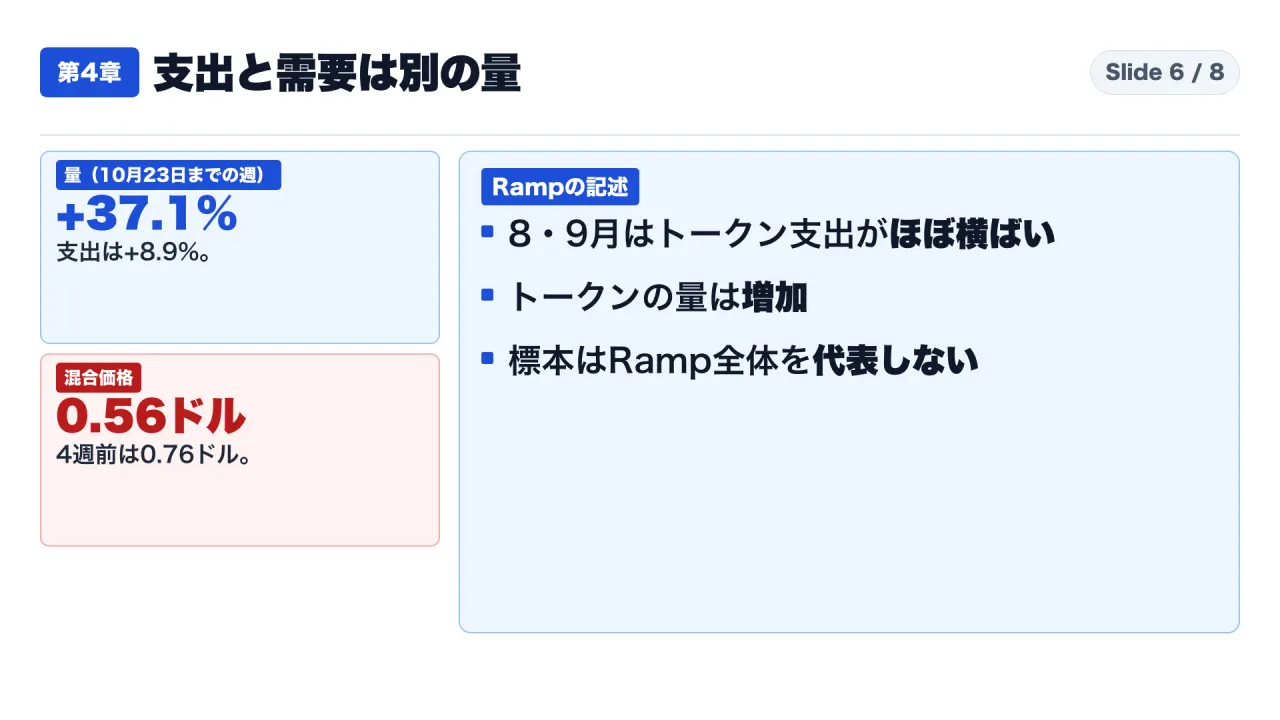
When unit prices drop by over forty percent within seven months, enterprise budgets that remain flat reflect a near-doubling of operational workload. Interpreting flat spend as an indication of flat enterprise utility fails to account for dramatic cost efficiencies passed directly to end users.
Volatility and Upward Revisions in Top Percentile Estimates
A secondary insight from Ramp’s disclosures is the inherent volatility in small-sample percentile tracking:
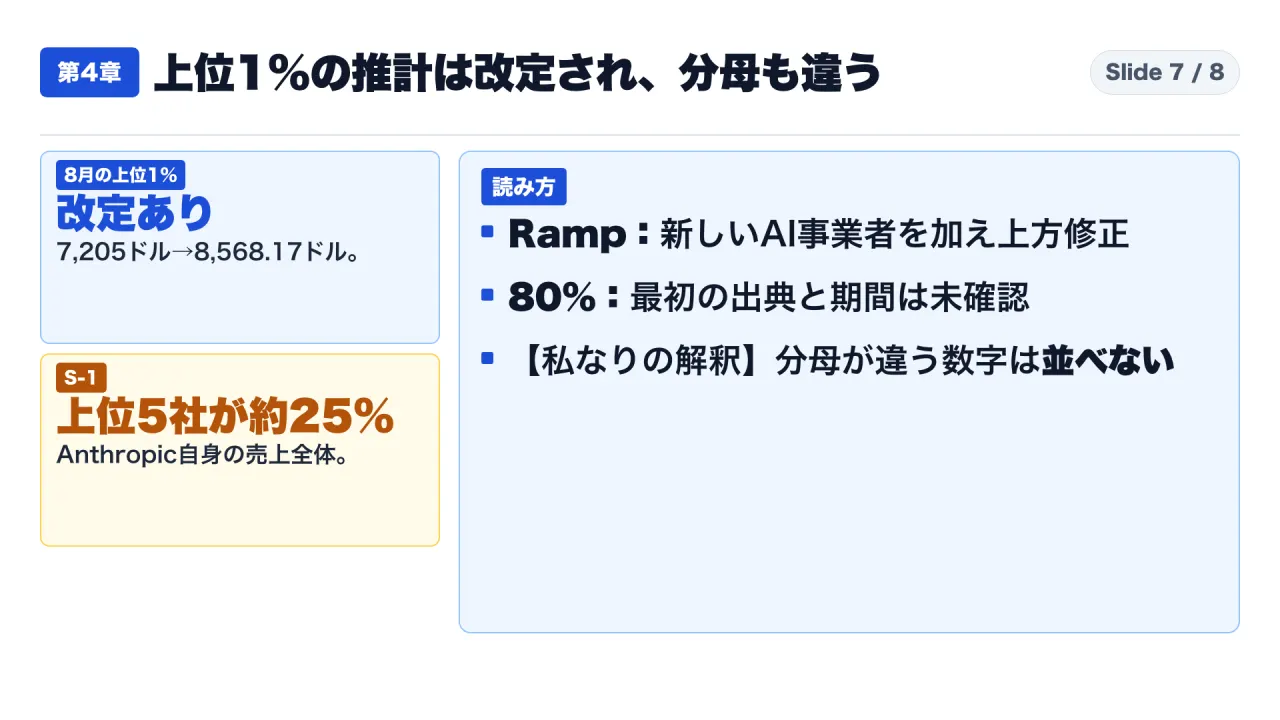
- In its September 9, 2026 letter, Ramp reported that the median spend of the top one percent fell 9.7% in August from $7,976 to $7,205.
- However, in Ramp’s subsequent AI Index tables, the revised August figure for the top one percent was updated to $8,568.17—an upward revision of approximately 18.9% ($1,363.17).
- Ramp explained that tracking the top one percent involves a small absolute number of enterprise accounts, making the metric highly sensitive to data pipeline updates and the incorporation of new AI platform billing connectors.
This revision demonstrates that monthly figures in top percentile brackets should be treated as dynamic directional indicators rather than static corporate accounting truths.
The Denominator Gap: Ramp Transaction Data vs Anthropic’s Form S-1
The divergence between transaction-level indices and audited corporate revenue appears clearly when comparing Ramp to Anthropic’s SEC disclosures.
In its Form S-1 registration statement, Anthropic disclosed that across its consolidated corporate revenues for the first nine months of 2026, its top five customers accounted for approximately 25% of total revenue, with no individual customer representing more than 10%.
The apparent contradiction between Ramp’s statement that “the top 1% drives 80% of spend” and Anthropic’s disclosure that “the top 5 customers represent ~25% of revenue” stems entirely from divergent perimeters:
- Ramp measures card transactions and invoices among its corporate card customers paying OpenAI and Anthropic.
- Anthropic measures global consolidated corporate revenues, including large multi-year enterprise commitments, government contracts, cloud marketplace distribution agreements via Amazon Web Services and Google Cloud, and global consumer subscriptions.
Neither figure invalidates the other; they describe completely separate universes.
Strategic Implications: How Enterprise Leaders and Japanese DX Practitioners Should Audit AI Budgets
The empirical findings from Ramp, Apollo, and SEC filings provide actionable governance principles for corporate executives, Chief Information Officers, and business unit leaders evaluating internal AI expenditures.
What the Evidence Proves vs What It Leaves Blank
| Dimension | Verified Primary Source Evidence | Unverified Speculation / Common Narrative |
|---|---|---|
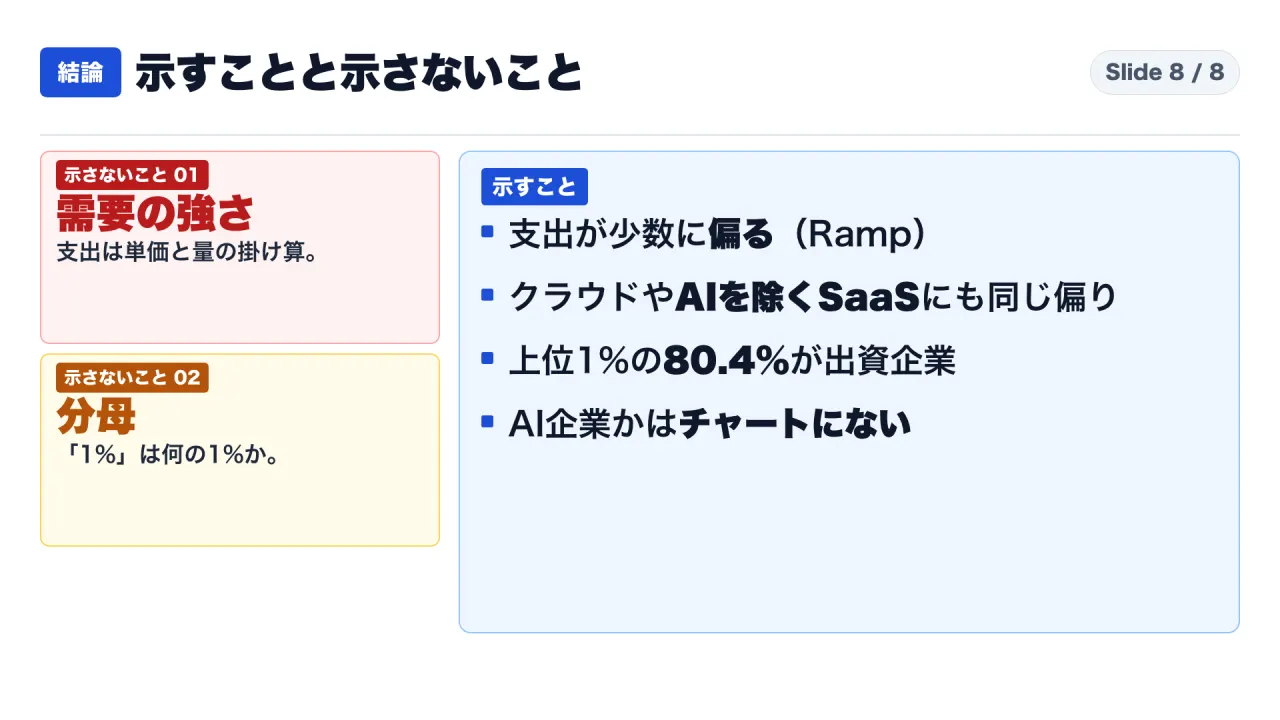
| Spend Distribution | Spend is heavily skewed; top 10% generates 95.6% of OpenAI/Anthropic spend on Ramp | Skew proves corporate AI demand is collapsing or fundamentally weak |
| Cross-Industry Benchmark | Cloud infrastructure (95.7%) and enterprise SaaS (91.8%) exhibit identical concentration | AI concentration is an unnatural anomaly unique to generative models |
| Capital Structure | 80.4% of top 1% spenders have received venture capital funding | Heavy users are exclusively AI startups trading circular paper compute |
| Operational Volume | Effective token prices fell 41% to 51%; token volume grew 37.1% in a single month | Flat or moderating top-line spend indicates stagnant employee usage |
| Data Perimeter | Figures represent Ramp accounts; 80% baseline period is not formally defined | Figures represent the universal corporate adoption state of global industry |
A Four-Step Internal Audit Methodology for Corporate AI Allocations
For enterprise technology leaders—particularly within Japanese enterprise environments managing digital transformation (DX) initiatives and system integration (SI) roadmaps—evaluating AI value requires auditing internal ledgers with the same quantitative rigor:
- Deconstruct Headcount vs Expenditure Skew: Disaggregate corporate billing by department, business unit, and user tier. Separately calculate the percentage of total expenditure consumed by the top five percent of users versus the percentage of registered employees actively prompting models. Conflating user headcount with financial billing obscures operational reality.
- Isolate Physical Workload (Tokens) from Effective Pricing: Standardize invoices into volume metrics (total prompt tokens, completion tokens, and batch inference runs) alongside dollar spend. If departmental spend is flat while underlying token volume has doubled, the organization has achieved significant productivity gains through falling compute costs.
- Audit Workload Types Across Frontier and Distilled Models: Determine whether internal workloads are routing through top-tier frontier models (such as Claude 3.5 Sonnet or GPT-4o) when lighter, specialized distilled models or self-hosted open architectures could execute the task at an order-of-magnitude lower cost.
- Distinguish Speculative Circularity from Core Workflow Automation: Track whether AI outputs are integrated directly into verifiable operational pipelines—such as customer support ticket triage, code test generation, automated financial reconciliation, or contract compliance—with measurable operational latency reductions, rather than open-ended sandbox experimentation.
Primary Source Documentation and Audit Ledger
The verified metrics in this analysis were cross-checked directly against the original published source documentation:
- Ramp AI Index: Monthly enterprise adoption and spend distribution datasets (September and August 2026 releases), Ramp Business Corporation. https://ramp.com/data/ai-index
- Ramp Economics Lab Research Letter (October 14, 2026): “AI Index: October 2026 - Token Pricing Dynamics and Enterprise Skew,” authored by Ramp Economics Lab. https://econlab.substack.com/p/ai-index-oct-2026
- Ramp Economics Lab Research Letter (September 9, 2026): “AI Index: September 2026 - Upward Revisions and Top Tier Spending,” authored by Ramp Economics Lab. https://econlab.substack.com/p/ai-index-sept-2026
- Apollo Global Management Research Presentation (October 24, 2026): “Daily Spark: No Signs of AI Payoff Outside the Tech Sector,” including Chart 4 (“AI Spending Is Highly Concentrated”) and Chart 5 (“AI Circularity in Token Spending”), Apollo Global Management, Inc. https://www.apollo.com/wealth/insights-news/insights/daily-spark/no-signs-of-ai-payoff-outside-the-tech-sector
- Dean Baker Commentary (October 26, 2026): “The Big Problem with AI: Where’s the Payoff?,” Center for Economic and Policy Research (CEPR) / Substack. https://deanbaker22.substack.com/p/the-big-problem-with-ai-wheres-the
- Anthropic, PBC Form S-1 Registration Statement: Initial Public Offering registration document filed with the US Securities and Exchange Commission (SEC EDGAR), Risk Factors: Customer Concentration disclosures. https://www.sec.gov/Archives/edgar/data/2130357/000162828026067168/anthropicpbc-sx1.htm