What Did "110 Minutes Saved per Week by AI" Actually Measure? Reading Government AI Survey Metrics Before Setting Enterprise ROI Targets
A methodological forensic audit of Japan’s Digital Agency survey on the “Gennai” LLM platform, decomposing denominator bias, midpoint bins, and output verification overhead.
Published: November 1, 2026 | Read time: ~10 min | Watch Video (Japanese)
Executive Summary & Core Analytical Findings
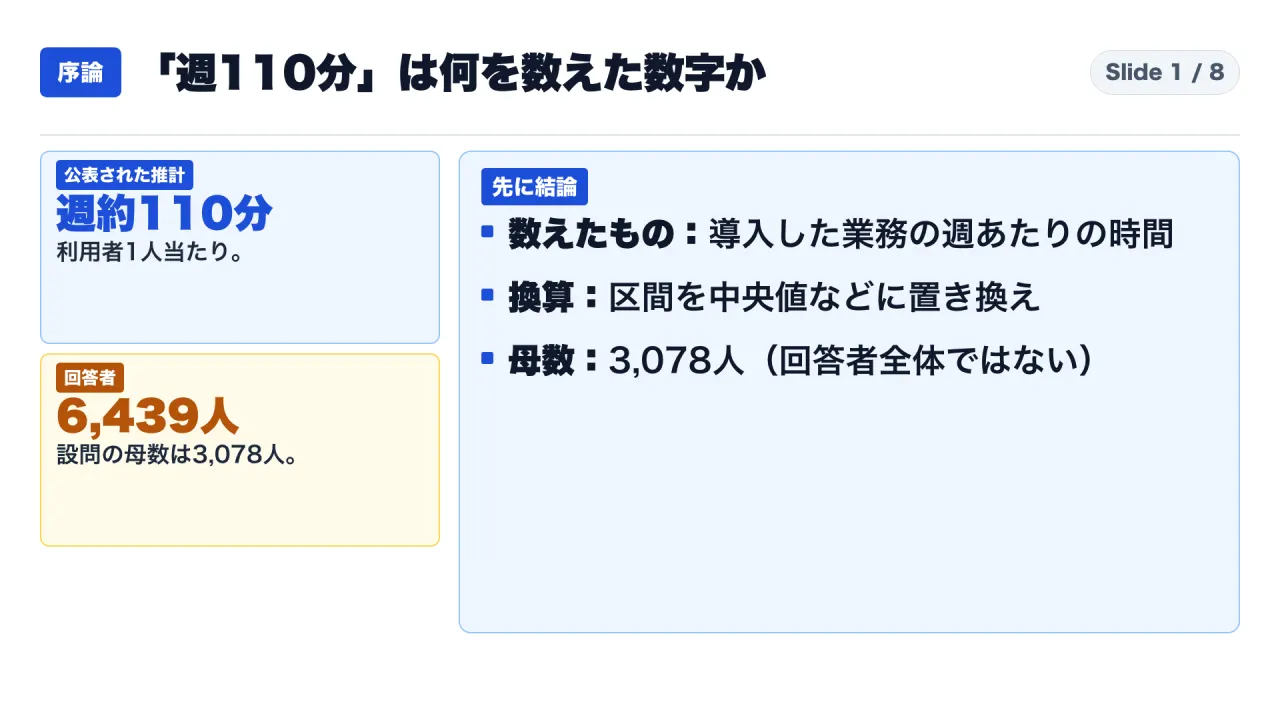
- The Headline vs. The Ledger: On October 30, 2026, Japan’s Digital Agency released results from its inaugural civil service survey evaluating “Gennai”—the national government’s unified generative AI infrastructure. The report estimated an average operational time reduction of approximately 1.83 hours (~110 minutes) per user per week.
- The Denominator Filter: The widely cited 110-minute average was not calculated across the survey’s 6,439 total respondents, but across a specific sub-cohort of 3,078 civil servants who actively answered the time-saving question. A companion satisfaction metric of 71.7% likewise applies solely to this active cohort; when measured against the full respondent base of 6,439 employees, overall satisfaction represents 34.3%.
- Mathematical Imputation: The 110-minute figure is not an instrumented telemetry measurement from system logs or clock-in records. It is a mathematical estimate derived by converting subjective categorical response intervals (e.g., “1 to 3 hours saved”) into continuous midpoint numbers. Calculating across published cell counts reproduces the agency’s 110.1-minute figure exactly, while sensitivity modeling demonstrates that alternative bin assumptions swing the outcome from 75 to 145 minutes.
- Task Scope vs. Workday Scope: The survey measured perceived time adjustments strictly within “tasks where Gennai was implemented,” not across total civil servant working hours. Furthermore, 59.1% of active respondents reported that task duration remained essentially unchanged within a plus-or-minus 10% threshold.
- The Verification Blindspot: While 54.4% reported saving at least one hour weekly on assisted tasks, 949 respondents flagged low factual reliability and 627 reported substantial friction editing AI text. Official documentation does not confirm whether time spent reviewing and correcting outputs was deducted from reported savings.
- Target Audience & Purpose: Designed for corporate planning directors, Chief Information Officers, HR transformation leads, and public policy analysts evaluating enterprise generative AI deployments.
Methodological Framework: Separating Official Documentation, Calculations, and Inferences
To evaluate survey-driven productivity claims rigorously, this audit maintains a three-part evidentiary division:
- Documented Administrative Facts: Exact figures, response tallies, category definitions, and survey methodologies published in the Digital Agency’s official announcements and accompanying analytical PDFs.
- Author Mathematical Recomputations: Independent mathematical calculations executed using the agency’s published cell distributions (such as midpoint sums, sensitivity bounds, and denominator adjustments).
- Analytical Interpretation & Governance Frameworks: Management evaluations, survey design recommendations, and risk assessments formulated by the author.
Primary source artifacts were captured on November 1, 2026, and verified on November 2, 2026. The author did not administer the government survey; this audit examines the documentary and mathematical record as published.
Chapter 1: The Mathematics of Midpoint Binning: Reproducing the 110-Minute Average
To understand the 110-minute statistic, one must examine how the Digital Agency structured its survey questionnaire and converted interval bands into an arithmetic mean.
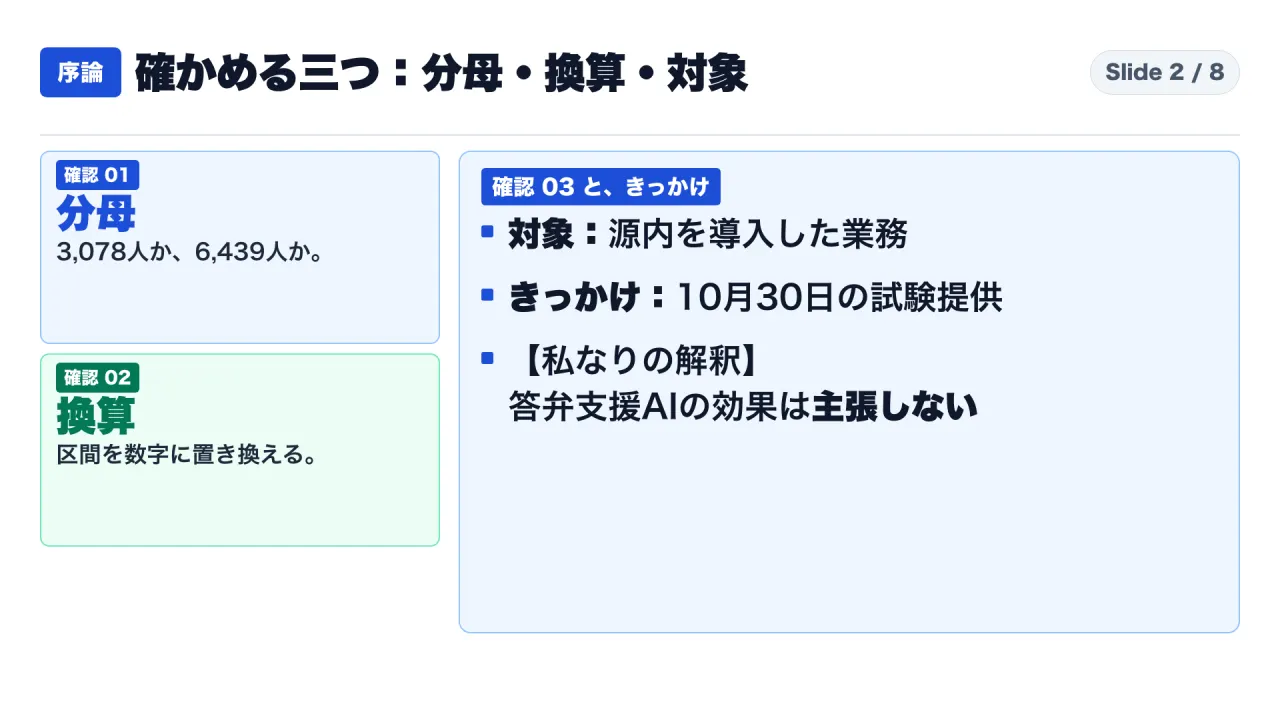
Rather than asking respondents to log exact minutes, the questionnaire presented ordinal ranges: “1 to 3 hours reduced,” “3 to 5 hours reduced,” “5 to 10 hours reduced,” and “10+ hours reduced,” alongside neutral, increased, and unknown options. The agency’s published summary document specifies explicit conversion rules:
DIGITAL AGENCY CONVERSION RULES:
- 1 to 3 hrs saved: 2.0 hrs | 3 to 5 hrs saved: 4.0 hrs | 5 to 10 hrs saved: 7.5 hrs
- 10+ hrs saved: Capped at +10.0 hrs | 1 to 3 hrs increased: -2.0 hrs | 3+ hrs: -3.0 hrs
- Unchanged (within ±1 hr): 0.0 hrs | Unknown: 0.0 hrs
Cross-tabulating these rules against published respondent counts yields the following distribution:
| Survey Response Category | Respondent Count | Imputed Value (Hours) | Subtotal Workload Impact (Hours) |
|---|---|---|---|
| 10+ Hours Reduced | 99 | +10.0 | +990.0 |
| 5 to 10 Hours Reduced | 160 | +7.5 | +1,200.0 |
| 3 to 5 Hours Reduced | 337 | +4.0 | +1,348.0 |
| 1 to 3 Hours Reduced | 1,081 | +2.0 | +2,162.0 |
| Virtually Unchanged (within ±1 hr) | 1,065 | 0.0 | 0.0 |
| 1 to 3 Hours Increased | 19 | -2.0 | -38.0 |
| 3+ Hours Increased | 4 | -3.0 | -12.0 |
| Unknown / Do Not Know | 313 | 0.0 | 0.0 |
| Active Sub-Cohort Total | 3,078 | – | +5,650.0 net hours |
ARITHMETIC REPRODUCTION OF THE HEADLINE METRIC:
Net Weekly Hours Saved:
  99(10) + 160(7.5) + 337(4) + 1081(2) - 19(2) - 4(3) = 5,650.0 hours
Per-Respondent Average:
  5,650.0 hours / 3,078 respondents = 1.8356 hours
Converted to Minutes:
  1.8356 * 60 = 110.136 minutes (~110 minutes)
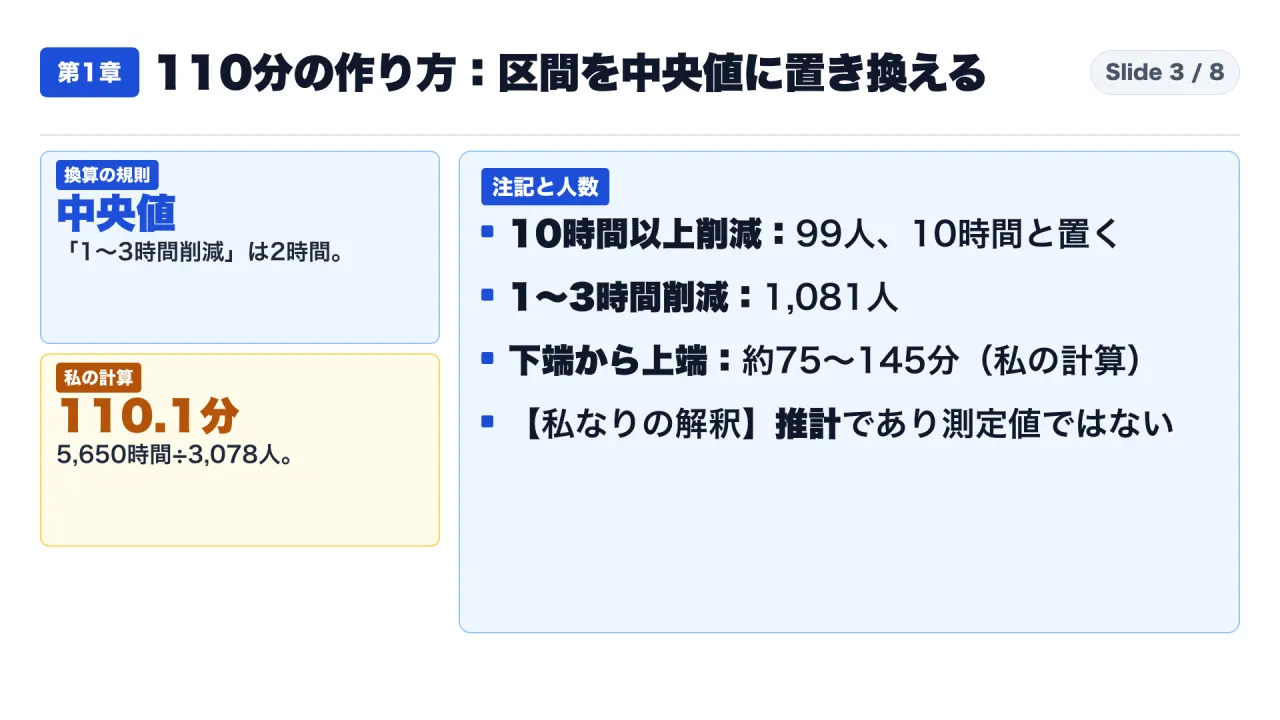
The author’s independent recalculation confirms that dividing 5,650 hours by 3,078 respondents yields exactly 1.8356 hours (110.1 minutes), fully reproducing the published figure.
Sensitivity Analysis: The Power of Midpoint Assumptions
Because interval midpoints are arbitrary statistical conventions, testing boundary assumptions reveals the metric’s sensitivity:
- Lower-Bound Imputation: Setting intervals to their minimums (1 hr, 3 hrs, 5 hrs) yields an aggregate savings of 3,851 hours, or 75.1 minutes per user.
- Upper-Bound Imputation: Setting intervals to their maximums (3 hrs, 5 hrs, 10 hrs) yields 7,449 hours, or 145.2 minutes per user.
The 110-minute average is not an empirical physical constant; it is an analytical artifact of midpoint modeling across subjective intervals.
Chapter 2: Denominator Architecture: 3,078 Active Users vs. 6,439 Total Respondents
A critical vulnerability in corporate interpretations of public surveys is denominator blindness—attributing metrics derived from active sub-cohorts to an entire population.
The survey was administered from August 21 to September 18, 2026, via Microsoft Forms, gathering 6,439 responses across government ministries (2,467 from central headquarters and 3,972 from regional bureaus). However, the questions regarding workload impact and satisfaction were answered by exactly 3,078 civil servants.
RESPONDENT SEGMENTATION (N = 6,439):
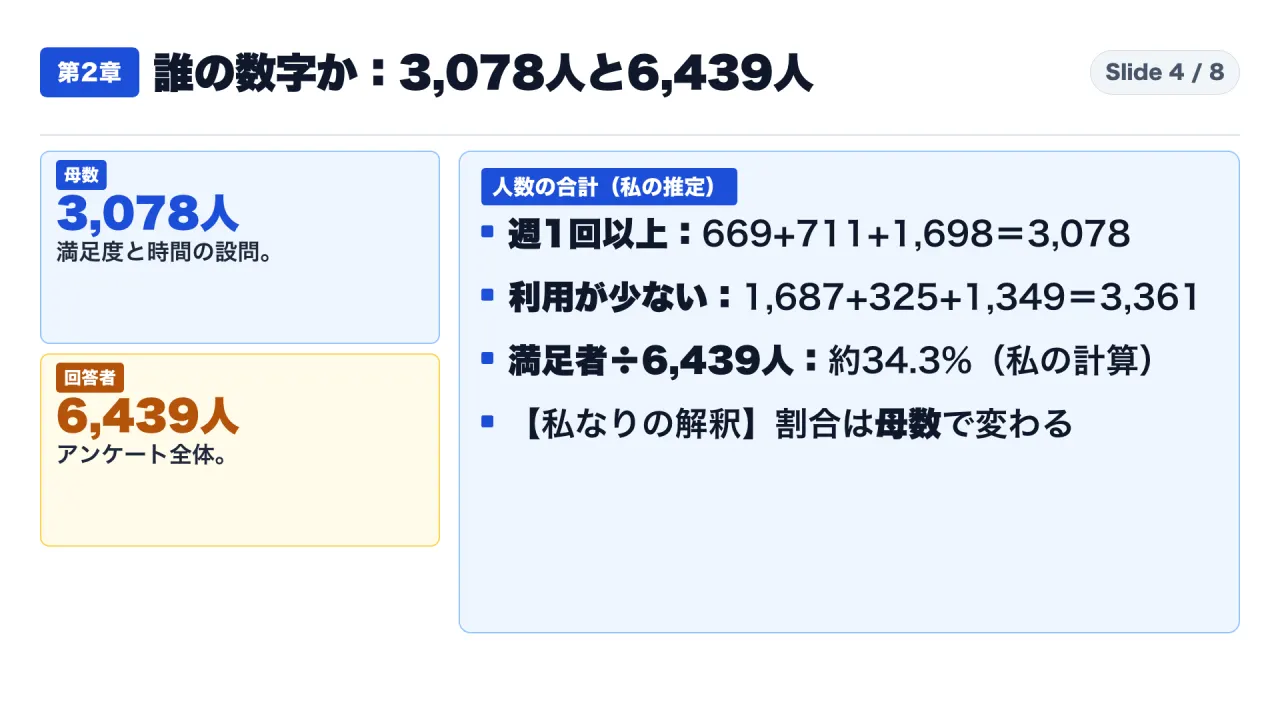
- Active Users (3,078 / 47.8%): Daily (669), 3-4x weekly (711), 1-2x weekly (1,698)
  Answered Workload Impact (110 min avg) and Satisfaction (71.7%)
- Non-Users (3,361 / 52.2%): Rarely (1,687), Never used (325), Not registered (1,349)
  Answered "Reasons for Non-Use" branching questions
Summing the frequency brackets clarifies the sample: employees utilizing Gennai daily (669), 3 to 4 times weekly (711), and 1 to 2 times weekly (1,698) total exactly 3,078 (47.8% of respondents). Conversely, employees who rarely used Gennai (1,687), registered but never used it (325), or never registered (1,349) total exactly 3,361 (52.2%).
The Denominator Shift Across Satisfaction and Hours
Recognizing this branching logic transforms published headlines:
- Satisfaction Headline: The Digital Agency reported that 71.7% of respondents expressed satisfaction (16.0% “very satisfied” and 55.7% “somewhat satisfied”). However, this 71.7% represents 2,208 individuals out of the 3,078 active users. Across the full sample of 6,439 civil servants, satisfied active users represent 34.3%.
- Time Savings Across the Workforce: If an enterprise planner conservatively assumes that non-respondents (3,361 individuals) experienced zero workload reduction, dividing 5,650 saved hours across all 6,439 respondents reduces average savings to 52.6 minutes per worker. Conversely, excluding the 313 “unknown” answers raises active user savings to 122.6 minutes.
The Digital Agency accurately documented sample counts in its slide footers; the analytical failure occurs when enterprise leaders transplant the 110-minute headline into workforce planning models without adjusting for active adoption ratios.
Chapter 3: Defining Task Scope: Assisted Workflows vs. Total Workdays
The third structural parameter is scope boundary: what specific time was being evaluated?
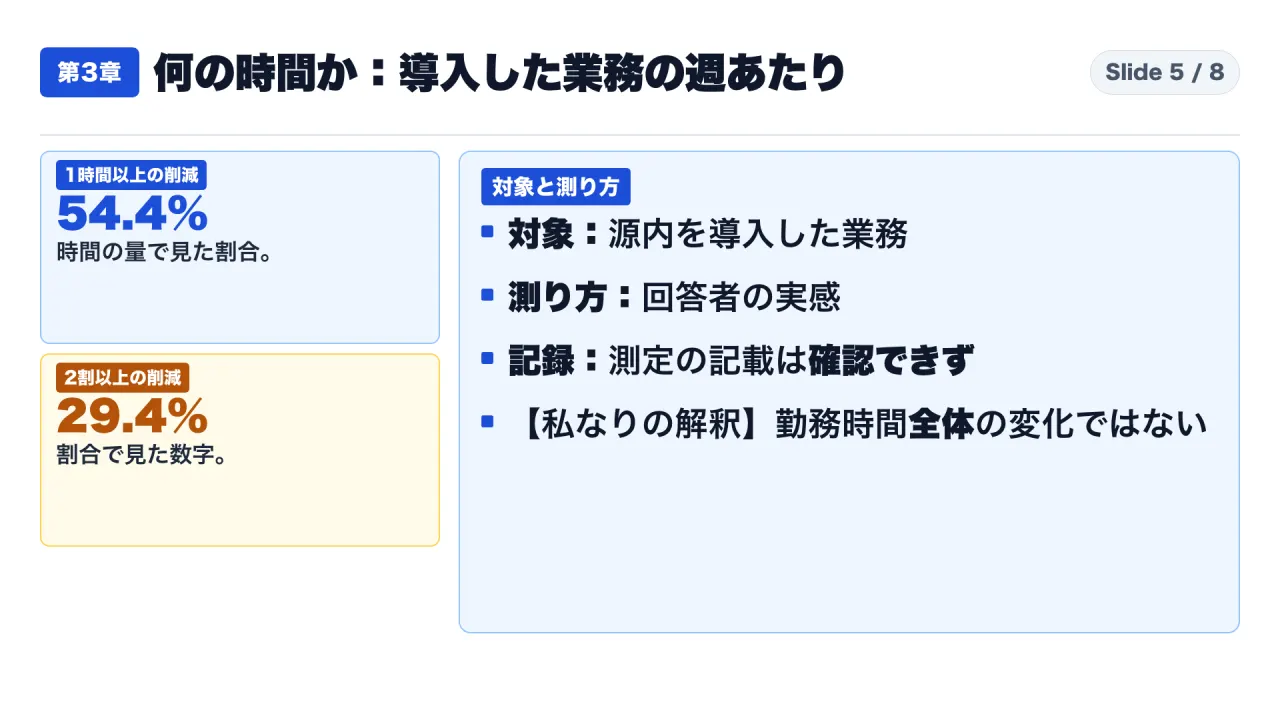
Official documentation labels the survey chart: “Changes in Working Hours in Tasks Where AI Was Implemented (per week).” The question did not measure total civil service working hours; it captured subjective impressions strictly within workflows where employees chose to employ Gennai.
Absolute Hours vs. Relative Percentages
When the survey queried the same 3,078 employees regarding percentage reductions within targeted tasks, the distribution revealed heavy stability:
- >= 20% Reduction: Reported by 29.4% of users.
- Virtually Unchanged (within ±10%): Reported by 59.1% of users.
- >= 20% Increase in Task Time: Reported by 0.6% of users.
While 54.4% of users reported saving at least one hour in absolute terms, nearly 60% observed that targeted task durations did not shift by more than 10%. In administrative workflows requiring extensive reading, inter-departmental consensus, and formal sign-offs, LLM text drafting affects only a fractional segment of end-to-end task execution.
Qualitative Shifts: Quality Expansion and Workload Shifts
Qualitative comments included in the survey demonstrate that productivity gains frequently manifest as expanded scope rather than reduced desk time:
- Internalization: One agency reported that drafting specialized administrative guidelines—which previously required contracting external consultants over six to twelve months—was completed in-house in approximately three months.
- Workload Reallocation: Multiple respondents noted that their individual work hours increased because colleagues unable or unwilling to use AI routed additional drafting tasks to AI-proficient staff.
- Work Process Discovery: One employee observed: “Researching standard work procedures takes more time than executing the work itself; Gennai primarily assists in comprehending procedure sequences.”
Chapter 4: Chronological Decoupling and the Human Verification Burden
Two operational caveats dismantle common enterprise misconceptions regarding the Gennai findings.
1. Chronological Decoupling from Diet Q&A Automation
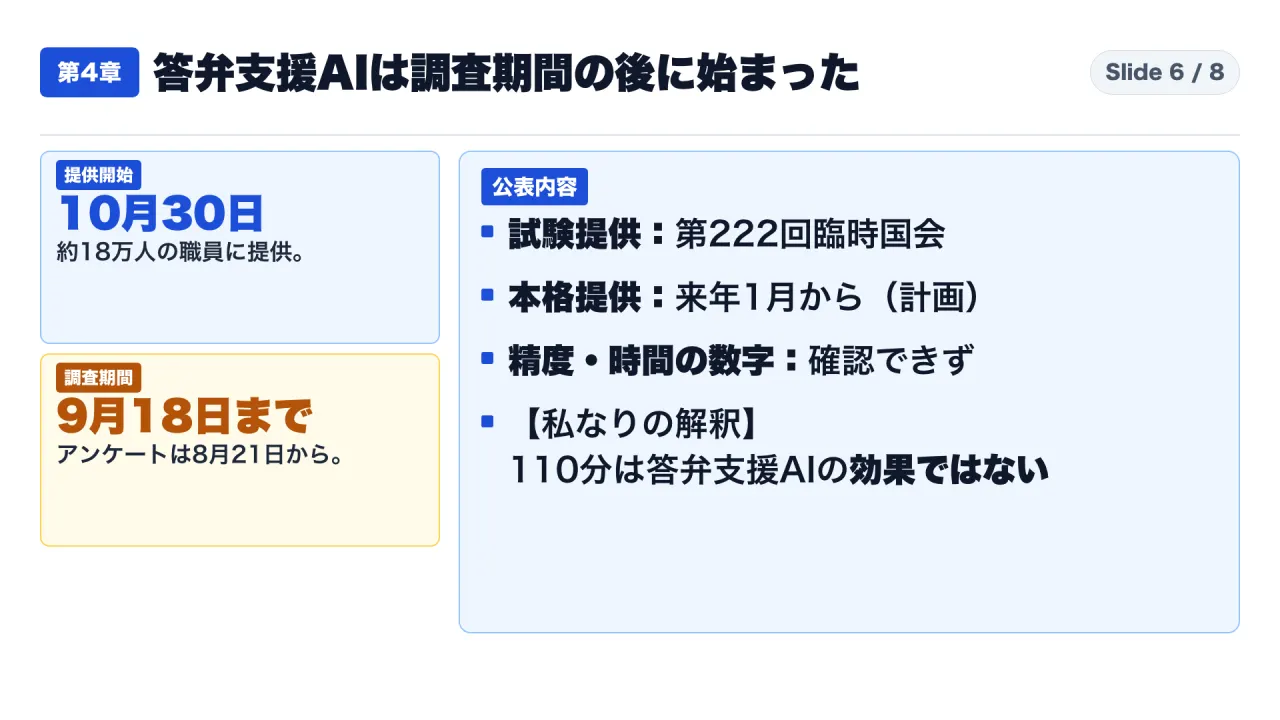
On October 30, 2026, the Digital Agency announced the prototype deployment of an AI application designed to assist in drafting parliamentary (Diet) responses across approximately 180,000 civil servants. Because this rollout coincided with the survey publication, multiple observers conflated the two, assuming 110 minutes reflected time saved on Diet Q&A preparation.
CHRONOLOGICAL DECOUPLING TIMELINE:
- August 21 to September 18, 2026: Gennai Utilization Survey Administered (N=6,439)
- October 30, 2026: Gennai Survey Results Published (Reporting 110 min savings)
- October 30, 2026: Diet Q&A Assistance AI Prototype Released to 180,000 Staff
──► Finding: Survey occurred BEFORE Diet Q&A AI release; 110 min contains zero Diet Q&A data.
The survey was completed a month before the Diet Q&A application was deployed. Official documents disclose zero performance metrics or time savings regarding the parliamentary application. Furthermore, the agency established strict operational guardrails: AI-generated drafts must undergo mandatory verification against primary policy documents by civil servants prior to adoption.
2. The Unquantified Verification Burden
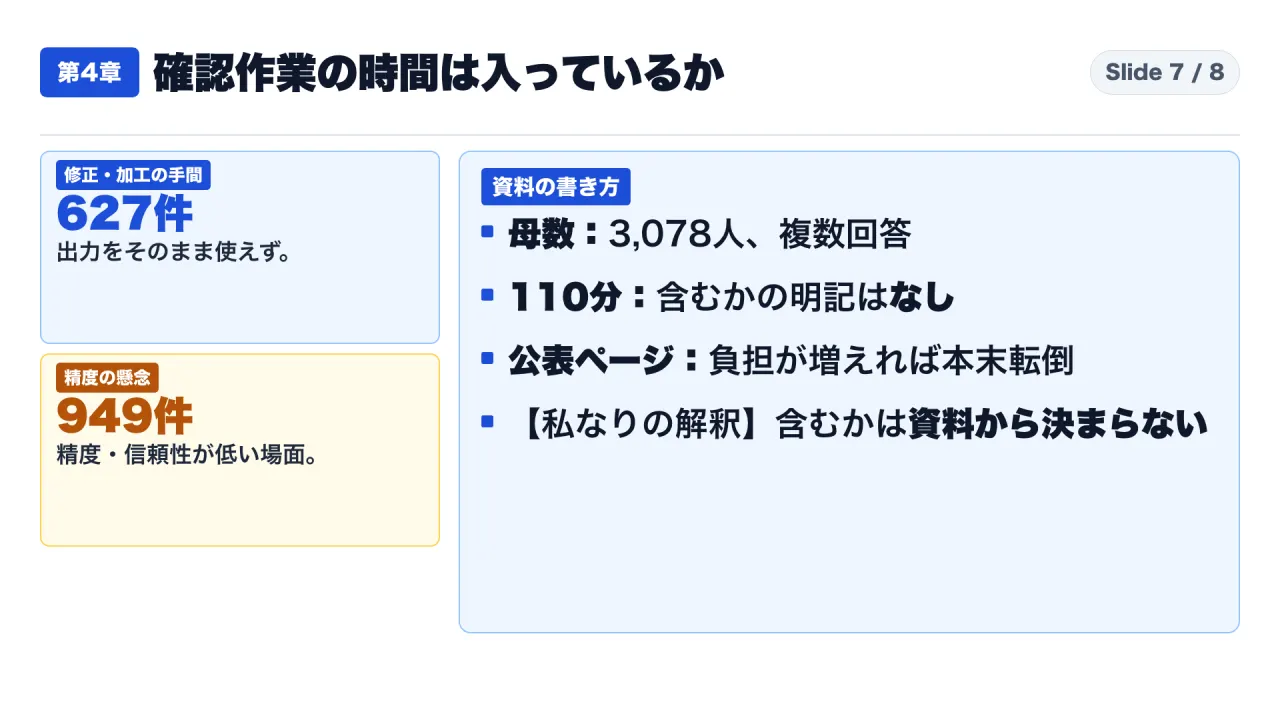
Does the 110-minute figure reflect net time saved after subtracting the effort required to fact-check, verify, and rewrite AI outputs? Official documentation does not specify whether survey prompts instructed respondents to deduct verification overhead.
However, companion survey questions highlight significant post-generation labor across the 3,078 active users:
- Accuracy and Reliability Concerns: 949 respondents reported encountering inaccurate or untrustworthy model responses.
- Post-Editing Friction: 627 respondents reported substantial overhead modifying outputs that could not be used directly.
The Digital Agency noted in its commentary that if civil servants become overwhelmed verifying and correcting AI text, the deployment defeats its own purpose. Whether reported time reductions represent gross drafting acceleration or net productivity after exhaustive human verification remains an unverified empirical question.
Chapter 5: Three Foundational Fallacies in Enterprise AI Planning
When enterprise leadership teams incorporate public statistics into internal business cases, three common cognitive fallacies emerge:
- The Blanket Scaling Fallacy: Multiplying the 1.83-hour active-user average across total headcount, ignoring that 52.2% of the workforce rarely or never uses the system (primarily due to unfamiliarity with operational use cases, cited by 1,166 non-users).
- The Scope Blending Fallacy: Conflating task-level acceleration with overall workday reductions. Saving 20 minutes drafting an initial document does not compress an 8-hour workday if subsequent coordination, compliance reviews, and meetings remain unchanged.
- The “Cashable Savings” Fallacy: Assuming fractional time savings translate into headcount reductions or payroll cuts. In administrative environments, reclaimed minutes are typically absorbed by deeper qualitative review, expanded task backlogs, or shifting work onto AI-proficient staff.
Chapter 6: Five Diagnostic Inquiries for Enterprise ROI Due Diligence
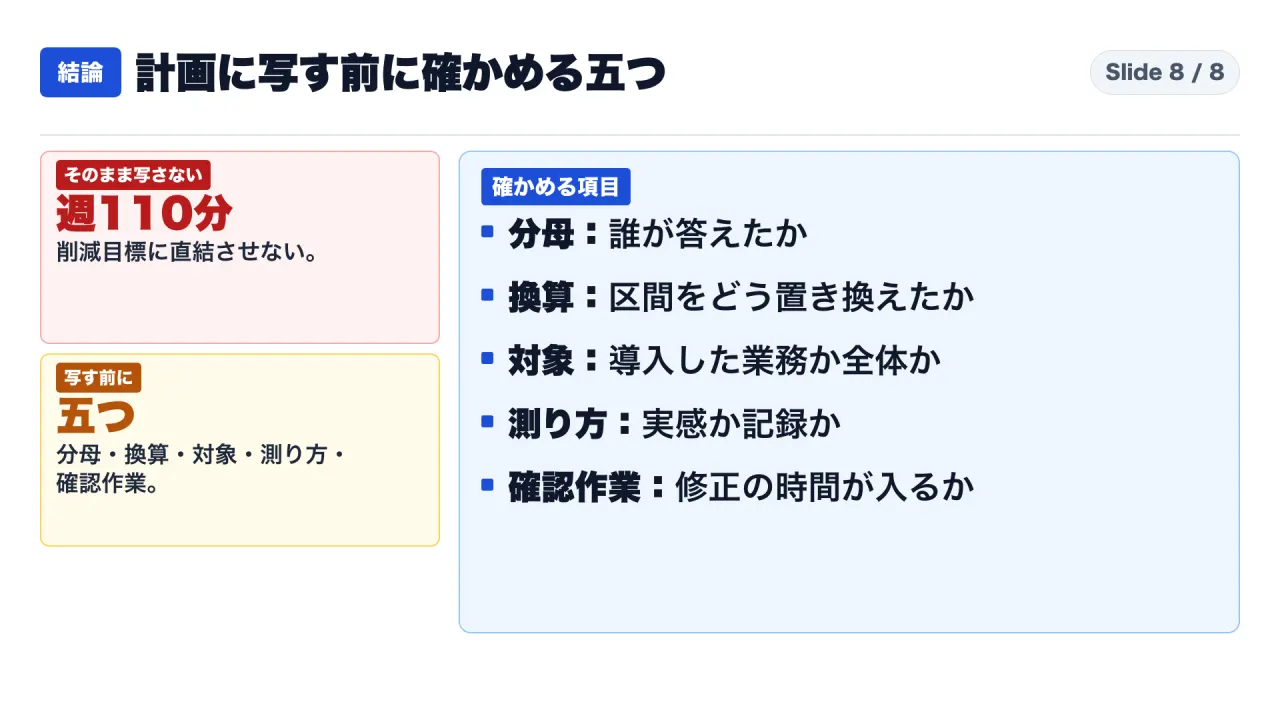
Before enterprise management teams approve capital expenditure or project labor savings based on generative AI surveys, they should apply five diagnostic checks:
- Verify the True Denominator: Confirm whether reported savings reflect the total surveyed workforce or an active user cohort. Always calculate the organization-wide figure by factoring in non-users.
- Examine Interval Imputation Rules: Inquire whether published averages derive from continuous time-tracking logs or midpoint estimates of subjective survey brackets. Conduct lower-bound and upper-bound sensitivity tests.
- Isolate Workflow Scope: Determine whether measured gains reflect end-to-end operational processes or isolated sub-tasks (e.g., initial draft composition).
- Distinguish Perception from Telemetry: Differentiate between subjective user sentiment and objective instrumentation (such as system logs, document completion times, or badge data).
- Deduct Human-in-the-Loop Review Costs: Mandate dedicated time tracking for fact-checking, prompt debugging, and output editing to measure true net productivity.
By applying these five diagnostic inquiries, enterprise leaders can evaluate generative AI case studies objectively—leveraging genuine workflow improvements while avoiding the budgetary trap of unverified headline metrics.
Primary Sources and References
- Digital Agency (Japan): Announcement Regarding the Launch of the Diet Q&A Preparation Support AI Prototype Application (Published October 30, 2026): https://www.digital.go.jp/policies/genai/b736d2d7-b03b-43f0-9932-eba7da7f8142
- Digital Agency (Japan): Results of the 1st Survey on the Utilization Status of Gennai (Government AI) (Published October 30, 2026): https://www.digital.go.jp/policies/genai/f9ed1b1c-b22f-4466-8e50-c1c9adf9f8eb
- Digital Agency (Japan): Diet Q&A Drafting Support AI Application Overview PDF (Published October 30, 2026): https://www.digital.go.jp/assets/contents/node/basic_page/field_ref_resources/b736d2d7-b03b-43f0-9932-eba7da7f8142/9fabae23/20261030_policies_genai_outline_02.pdf
- Digital Agency (Japan): Gennai Utilization Survey 1st Edition Summary Slides PDF (Published October 30, 2026): https://www.digital.go.jp/assets/contents/node/basic_page/field_ref_resources/f9ed1b1c-b22f-4466-8e50-c1c9adf9f8eb/7908367c/20261030_policies_genai_outline_01.pdf
- NHK News: Coverage of Government Diet Q&A Support AI Pilot Rollout (Published October 30, 2026; Referenced for publication date confirmation): https://news.web.nhk/newsweb/na/nd-20261030de68496