Did "AI-Heavy Sectors" Really Double Their Productivity Growth? Reproducing the 5.10% Chart from Official U.S. Macro Data
A data-driven replication of the 2.2% to 5.0% labor productivity trend across Information, Professional Services, and Finance, dissecting output math, headcount declines, and causal attribution limits.
Japanese Edition: Read the original Japanese article on Substack
Video Episode (Japanese Audio): Watch on YouTube
Executive Summary & Key Takeaways
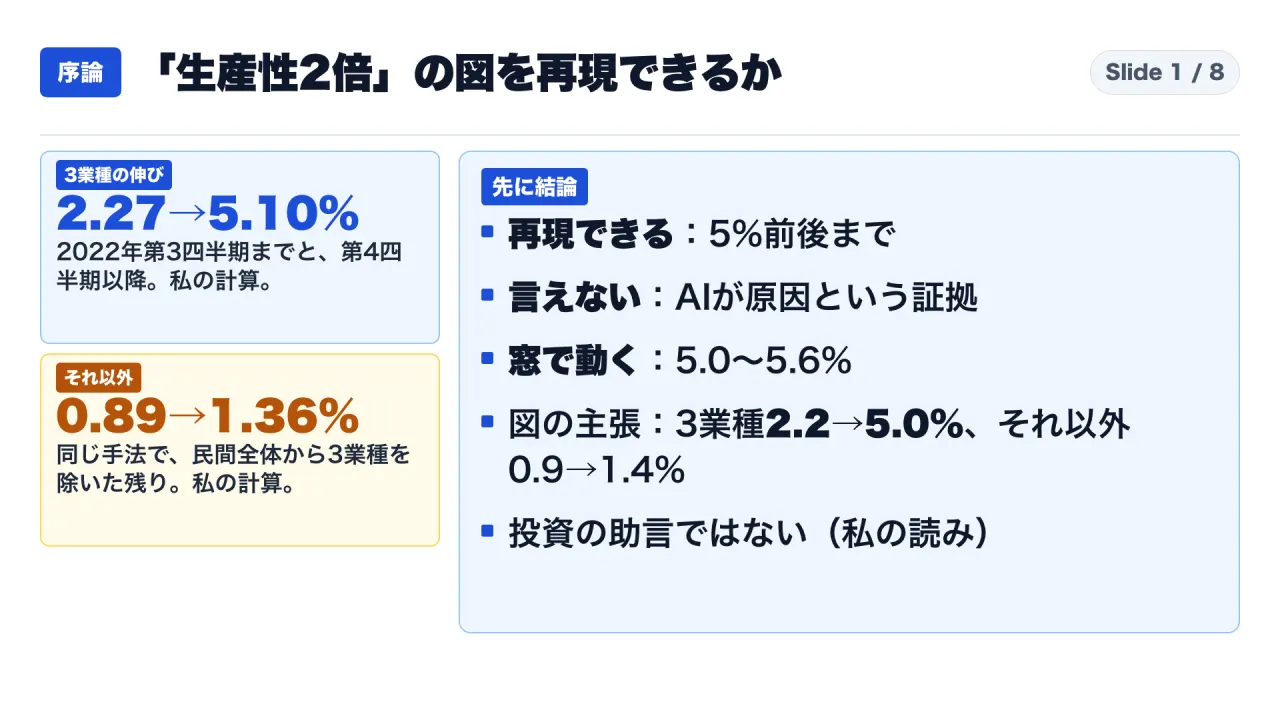
- Core Finding: A viral economic chart asserting that “productivity growth in three AI-heavy sectors has doubled” can be closely replicated using official U.S. macroeconomic datasets. In the author’s independent calculations using Bureau of Economic Analysis (BEA) and Bureau of Labor Statistics (BLS) data, the annualized log-linear productivity trend for Information, Professional and Technical Services, and Finance and Insurance rose from 2.27% (2005 Q1 to 2022 Q3) to 5.10% (2022 Q4 to 2026 Q2). Across the remainder of the private sector, growth rose from 0.89% to 1.36%. These figures closely match the chart’s reported shifts of “2.2% to 5.0%” and “0.9% to 1.4%”.
- The Causality Disconnect: Mathematical reproducibility does not establish AI as the underlying cause. The underlying macroeconomic series do not track enterprise AI utilization. Measured growth varies from 5.0% to 5.6% depending on sample endpoint selection. Growth was driven primarily by an aggregate 20.8% surge in real output while combined payroll headcount in the three sectors contracted by 0.97% (~199,000 employees). Crucially, these same sectors experienced an earlier pandemic surge in 2020–2021 before bottoming in late 2022, creating a cyclical trough that inflates subsequent trend lines.
- Audience & Purpose: Written for enterprise CFOs, chief strategy officers, IT leaders, and business unit heads evaluating corporate AI investment business cases. Leaders must trace the data back to its statistical definitions to avoid embedding macro aggregation artifacts into departmental budgets.
Methodological Framework: Documentation, Computation, and Interpretation
This audit separates three categories of statements:
- Documented Statements (Primary Sources): Figures, definitions, and statements drawn directly from the BEA, BLS, Federal Reserve Bank of San Francisco, and secondary reporting covering the original chart.
- Author Calculations: Mathematical values computed by the author from public FRED time series (e.g., Tornqvist chained aggregates, log-linear trend slopes, and sub-sector headcount differentials).
- Analytical Interpretation: Economic evaluations and corporate planning safeguards formulated by the author.
Primary datasets were retrieved on November 2, 2026, via FRED and the Federal Reserve Bank of San Francisco. The original chart, created on October 25, 2026, by EPB Research, was evaluated via secondary reporting.
Five Questions to Audit Macro Productivity Claims
When evaluating claims that “productivity doubled,” corporate planners should systematically apply five diagnostic questions:
- What is divided by what? Is it revenue per employee, or real value added divided by hours worked?
- Which two points or intervals are being compared? Is the trend a compound annual growth rate (CAGR) or an ordinary least squares (OLS) log-linear slope? Where are the start and end dates anchored?
- Did the numerator or the denominator drive the shift? Did real economic output expand, or did employment contract?
- How did the control group perform over the identical window? Did non-AI sectors accelerate as well due to broader cyclical forces?
- Are the underlying statistics subject to historical revisions? How frequently do national statistical agencies adjust preliminary estimates?
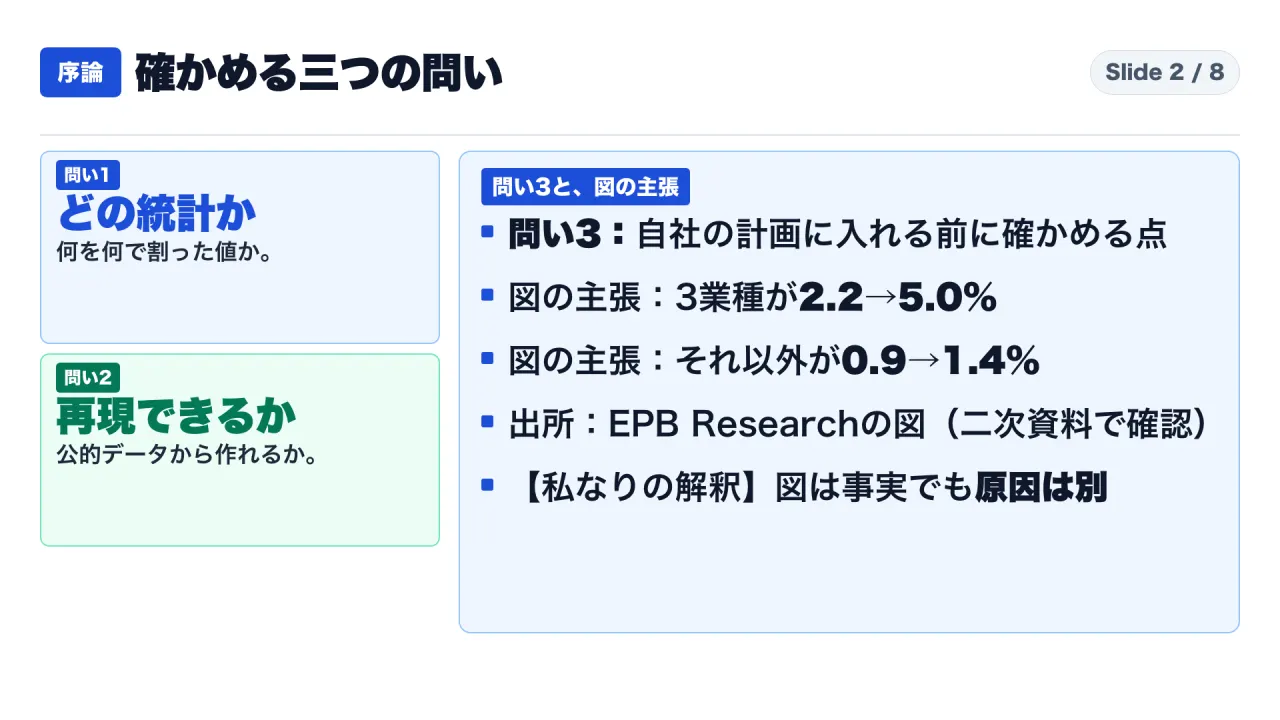
According to secondary reports, the chart titled “Three of the Heaviest AI Adopters Doubled Their Productivity Growth” argues that labor productivity growth across Information, Professional Services, and Finance surged from 2.2% annually (2005–2022) to 5.0% annually after late 2022, while the rest of the private economy advanced from 0.9% to 1.4%.
Section 1: Anatomy of the Metric: Real Value Added Divided by Payroll Employment
In national accounting, the metric used in the chart represents a specific macroeconomic ratio:
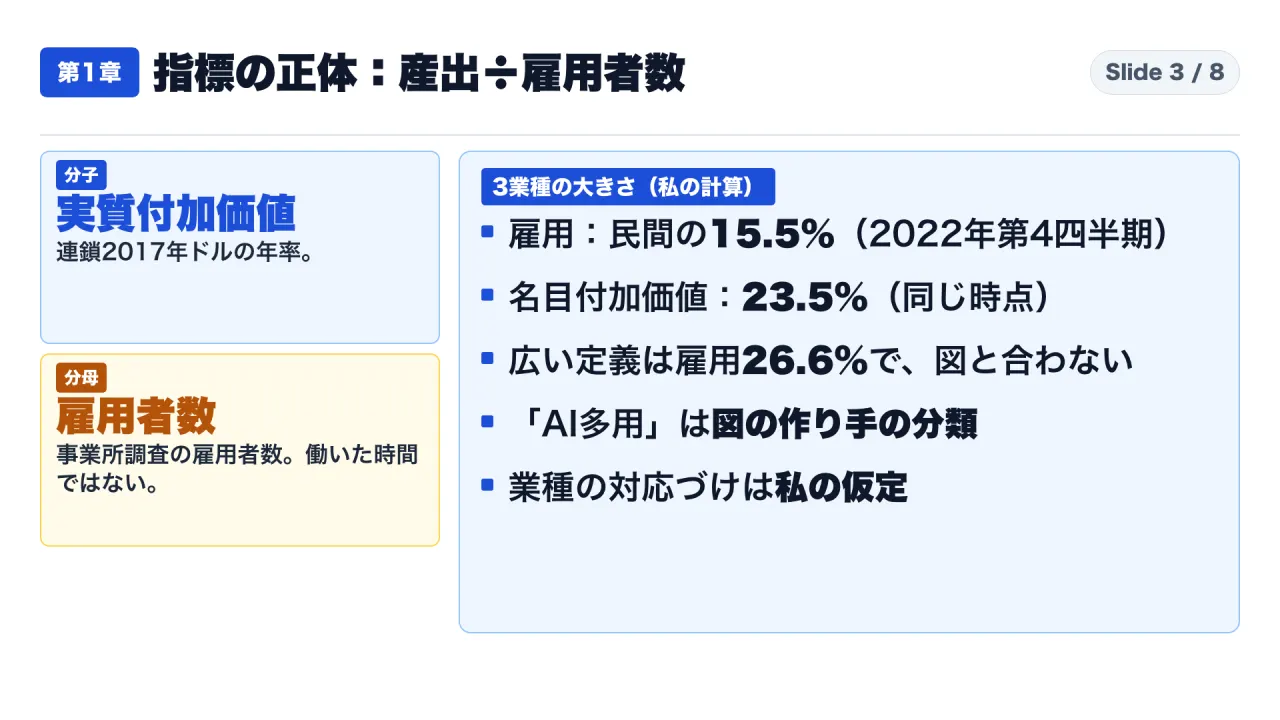
Labor Productivity = Real Value Added (BEA Industry GDP) / All Employees (BLS Payroll Survey)
- Numerator: Real Value Added by Industry, published quarterly by the BEA in chained 2017 dollars (seasonally adjusted annual rate). Value added represents net economic contribution (compensation, taxes, and gross operating surplus).
- Denominator: Total Nonfarm Payroll Employment from the BLS Current Employment Statistics (CES) establishment survey, measured in thousands of persons (seasonally adjusted quarterly averages). Crucially, this measures headcount, not total hours worked.
Sector Scope and Economic Weight
Matching the three sectors to North American Industry Classification System (NAICS) codes yields: Information (NAICS 51), Professional, Scientific, and Technical Services (NAICS 54), and Finance and Insurance (NAICS 52).
In 2022 Q4, these three sectors accounted for 15.5% of private payroll employment and 23.5% of private nominal value added. By 2026 Q2, they represented 15.0% of private employment and 25.6% of nominal value added, closely aligning with secondary summaries reporting “roughly 15% of jobs and 25% of output.”
Broadening sector definitions alters findings substantially:
| Sector Scope Definition | NAICS Industry Groupings Included | Share of Private Jobs (2022 Q4) | Productivity Trend Growth |
|---|---|---|---|
| Narrow Scope (Matches Chart) | Information, Professional/Scientific/Technical, Finance/Insurance | 15.5% | 2.27% -> 5.10% |
| Broad Scope | Information, Total Professional & Business Services, Total FIRE | 26.6% | 1.8% -> 4.3% |
The designation “AI-Heavy” is an external framing. National accounts do not categorize industries by software adoption.
Section 2: Replicating the Trend Lines from Official Datasets
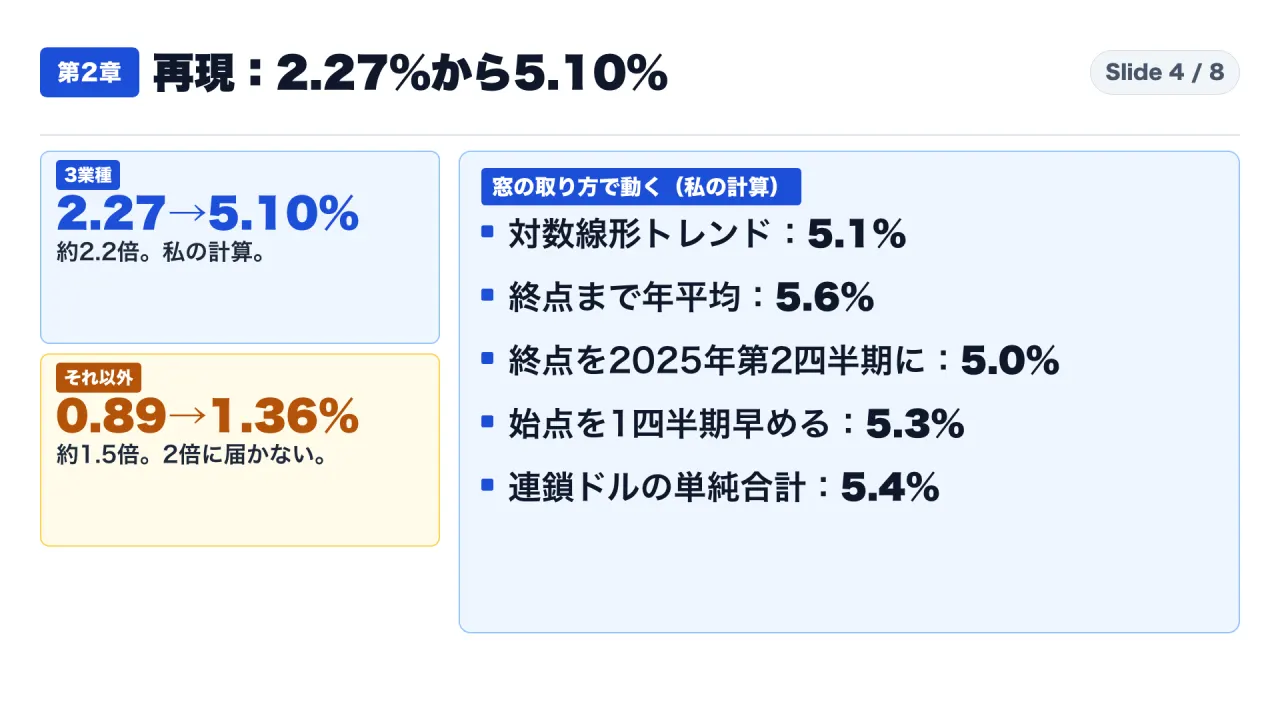
To replicate the chart, sector real value added was divided by quarterly average payroll employment. The three sectors were synthesized using a Tornqvist index weighted by nominal value-added shares. The “Rest of Private” series was derived by subtracting the three sectors from Total Private series. Linear trends were calculated via OLS regression on log index values:
| Period | 3 “AI-Heavy” Sectors (Trend Growth) | Rest of Private Economy (Trend Growth) |
|---|---|---|
| 2005 Q1 to 2022 Q3 | 2.27% | 0.89% |
| 2022 Q4 to 2026 Q2 | 5.10% | 1.36% |
| EPB Research Chart (Secondary Reports) | 2.2% -> 5.0% | 0.9% -> 1.4% |
In ratio terms, 5.10% divided by 2.27% represents a 2.25x acceleration, compared to a 1.53x increase across the rest of the private economy. In percentage points, the three sectors gained +2.83 points, while the broader economy gained +0.47 points.
On an indexed level (2005 Q1 = 100), the three sectors reached 179.3 in 2026 Q2, sitting 13.1% above the pre-2022 trend line (158.5), closely matching secondary reports citing an index level of 179 and a 12.6% premium.
Sensitivity to Measurement Methodology
However, the measured acceleration is sensitive to endpoint selection and aggregation:
| Measurement Methodology | 3-Sector Annualized Growth (Post-2022) |
|---|---|
| Log-linear OLS Trend (2022 Q4 to 2026 Q2) | 5.10% |
| Compound Annual Growth Rate (CAGR: 2022 Q4 to 2026 Q2) | 5.60% |
| CAGR with End Date Anchored to 2025 Q2 | 5.00% |
| CAGR with Start Date Anchored to 2022 Q3 | 5.30% |
| Simple Arithmetic Summation of Real Chained Dollars (OLS Trend) | 5.40% |
Replication confirms that growth sits around 5%, but fixing the exact number to “5.0%” depends on specific window boundaries.
Section 3: Decomposing Output Surge vs. Headcount Contraction
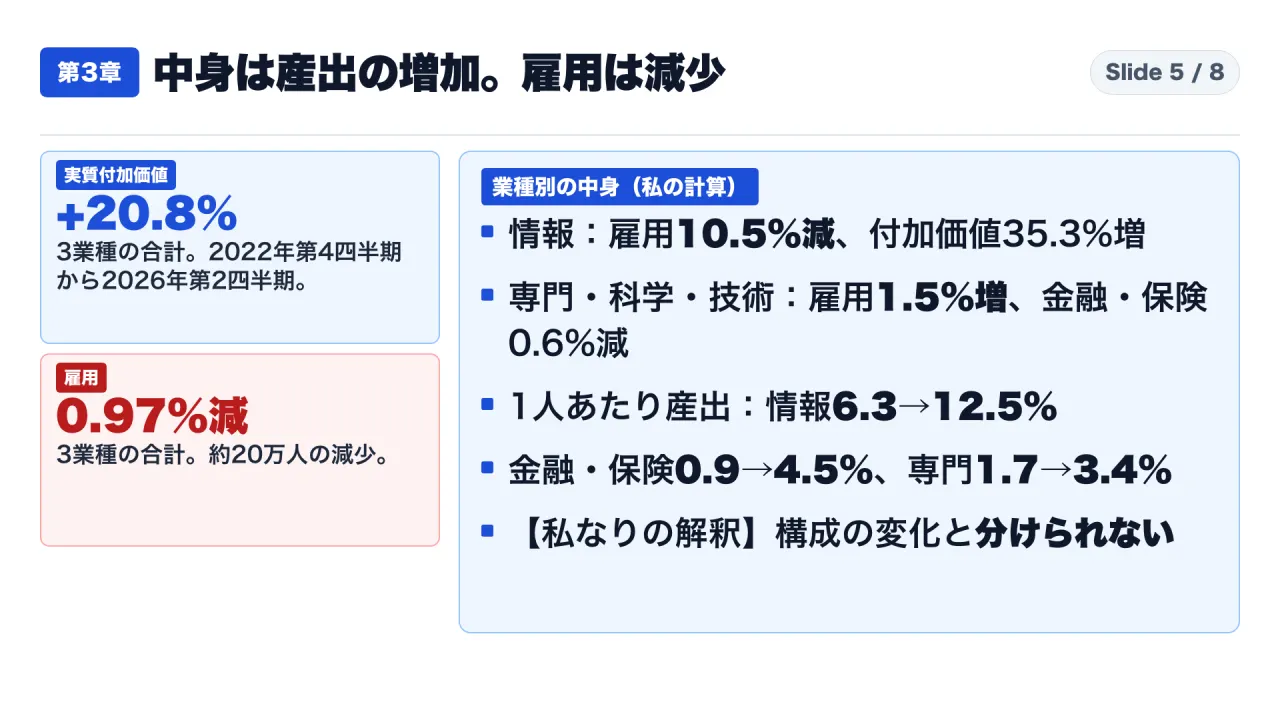
Because labor productivity is an output-to-labor ratio, an increase can stem from expanding output, reducing headcount, or both. Decomposing the two components between 2022 Q4 and 2026 Q2 reveals:
- Real Output: Combined real value added expanded from $5,279.6 billion to $6,379.5 billion (chained 2017 dollars), an increase of +20.8%.
- Labor Input: Combined employment contracted from 20,470,000 to 20,271,000, a reduction of -0.97% (-199,000 employees).
Sub-Sector Divergence
The aggregate numbers mask divergence across the three industries:
| Industry Sector | Employment Shift (2022 Q4 - 2026 Q2) | Real Output Shift (2022 Q4 - 2026 Q2) | Output/Worker CAGR (2005 Q1 - 2022 Q3) | Output/Worker CAGR (2022 Q4 - 2026 Q2) |
|---|---|---|---|---|
| Information (NAICS 51) | -10.48% (-325,000 jobs) | +35.33% (+$545.6B) | 6.3% | 12.5% |
| Finance & Insurance (NAICS 52) | -0.63% (-42,000 jobs) | +15.54% (+$244.6B) | 0.9% | 4.5% |
| Professional & Technical (NAICS 54) | +1.54% (+168,000 jobs) | +13.67% (+$309.7B) | 1.7% | 3.4% |
The Information sector is the primary driver of the chart. Its annualized productivity growth reached 12.5%, propelled by tech industry downsizing that eliminated over 320,000 positions while revenues expanded. In contrast, Professional and Technical Services expanded headcount by 1.5% and posted productivity growth of 3.4%.
Section 4: Cyclical Artifacts and Alternative TFP Benchmarks
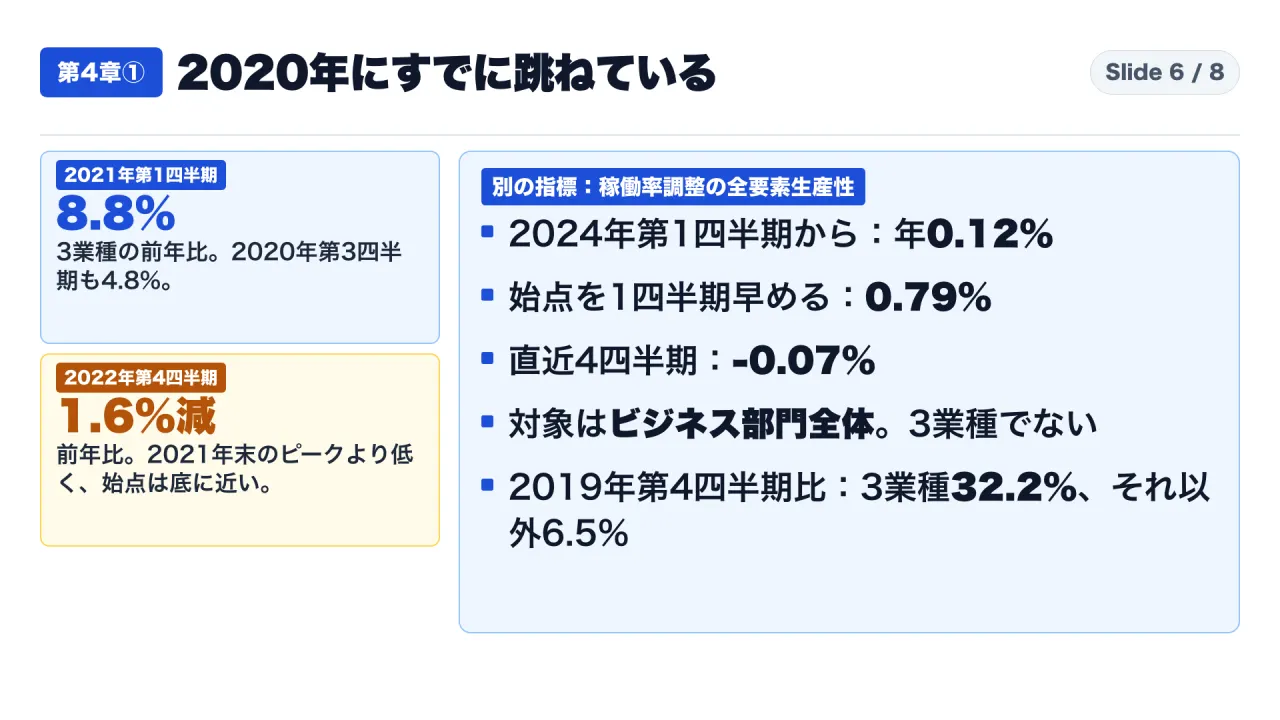
Historical inspection demonstrates that the 2022–2026 surge was not unprecedented. Year-over-year productivity growth in these three sectors surged to +4.8% in 2020 Q3, +8.8% in 2021 Q1, and +8.2% in 2021 Q2.
Following that peak, productivity contracted sharply throughout 2022 (-0.1% YoY in Q2; -1.6% YoY in Q4). Anchoring a trend line in late 2022 places the baseline precisely at the cyclical bottom, amplifying subsequent slopes.
Total Factor Productivity (TFP) Benchmark
Quarterly Total Factor Productivity (TFP) data from the Federal Reserve Bank of San Francisco measures output growth beyond labor and capital accumulation:
| San Francisco Fed TFP Series | Time Window Evaluated | Annualized Average Growth Rate |
|---|---|---|
Utilization-Adjusted TFP (dtfp_util) |
2024 Q1 to 2026 Q2 (10 Quarters) | +0.12% |
Utilization-Adjusted TFP (dtfp_util) |
2023 Q4 to 2026 Q2 (11 Quarters) | +0.79% |
Utilization-Adjusted TFP (dtfp_util) |
2025 Q3 to 2026 Q2 (Trailing 4 Quarters) | -0.07% |
Unadjusted TFP (dtfp) |
2025 Q3 to 2026 Q2 (Trailing 4 Quarters) | +1.42% |
| BLS Business Sector Labor Productivity | 2024 Q1 to 2026 Q2 (10 Quarters) | +2.52% |
Utilization-adjusted TFP growth shifts from 0.12% to 0.79% based on shifting the start date by one quarter. Trailing four-quarter adjusted TFP is flat to negative (-0.07%). If generative AI were already driving a broad structural surge beyond capital deepening, it should be visible in utilization-adjusted TFP.
Four Planning Safeguards Before Budgeting “2x AI Productivity”

Enterprise strategy teams should apply four concrete safeguards:
- Audit Metric Denominators: Do not conflate revenue per employee with output per hour worked. When measuring internal pilot outcomes, track task throughput and total labor hours separately.
- Deconstruct Volume vs. Staffing: Determine whether productivity gains reflect output expansion or headcount reductions. In macro data, tech sector headcount fell by 10.5%; enterprise pilots that increase output without reducing labor hours cannot claim cost savings.
- Control for Base-Year Cyclicality: Ensure enterprise baselines are not measured from unrepresentative periods of crisis or high overtime. Shift evaluation dates by one or two quarters to test stability.
- Anticipate Statistical Revisions: National accounts are continuously revised. The BLS downwardly revised nonfarm payrolls by 31,000 for July and 29,000 for August. Internal business cases must build sensitivity buffers around external macro benchmarks.
Step-by-Step Data Replication Recipe
Anyone can replicate these calculations directly from the FRED database:
- BEA Real Value Added: Information (
RVAI), Professional/Technical (RVAPST), Finance/Insurance (RVAFI), Total Private (RVAPI). - BEA Nominal Value Added: Information (
VAI), Professional/Technical (VAPST), Finance/Insurance (VAFI), Total Private (VAPI). - BLS Employment: Information (
USINFO), Professional/Technical (CES6054000001), Finance/Insurance (CES5552000001), Total Private (USPRIV).
Replication Sequence
- Divide each sector’s quarterly real value added by quarterly average employment.
- Synthesize the three sectors into a Tornqvist chain index using nominal value-added shares.
- Construct the “Rest of Private” index by subtracting the three sectors’ weighted log-changes from Total Private log-changes.
- Fit OLS regressions to the natural logarithm of the indices to derive annualized growth slopes.
- Average the quarterly annualized values of column
dtfp_utilfrom the San Francisco Fed spreadsheet (quarterly_tfp.xlsx).
Conclusion: Facts vs. Causal Claims
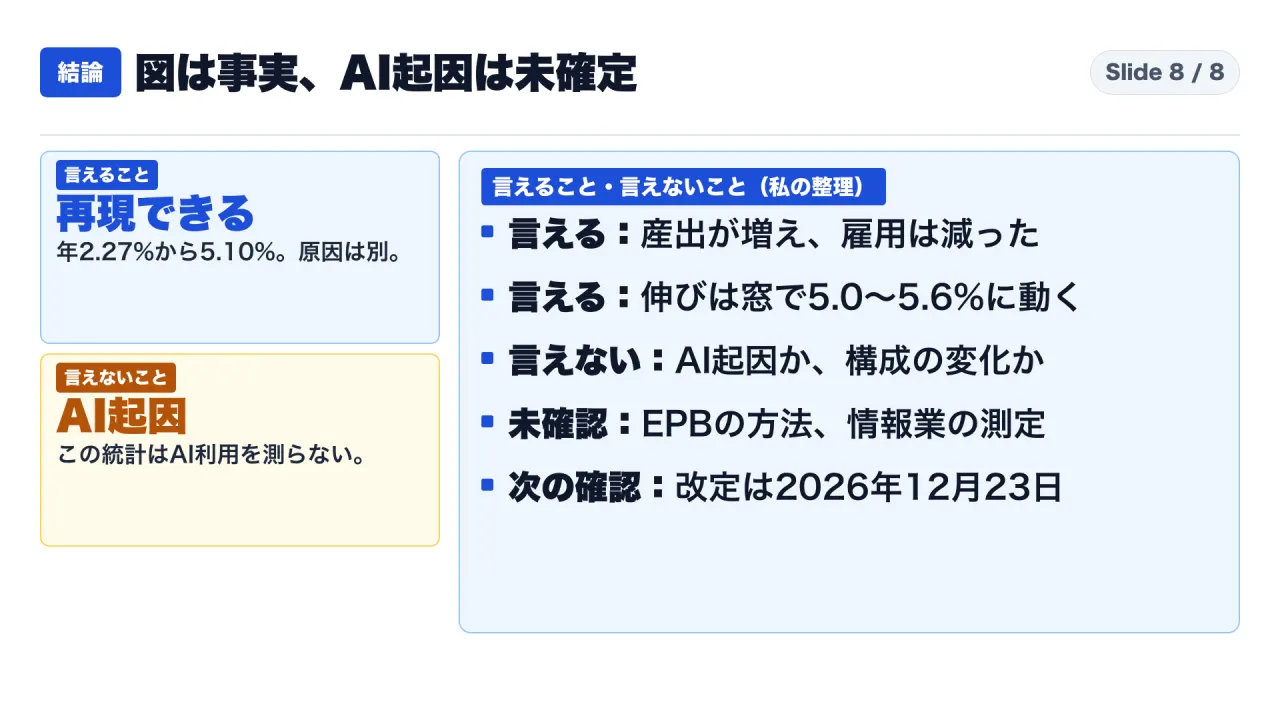
The viral chart’s mathematical claims are valid: output per employee across Information, Professional Services, and Finance accelerated to roughly 5.1% after late 2022.
However, attributing this trend to generative AI conflates correlation with causation. The acceleration was heavily concentrated in the Information sector, where tech industry downsizing eliminated 325,000 jobs, while the starting baseline was anchored to a cyclical low.
Enterprise leaders should use macro charts to understand aggregate trends, but base internal AI investment justifications on local workflow measurements.
Limits of This Investigation
- EPB Research’s proprietary methodologies could not be inspected directly; replication is based on public descriptions.
- Causality cannot be determined from macroeconomic industry aggregates.
- Figures reflect data available on November 2, 2026, and remain subject to future statistical revisions.
Final Verification Checklist
- Verified exact numerator (real value added) and denominator (payroll employment).
- Decomposed output growth (+20.8%) versus labor contraction (-0.97%).
- Tested trend sensitivity across endpoint variations (5.0% to 5.6%).
- Examined historical cyclical patterns and the 2020–2021 pandemic peak.
- Cross-referenced utilization-adjusted Total Factor Productivity benchmarks.
- Published complete time series identifiers for independent verification.
Primary Sources & Documentation Links
- BEA GDP by Industry Data Portal: https://www.bea.gov/data/gdp/gdp-industry
- FRED Real Value Added Information (
RVAI): https://fred.stlouisfed.org/series/RVAI - FRED Real Value Added Professional/Scientific/Technical (
RVAPST): https://fred.stlouisfed.org/series/RVAPST - FRED Real Value Added Finance/Insurance (
RVAFI): https://fred.stlouisfed.org/series/RVAFI - FRED Real Value Added Total Private (
RVAPI): https://fred.stlouisfed.org/series/RVAPI - FRED Payroll Employment Information (
USINFO): https://fred.stlouisfed.org/series/USINFO - FRED Payroll Employment Professional/Technical (
CES6054000001): https://fred.stlouisfed.org/series/CES6054000001 - FRED Payroll Employment Finance/Insurance (
CES5552000001): https://fred.stlouisfed.org/series/CES5552000001 - FRED Payroll Employment Total Private (
USPRIV): https://fred.stlouisfed.org/series/USPRIV - FRED Nominal Value Added Information (
VAI): https://fred.stlouisfed.org/series/VAI - FRED Nominal Value Added Professional/Technical (
VAPST): https://fred.stlouisfed.org/series/VAPST - FRED Nominal Value Added Finance/Insurance (
VAFI): https://fred.stlouisfed.org/series/VAFI - FRED Nominal Value Added Total Private (
VAPI): https://fred.stlouisfed.org/series/VAPI - Federal Reserve Bank of San Francisco Quarterly TFP Data: https://www.frbsf.org/research-and-insights/data-and-indicators/total-factor-productivity-tfp/
- BLS Employment Situation Summary (September 2026): https://www.bls.gov/news.release/empsit.nr0.htm
- Secondary Business Analysis Reporting on EPB Research Chart: https://fourweekmba.com/ai-heavy-sectors-productivity-trend-hits-5-rest-at-1-4/