Revenue Rose 40.3% Quarter-over-Quarter, Guidance Projecting 0.8%: Reading Kioxia Earnings and What the Filings Omit
A financial audit of Kioxia Holdings Q2 FY2026 earnings release, examining rapid revenue expansion, single-point flat guidance, operating cash flow adjustments, and omitted metrics.
Japanese Edition: Read the original Japanese article on Substack
Video Episode (Japanese Audio): Watch on YouTube
Executive Summary: Explosive Accrual Growth vs. Single-Point Plateau Guidance
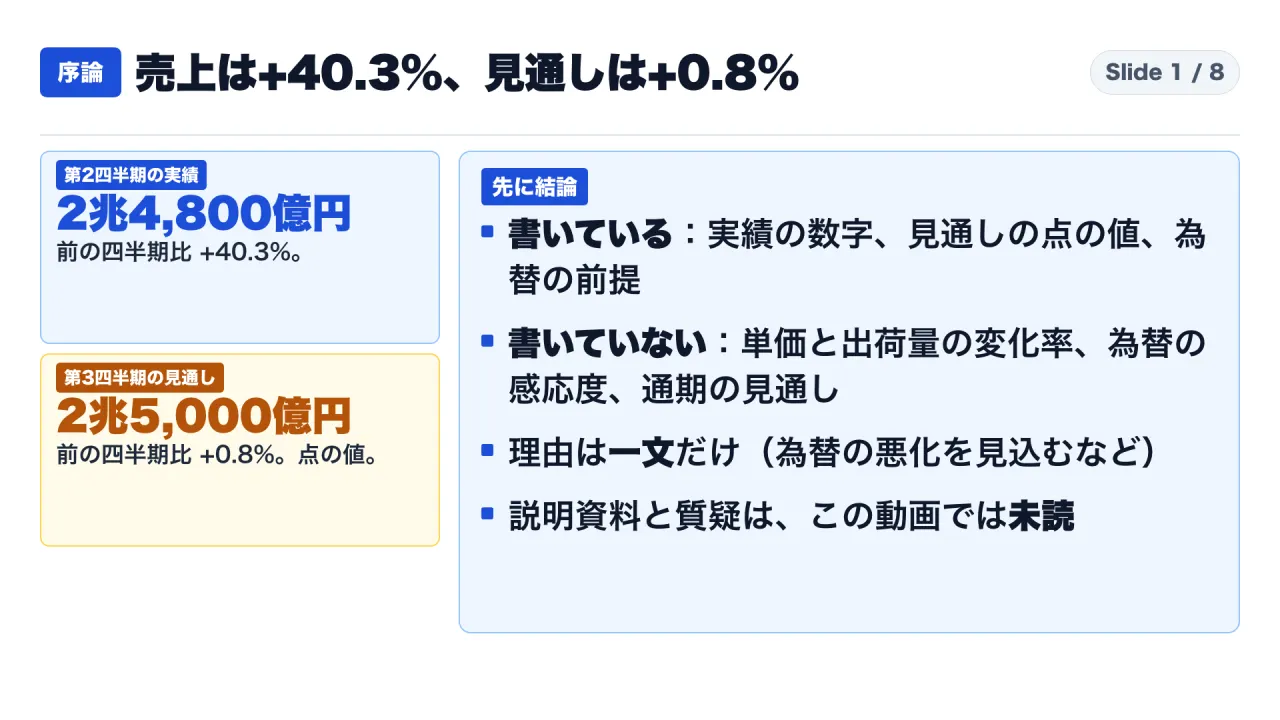
On October 30, 2026, Kioxia Holdings Corporation published consolidated financial results for Q2 FY2026 (July through September 2026) under IFRS. The filing revealed an extraordinary financial inflection: quarterly revenue reached 2,480.0 billion yen (approximately 16.0 billion US dollars at 155 JPY/USD), representing a 40.3% sequential expansion over the preceding quarter (author calculation).
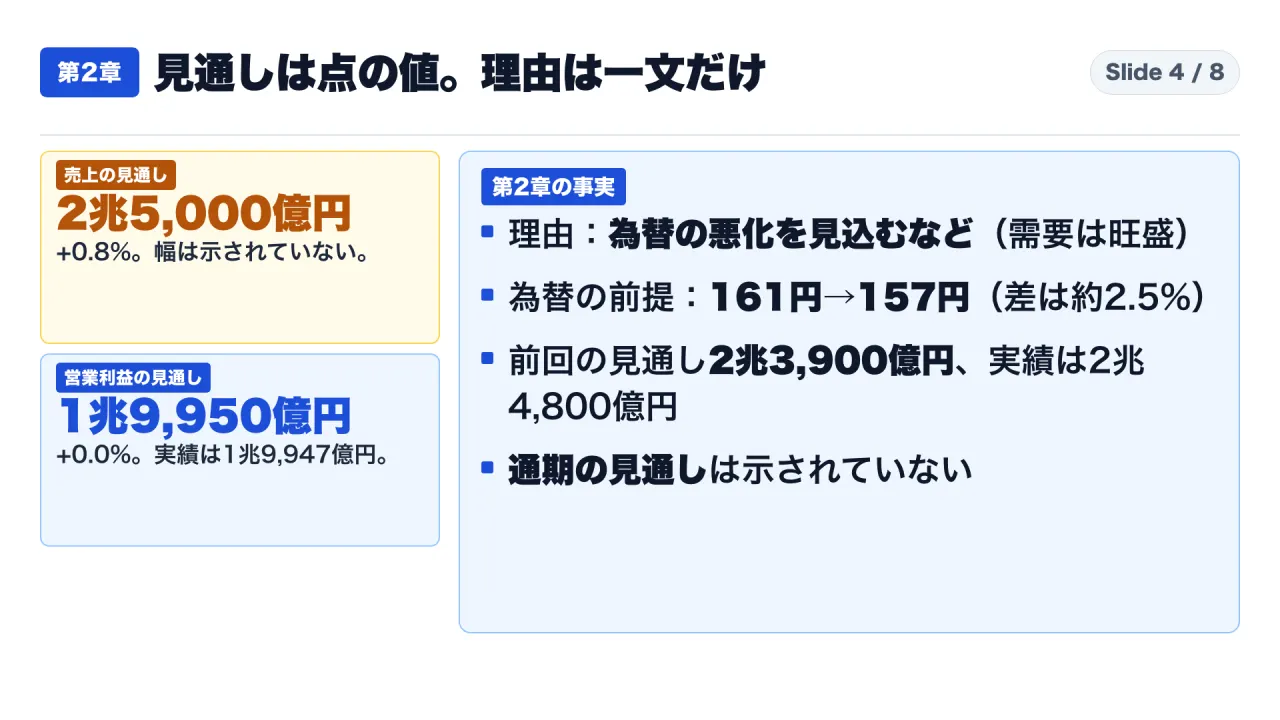
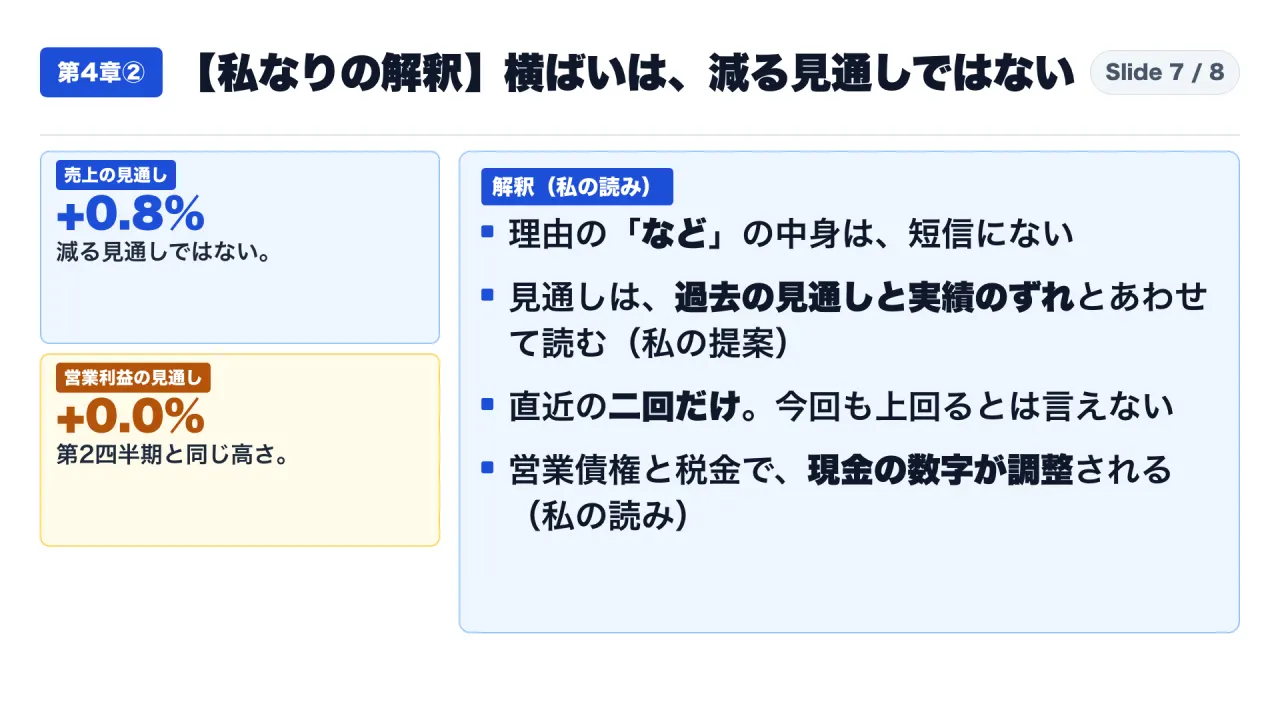
In contrast to this trailing growth rate, management forward guidance for Q3 FY2026 (October through December 2026) projected revenue of 2,500.0 billion yen, an increase of merely 0.8% quarter-over-quarter. Operating profit guidance was established at 1,995.0 billion yen, representing a 0.0% growth rate relative to actual Q2 operating profit of 1,994.7 billion yen.
The earnings release offers exactly one sentence explaining this plateau: “While demand for data center applications is expected to remain strong, reflecting expected foreign exchange deterioration and other factors, performance is projected at a level comparable to the second quarter of the fiscal year ending March 31, 2027.”
Management provided single-point estimates with zero upper or lower target boundaries and omitted full-year financial forecasts entirely. Furthermore, fundamental operating variables—including average selling price (ASP) changes, bit shipment growth rates, foreign exchange sensitivities per yen of currency movement, and pricing vs. volume revenue breakdowns—were absent from the earnings release.
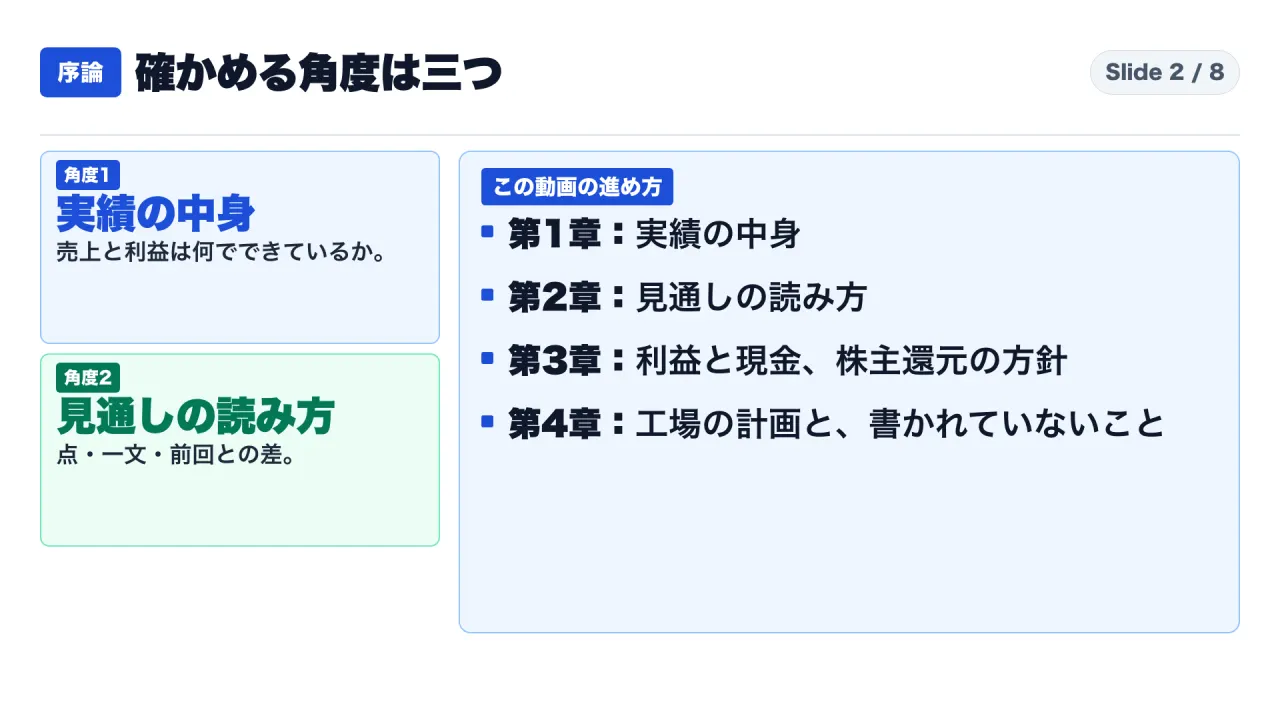
For corporate procurement leads, financial analysts, and enterprise planners evaluating supplier stability, this analysis establishes three analytical capabilities:
- Deconstructing corporate guidance structure by distinguishing single-point estimates from range-bound forecasts and evaluating narrative justifications.
- Comparing historical guidance projections against realized actuals across prior reporting cycles.
- Reconciling the gap between accrual operating profit and realized operating cash flow through changes in working capital and tax liabilities.
Methodological Boundaries: Documented Records, Author Calculations, and Interpretation
This audit categorizes all statements into three tiers:
- Documented Records: Explicit figures, disclosures, and notes published in official Kioxia timely disclosure releases, financial statements, and corporate announcements.
- Author Calculations: Mathematical percentages, quarter-over-quarter deltas, margin ratios, and currency conversions calculated directly from published figures.
- Author Interpretation: Structural deductions, analytical frameworks, and procurement guidance synthesized by the author, explicitly labeled as interpretative analysis.
The term “omitted” is applied strictly to variables where an exhaustive text search of the official Q2 earnings release yielded zero mentions. For example, terms such as “bit,” “sensitivity,” “range,” and “full-year” registered zero occurrences within the main body of the release.
Foundational Accounting Terminology and Reporting Primitives
Evaluating Kioxia disclosures requires reviewing core corporate finance primitives under IFRS:
- Financial Results Release (Kessan Tanshin): The timely disclosure document released by Japanese corporations summarizing quarterly performance.
- Fiscal Calendar: Kioxia operates on an April 1 to March 31 fiscal year. Q2 FY2026 represents July 1 to September 30, 2026; the first half (H1) represents April 1 to September 30, 2026.
- Operating Margin: Operating profit divided by revenue, presented here as author calculations as percentage margins are omitted from summary tables.
- Non-GAAP Operating Profit: An internal management metric adjusting IFRS operating profit by excluding one-time items; unreviewed by independent auditors.
- Trade Receivables: Uncollected commercial billing balances resulting from product sales (
trade and other receivables). - Operating Cash Flow: Net cash generated from primary commercial operations.
- Equity Ratio: Ratio of equity attributable to owners of the parent relative to total assets.
- Stock Split: Kioxia executed a 3-for-1 common stock split effective October 1, 2026.
Section 1: Dissecting Reported Performance: Accrual Revenue Surges Across Four Quarters
Examining Kioxia consolidated revenue across trailing quarters demonstrates extraordinary commercial momentum:
| Reporting Period | Calendar Months | Consolidated Revenue | QoQ Change (Author Calculation) |
|---|---|---|---|
| FY2025 Third Quarter | October to December 2025 | 543.6 billion yen | Baseline |
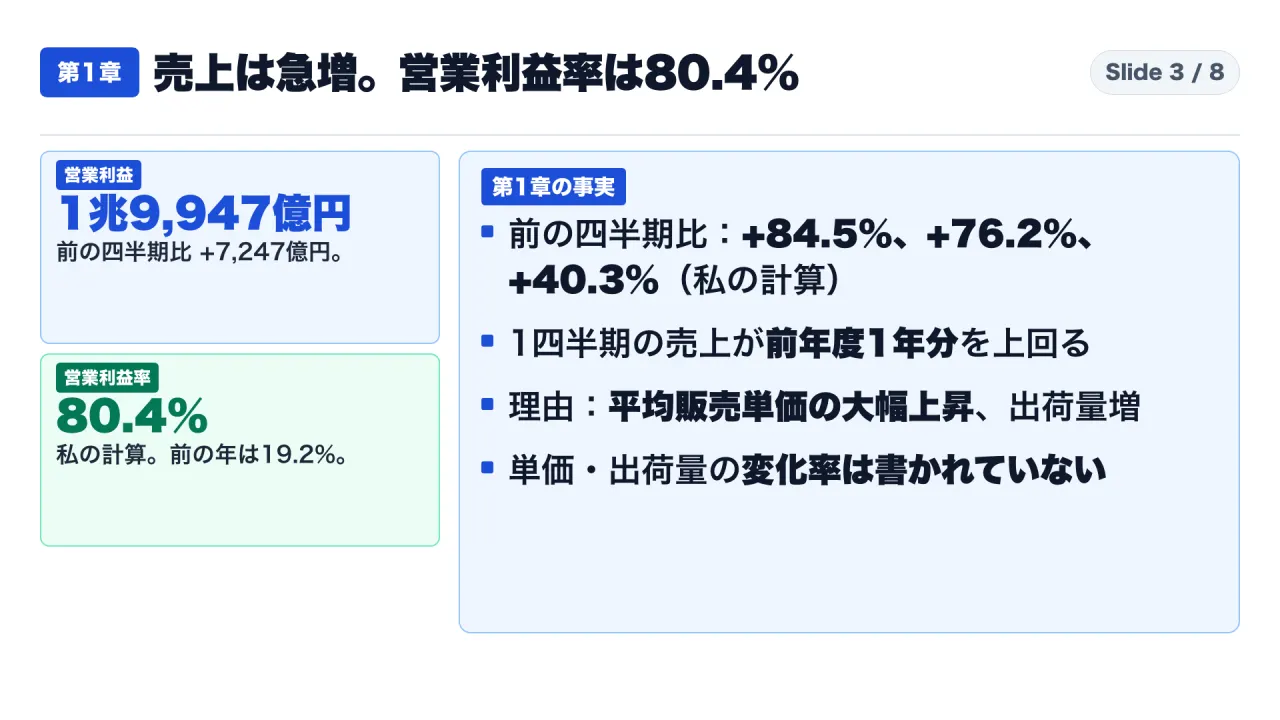
| FY2025 Fourth Quarter | January to March 2026 | 1,002.9 billion yen | +84.5% |
| FY2026 First Quarter | April to June 2026 | 1,767.1 billion yen | +76.2% |
| FY2026 Second Quarter | July to September 2026 | 2,480.0 billion yen | +40.3% |
To contextualize this scale: Kioxia consolidated revenue for the entire twelve months of FY2025 was 2,337.6 billion yen. In Q2 FY2026 alone, three months of commercial shipments (2,480.0 billion yen) exceeded full-year revenue from the preceding fiscal year.
In Q2 FY2026, operating profit reached 1,994.7 billion yen, expanding by 724.7 billion yen quarter-over-quarter. Author calculation establishes an operating profit margin of 80.4%, compared to 19.2% in the prior-year comparative quarter (Q2 FY2025). Gross profit margin reached 82.8%. Q2 revenue expanded roughly 5.5x compared to the prior-year quarter (2,480.0 billion yen vs. 453.6 billion yen).
By product segment:
- SSD & Storage revenue totaled 1,616.0 billion yen, accounting for 65.2% of total revenue.
- Smart Devices generated 788.9 billion yen.
Across the first half (April through September 2026), consolidated revenue totaled 4,247.2 billion yen (up 436.8% year-over-year), while operating profit reached 3,264.7 billion yen. This operating profit included a 36.6 billion yen litigation loss provision in Q1. Non-GAAP operating profit reached 3,314.5 billion yen, exactly 49.8 billion yen higher than IFRS operating profit.
Management attributed revenue expansion to robust demand from data center customers centered on generative AI workloads, citing substantial increases in average selling prices (ASP) and expanded storage shipment volumes. However, the filing provides zero percentages quantifying ASP expansion or bit shipment growth.
Section 2: Forward Guidance Architecture: Single-Point Estimates and Missing Explanations
For Q3 FY2026 (October through December 2026), management established forward guidance:
- Revenue: 2,500.0 billion yen (+0.8% QoQ).
- Operating Profit: 1,995.0 billion yen (+0.0% QoQ, representing a 0.3 billion yen increase over Q2 actual of 1,994.7 billion yen).
- Non-GAAP Operating Profit: 2,000.0 billion yen (+0.6% QoQ).
Every guidance figure is presented as an exact point value with zero upper or lower range bounds. Management narrative explanation consists entirely of a single sentence attributing the flat performance to expected foreign exchange deterioration and other factors despite strong data center demand.
Currency assumptions establish a baseline: realized exchange rate in Q2 was 161 JPY/USD, whereas Q3 guidance assumes 157 JPY/USD—a projected appreciation of 4 yen per dollar (~2.5%).
However, the filing omits foreign exchange sensitivity data. The document does not disclose operating profit variance caused by a 1-yen shift in the exchange rate, nor the proportion of revenue denominated in US dollars. Consequently, external analysts cannot verify what portion of the projected plateau is driven by currency shifts versus underlying unit volume or pricing deceleration.
Author calculation indicates that projected revenue growth (20.0 billion yen) minus projected operating profit growth (0.3 billion yen) implies an anticipated cost expansion of 19.7 billion yen. The filing does not identify the operational nature of these expected expenses.
Evaluating past forecast accuracy reveals that management exceeded guidance across the two preceding reporting periods:
| Target Quarter | Revenue Guidance | Realized Actual Revenue | Variance (Author Calculation) | Initial Guidance Source |
|---|---|---|---|---|
| Q1 FY2026 (Apr-Jun 2026) | 1,750.0 billion yen | 1,767.1 billion yen | +17.1 billion yen (+1.0%) | FY2025 Release (May 15, 2026) |
| Q2 FY2026 (Jul-Sep 2026) | 2,390.0 billion yen | 2,480.0 billion yen | +90.0 billion yen (+3.8%) | Q1 FY2026 Release (July 31, 2026) |
In Q2, operating profit exceeded guidance by 104.7 billion yen (+5.5%), while realized foreign exchange (161 JPY/USD) closely matched management 162 JPY/USD assumption. However, two consecutive quarters of guidance outperformance do not guarantee future overachievement. Full-year FY2026 guidance was entirely omitted due to short-term volatility.
Section 3: Reconciling Cash Flow: Working Capital Accumulation and Tax Timing
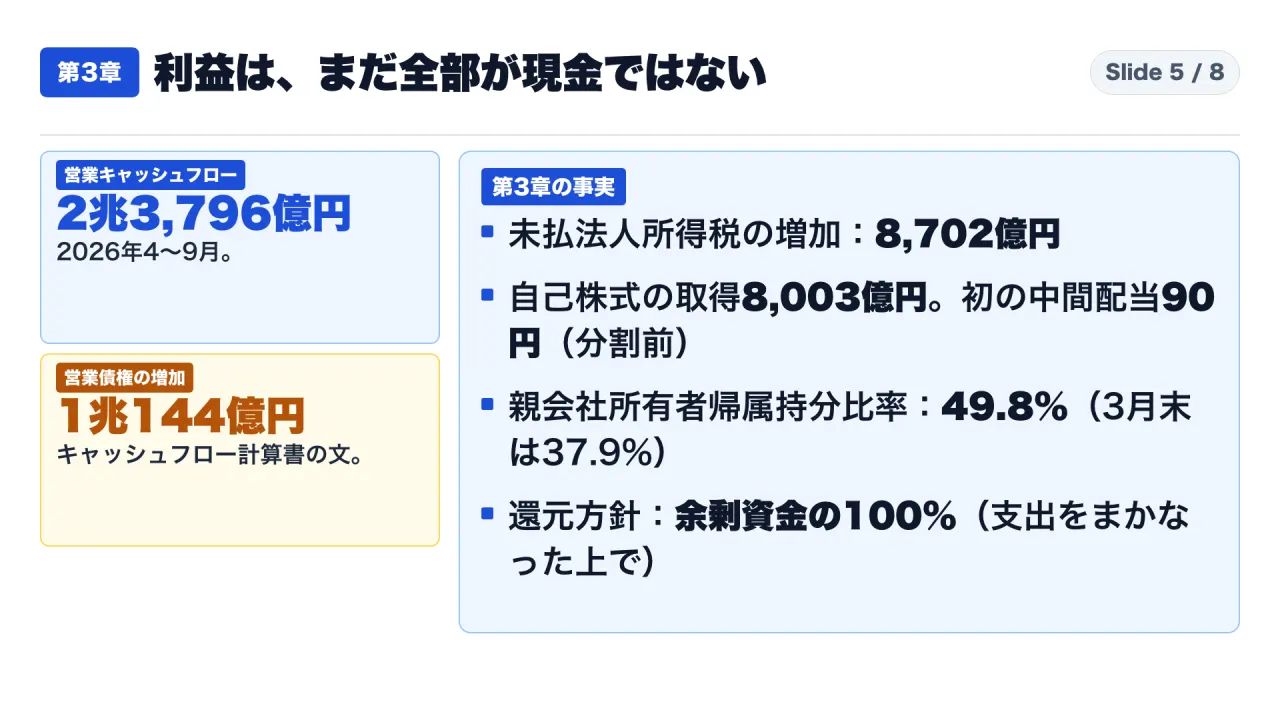
Accrual profitability diverged from realized cash generation during the first half of FY2026:
- Consolidated Pre-Tax Profit: 3,203.4 billion yen.
- Net Operating Cash Flow: 2,379.6 billion yen.
The primary mechanism explaining this 823.8 billion yen difference is the expansion of trade receivables. Working capital absorbed 1,014.4 billion yen due to increased trade receivables, compared to a 4.2 billion yen cash contribution in the prior-year comparative period.
Author calculation shows that the ratio of trade receivables to quarterly revenue remained stable: 65.9% at March 31, 2026, and 66.5% at September 30, 2026. This indicates that receivables expanded proportionally with rapid revenue scaling rather than reflecting deteriorating customer payment velocity.
Simultaneously, balance sheet liabilities expanded due to accrued income taxes. First-half income tax expenses totaled 1,005.5 billion yen, whereas physical cash taxes paid totaled only 110.7 billion yen. Unpaid income taxes payable on the balance sheet increased by 870.2 billion yen, reaching 974.7 billion yen at period end. Operating cash flow reflects physical liquidity generated prior to cash settlement of these statutory tax liabilities.
Kioxia balance sheet demonstrated significant liquidity reinforcement:
- Cash and Cash Equivalents: 1,397.3 billion yen.
- Total Interest-Bearing Debt: 802.7 billion yen (bonds, borrowings, and lease liabilities, by author calculation).
- Net Cash Surplus: 594.6 billion yen (1,397.3 minus 802.7 billion yen).
- Ratio of Equity Attributable to Owners of Parent: 49.8%, up 11.9 percentage points from 37.9% at March 31, 2026.
Financing cash outflows included 800.3 billion yen allocated to share repurchases and 523.1 billion yen dedicated to long-term debt repayments. Management declared an inaugural interim dividend of 90 yen per share (pre-split baseline, corresponding to 30 yen post-split), totaling approximately 47.9 billion yen. Shareholder return policies established a framework targeting return of 100% of medium-term surplus capital via progressive dividends and flexible share repurchases after satisfying capital expenditures and maintaining net cash solvency.
Section 4: Capital Expenditure Roadmaps and Fab Construction Constraints
Long-term fabrication capacity expansions remain bound by external prerequisites:
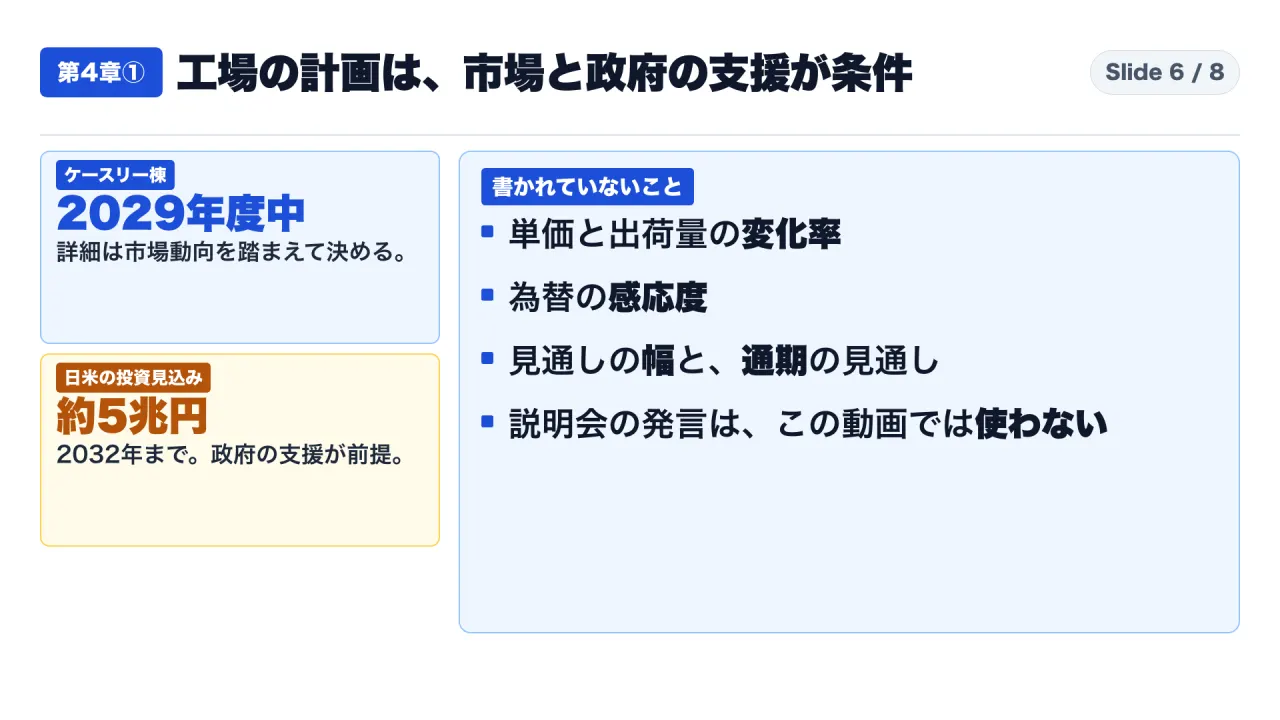
- Kitakami Plant K3 Facility: On August 27, 2026, Kioxia announced site preparation for the K3 manufacturing building in Kitakami, Iwate Prefecture, targeting operational startup during FY2029. Management explicitly stipulated that final construction timelines and cleanroom equipment procurement depend upon prevailing semiconductor market conditions and Japanese governmental financial subsidies.
- SanDisk Joint Venture Investment: Concurrently, Kioxia and SanDisk Corporation announced joint investment plans anticipating up to 5.0 trillion yen (over 31 billion US dollars) in advanced memory capacity across Yokkaichi and Kitakami through 2032, contingent upon governmental subsidy execution.
Critically, the Q2 earnings release contains zero data regarding near-term wafer fabrication capacity additions. Terms such as “production capacity” and “supply capacity” registered zero occurrences within the filing text.
Summary of parameters omitted from the Q2 release:
- ASP and bit shipment growth percentages.
- Foreign exchange sensitivity per yen movement.
- Full-year financial guidance and year-end dividend projections.
- Upper and lower guidance bounds.
- Revenue variance decomposition across price, volume, and currency.
Section 5: Analytical Interpretation: What “Flat” Guidance Signals to Enterprise Buyers
Synthesizing public disclosures highlights four critical conclusions:
- Flat Does Not Signal Demand Collapse: Guidance of +0.8% revenue and 0.0% operating profit indicates operational stabilization at historically elevated profit levels (80% operating margin), rather than an imminent cyclical downturn.
- Sequential Growth Satiation: Growth rates of 84.5%, 76.2%, and 40.3% naturally encounter physical fab utilization ceilings. In the memory industry, sustained 40%+ sequential growth cannot continue indefinitely without new cleanroom capacity.
- Vulnerability to Currency Shifts: When corporate guidance projects zero operating profit growth, minor currency appreciations can shift quarterly results into negative growth territory.
- Working Capital Lag: Rapid revenue scaling inherently ties up liquidity in uncollected trade receivables and deferred tax liabilities.
Executive Implementation Framework: Auditing Semiconductor Supplier Filings
Enterprise procurement executives and corporate planners evaluating component suppliers should enforce a five-step earnings audit:
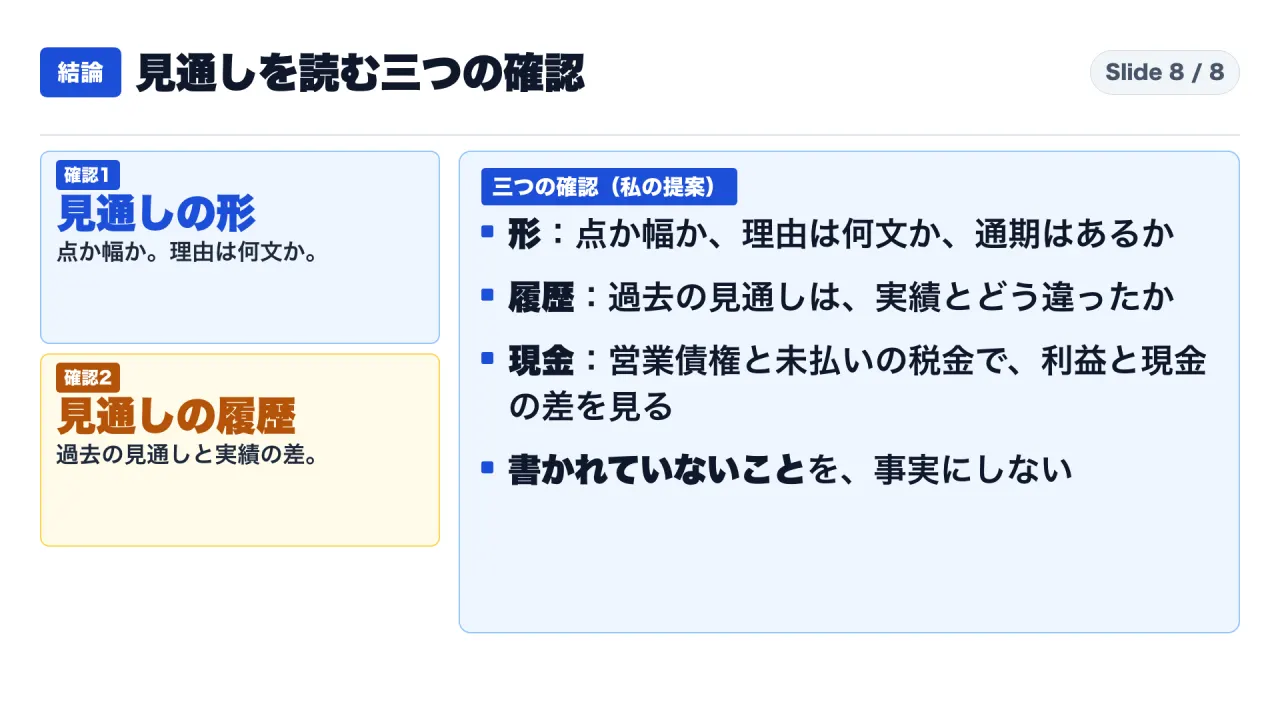
- Analyze Guidance Form: Determine whether forward targets are framed as point estimates or ranges, and audit narrative explanations.
- Track Forecast History: Compile a historical variance ledger tracking guidance vs. actuals over consecutive quarters to assess forecasting conservatism.
- Audit Omitted Variables: Maintain an explicit checklist of unstated operational metrics (ASP, bit growth, FX sensitivity) and avoid assuming unstated figures represent positive execution.
- Reconcile Cash vs. Accrual Profits: Evaluate trade receivables growth relative to revenue to confirm whether customer payment collections remain healthy.
- Establish Multi-Scenario Procurement Models: Construct three operational planning scenarios (flat baseline, upward deviation, and downward margin compression) rather than anchoring procurement contracts to single-point vendor guidance.
Frequently Asked Questions
Q: Does flat guidance indicate that generative AI memory demand is weakening? A: No. Management explicitly states that data center demand remains robust. The projected plateau reflects foreign exchange headwinds and high baseline capacity utilization.
Q: Did Kioxia report “record-high” financial results? A: While Q2 revenue (2,480.0 billion yen) exceeded full-year FY2025 revenue, the phrase “record high” does not appear in official regulatory documents.
Q: Is the discrepancy between operating profit and operating cash flow concerning? A: The gap is primarily explained by a 1,014.4 billion yen increase in trade receivables and an 870.2 billion yen increase in unpaid accrued taxes. The receivables-to-revenue ratio remained stable at 66.5%, indicating healthy commercial scaling.
Primary Reference Documentation
- Kioxia Holdings Consolidated Financial Results for Q2 FY2026 (IFRS, October 30, 2026): https://ssl4.eir-parts.net/doc/285A/tdnet/2902676/00.pdf
- Kioxia Holdings Shareholder Return Policy and Interim Dividend Notice (October 30, 2026): https://ssl4.eir-parts.net/doc/285A/tdnet/2878649/00.pdf
- Kioxia Holdings Consolidated Financial Results for Q1 FY2026 (IFRS, July 31, 2026): https://ssl4.eir-parts.net/doc/285A/tdnet/2859905/00.pdf
- Kioxia Holdings Consolidated Financial Results for FY2025 (IFRS, May 15, 2026): https://ssl4.eir-parts.net/doc/285A/tdnet/2815552/00.pdf
- Kioxia Holdings SanDisk Joint Investment Announcement (August 27, 2026): https://ssl4.eir-parts.net/doc/285A/tdnet/2878649/00.pdf
- Kioxia Holdings Kitakami Plant K3 Facility Construction Announcement (August 27, 2026): https://www.kioxia.com/ja-jp/about/news/2026/20260827-2.html