Why Grab's 42% AI Cost Reduction Cannot Be Blindly Copied as an Enterprise Metric: Inside Unit Economics, Volume Surge, and Q3 2026 Earnings
A forensic financial analysis of Grab Q3 2026 SEC filings, dissecting the 42% drop in cost per interaction, a 60% volume surge, driver earnings claims, and rising enterprise cloud spending.
Japanese Edition: Read the original Japanese article on Substack
Video Episode (Japanese Audio): Watch on YouTube
Executive Summary: Deconstructing Enterprise AI Efficiency Metrics
When prominent technology corporations report dramatic artificial intelligence efficiency gains in quarterly earnings calls—such as “cutting AI costs by 40%” or “boosting frontline productivity by 10%”—enterprise IT leaders and finance controllers face immediate board pressure to reproduce identical metrics.
In early November 2026, Southeast Asian super-app operator Grab Holdings Limited (NASDAQ: GRAB) published its third-quarter 2026 financial results. During the investor presentation, Grab’s Chief Executive Officer highlighted a notable operational milestone: cost per AI interaction fell 42% quarter-over-quarter (QoQ), while total AI interactions across merchant partners, drivers, and consumers grew 60% QoQ.
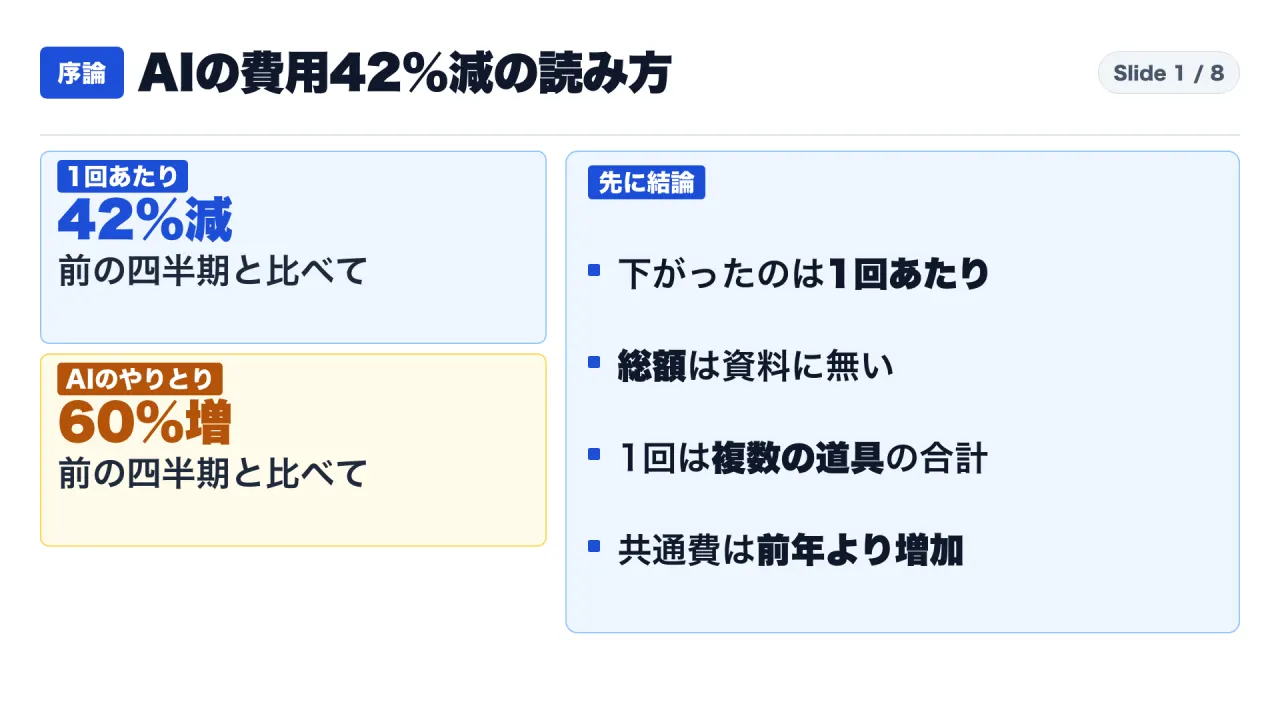
A forensic examination of Grab’s Form 6-K filings submitted to the U.S. Securities and Exchange Commission (SEC), management’s prepared remarks, and supplemental investor disclosures reveals why enterprise teams cannot copy this 42% figure directly as an internal KPI:
- Unit Cost vs. Total Cost Disconnect: The 42% decline applies strictly to cost per interaction (unit cost). Grab’s total enterprise spend on AI is not disclosed anywhere in its SEC filings or presentations.
- The Blended Average Fallacy: Footnotes show Grab defines an “interaction” as a blended aggregate across diverse tools (Merchant AI Assistant, Driver AI Coach, Navie Talkie, Consumer AI, Shopping Agent). When lightweight mobile queries surge, average cost per interaction drops sharply even if model token prices remain flat.
- Enterprise Cloud Overhead Rose: Unallocated corporate expenses (Regional Corporate Costs) increased by $7 million YoY to $101 million (~15.9 billion JPY). Grab’s CFO explicitly attributed this increase to “continued investments in AI cloud and software.” When usage volume expands faster than unit costs decline, total cash outflow grows.
- Earnings Growth Came from Core Operations, Not AI: Grab posted record Adjusted EBITDA of $237 million (+73% YoY) on revenue of $1.112 billion (+27% YoY), with all three core segments profitable. However, management credited advertising growth, operating leverage, scale efficiencies, and loan growth—not AI cost savings—for expanding profits.
1. Research Protocol: Primary SEC Filings and Currency Invariants
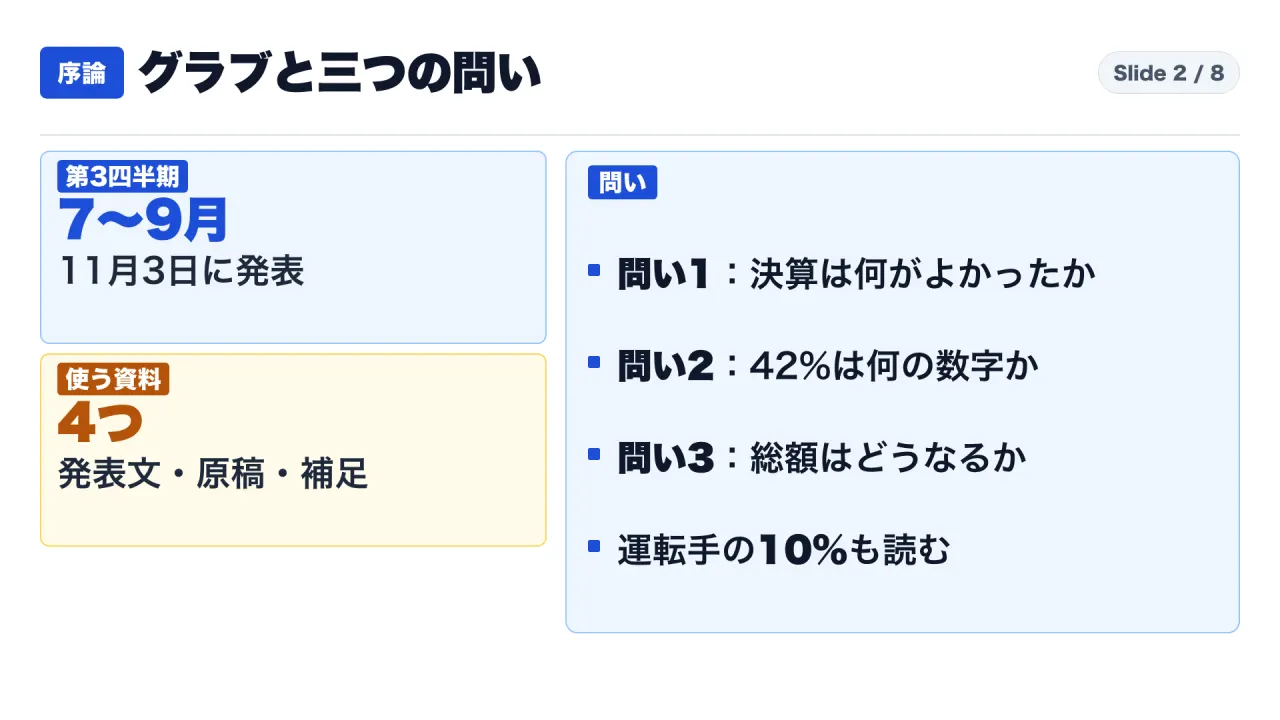
To maintain rigorous accounting fidelity, this audit examines four primary sources retrieved on November 4, 2026:
- Source S1: Grab Holdings Limited Form 6-K filed with the SEC (Accession number ending in
148, containing the complete earnings press release, full management statements, and forward guidance). - Source S2: Grab Q3 2026 Earnings Prepared Remarks (official PDF transcript dated November 3, 2026).
- Source S3: Grab Q3 2026 Supplemental Presentation.
- Source S4: Federal Reserve Statistical Release H.10 (published November 2, 2026; reference spot rate October 30, 2026: 1 USD = 157.47 JPY). (The H.10 also lists Singapore Dollars at 1 USD = 1.2776 SGD, but Grab reports in USD).
(Filing Note: SEC EDGAR shows two 6-K filings for Grab on November 3, 2026. Accession 148 is the comprehensive press release containing guidance revisions and strategic commentary; accession 150 is a condensed technical filing intended for incorporation into registration statements. This analysis audits the complete primary text of 148.)
Reconciling Market Summaries Against Verified Filings
Before dissecting the accounting mechanics, we cross-referenced viral market summaries circulating among tech analysts against verified SEC text:
| Circulated Market Claim | Primary SEC Filing Verification | Forensic Determination |
|---|---|---|
| All 3 segments profitable, record EBITDA, guidance raised | Confirmed in S1 and S2 | Verified Fact |
| Drivers using AI earn over 10% more per hour | Confirmed in S2 and S3 for “active users per online hour” | Verified with caveats (control group undefined) |
| Active drivers earn 20% more | Not found in SEC text. The +20% figure was merchant revenue growth in Thailand | Misattributed in viral summaries |
| Token cost per transaction dropped 42% | Text states cost per AI interaction QoQ, not token cost per transaction | Terminology distorted in viral summaries |
| CFO detailed model routing and employee model bans | Not mentioned in SEC 6-K or prepared remarks | Unverified interview claim |
2. Chapter 1: Record Corporate Earnings ── Where Did the Profits Come From?
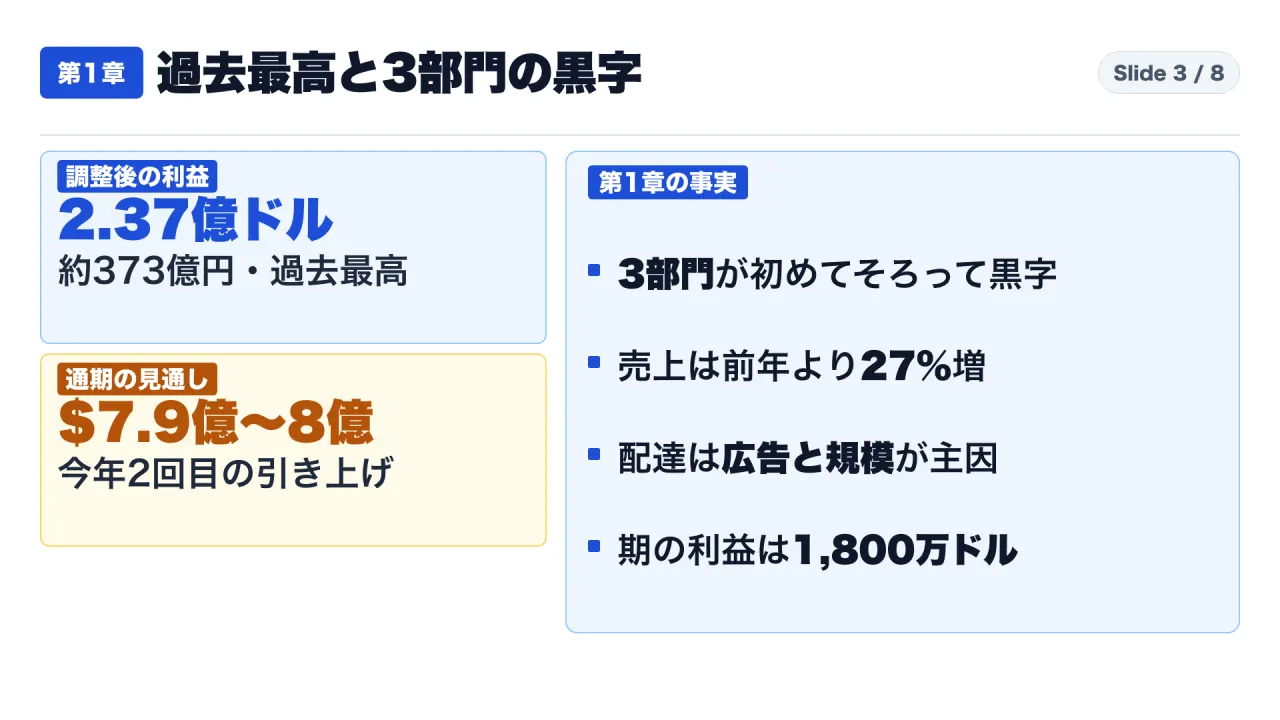
Grab’s third-quarter 2026 financial performance demonstrated robust operational execution across Southeast Asia:
| Financial Metric | Q3 2026 Reported Value | YoY Growth Rate | Illustrative JPY Equivalent (157.47 Rate) |
|---|---|---|---|
| Consolidated Revenue | $1.112 billion | +27% YoY | ~175.1 billion JPY |
| Adjusted EBITDA (Record) | $237 million | +73% YoY | ~37.3 billion JPY |
| Adjusted EBITDA Margin | 21.3% | Up from 15.6% | — |
| IFRS Accounting Net Profit | $18 million | Up from $17M | ~2.8 billion JPY |
| Full-Year Adjusted EBITDA Guidance | $790M to $800M | Raised (2nd time in 2026) | ~124.4B to 126.0B JPY |
| Full-Year Revenue Guidance | $4.15B to $4.20B | Raised from $4.10B-$4.15B | ~653.5B to 661.4B JPY |
User activity reached historic highs: Monthly Transacting Users (MTUs) expanded to approximately 57 million, while Mobility ride-hailing transactions increased 21% YoY, outpacing Gross Merchandise Value (GMV) growth (+14%).
Crucially, all three core operating divisions generated positive Adjusted EBITDA simultaneously. Financial Services staged a dramatic turnaround, swinging from an Adjusted EBITDA loss of -$28 million in Q3 2025 to a positive contribution of +$12 million in Q3 2026, bolstered by digital banking operations (Superbank in Indonesia and GXS Bank in Singapore) and the acquisition of Stash.
What Management Actually Credited for the Profit Surge
When detailing why operating profits and margins expanded, Grab’s official earnings announcement explicitly credited:
- Deliveries: Advertising revenue expansion and operating scale leverage.
- Mobility: Stable segment margins of 8.9% of GMV alongside steady ride volume.
- Financial Services: Growth in loan originations and digital banking integration.
Management did not cite AI cost reduction as a material driver of operating profit.
The Adjusted EBITDA vs. IFRS Net Income Gap
While Adjusted EBITDA reached a record $237 million, GAAP/IFRS Net Profit for the period was $18 million. The press release details that operational gains were offset by $57 million in mark-to-market fair value losses on financial assets and a $12 million impairment on equity-method investments.
3. Chapter 2: Inside the 42% Reduction ── The Blended Average Fallacy
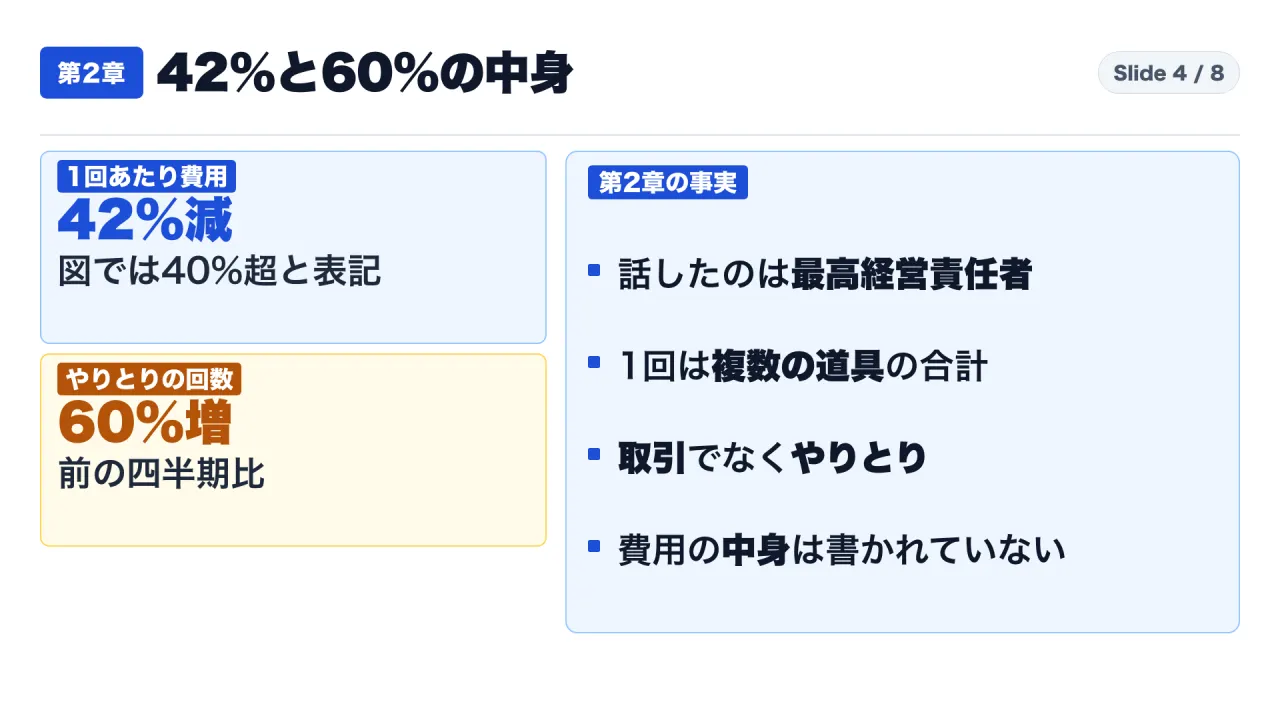
In the official earnings prepared remarks, Grab’s Chief Executive Officer stated:
“We are driving this while structurally lowering our compute costs, as cost per AI interaction fell 42% QoQ and AI interactions among partners and users grew 60% QoQ.”
In the Supplemental Presentation, this is summarized graphically as a >40% reduction in cost per AI interaction alongside a 60% QoQ increase in volume.
What Is an “AI Interaction”?
Footnote 2 of the Supplemental Presentation provides the critical governance definition:
“Interactions across Grab AI tools including the Merchant AI Assistant, Driver AI Coach and Navie Talkie, Consumer AI and Shopping Agent.”
Notice the word “including”—this is not an exhaustive list. More importantly, it aggregates vastly different computational workloads:
- Heavy Agent Workflows: A merchant analyzing hourly demand spikes to optimize kitchen prep involves complex database retrieval and multi-turn planning.
- Moderate User Workflows: A consumer using the Shopping Agent to substitute out-of-stock grocery items.
- Lightweight Voice Queries: A driver asking Navie Talkie for quick destination assistance.
Simpson’s Paradox in Corporate AI Billing
Aggregating disparate tools into a single unit metric introduces a classical statistical trap. Consider an illustrative numerical scenario:
Suppose an enterprise operates two AI tools:
- Heavy Tool: Costs $1.00 per task.
- Light Tool: Costs $0.10 per query.
In Month 1, the company runs 100 heavy tasks ($100) and 100 light tasks ($10). Total spend is $110 across 200 interactions, yielding an average cost of $0.55 per interaction.
In Month 2, the underlying pricing of both models remains completely unchanged. However, frontline workers run 320 light queries while heavy tasks remain flat at 100. Total spend increases to $132, but total interactions surge to 420. The average cost per interaction drops from $0.55 to $0.31—a 43% reduction.
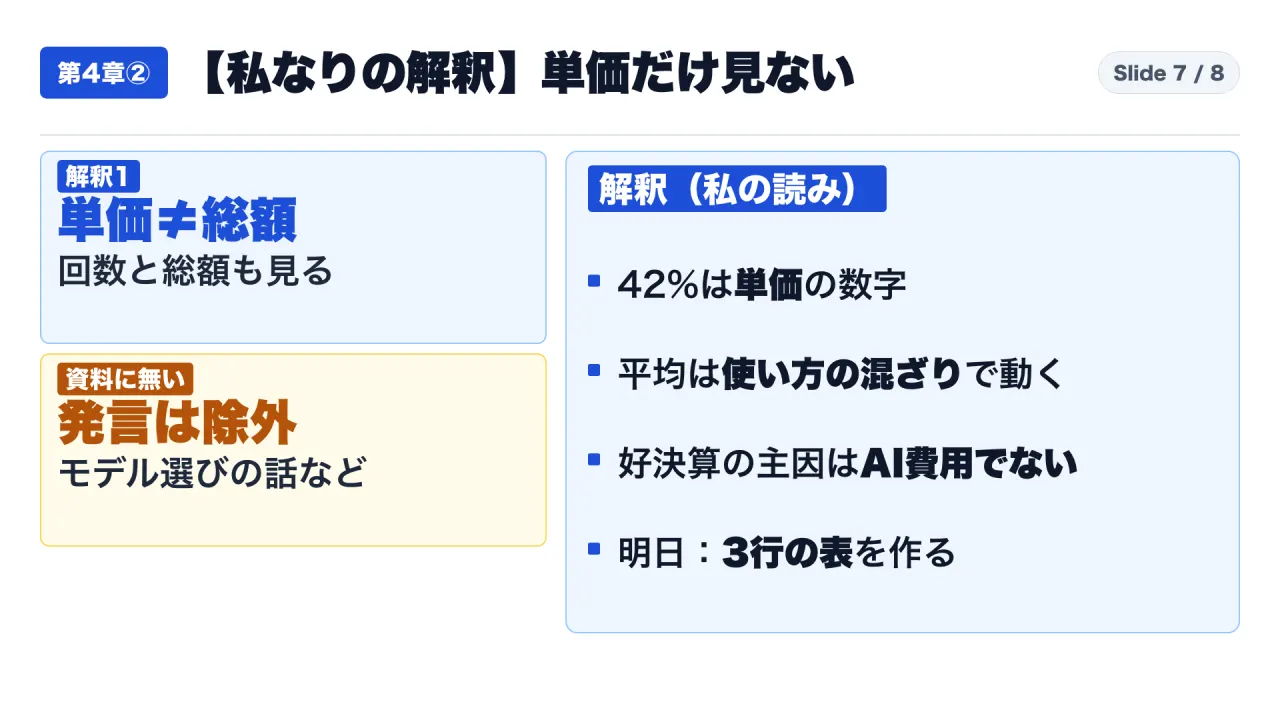
The enterprise unit cost dropped 43%, volume surged 110%, but total cash spend increased by 20%, and not a single software component became cheaper. Grab did not publish tool-by-tool breakdowns; therefore, external observers cannot verify whether underlying computing became more efficient or if usage simply shifted toward lightweight interactions.
4. Chapter 3: Single-Turn Savings vs. Enterprise Cloud Cost Growth
Estimating Net Quarterly Spend
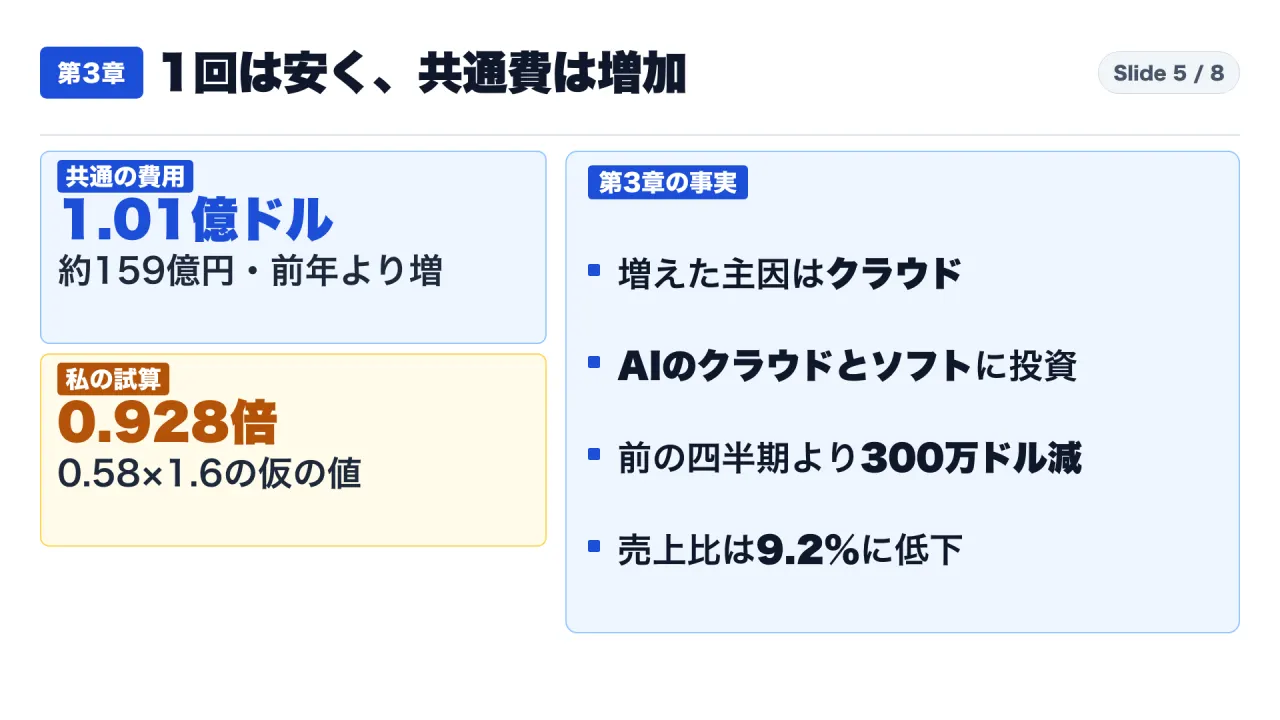
What happens to total AI expenditure when unit costs drop 42% while interaction volume grows 60%?
Assuming identical measurement boundaries:
- Unit Cost Multiplier: 1.00 - 0.42 = 0.58x
- Interaction Volume Multiplier: 1.00 + 0.60 = 1.60x
- Net Total Spend Multiplier: 0.58 * 1.60 = 0.928x
This arithmetic implies a modest 7.2% reduction in total quarter-over-quarter spend. However, this is an unverified hypothetical calculation. If the interaction numerator excludes fixed infrastructure allocations, total spend may have expanded.
The $7 Million Increase in Corporate Overheads
In the official financial tables, unallocated corporate overhead (Regional Corporate Costs) reached $101 million (~15.9 billion JPY), up $7 million YoY from $94 million. The SEC filing explicitly notes:
“Regional corporate costs increased primarily due to higher cloud infrastructure and software expenses, partly offset by reduced staff costs.”
During the investor briefing, the Chief Financial Officer reiterated that the year-over-year increase in corporate overhead “primarily reflects continued investments in AI cloud and software.”
This demonstrates an essential lesson in enterprise cloud economics: declining unit costs do not guarantee lower corporate bills. When an enterprise scales AI across 57 million consumers and hundreds of thousands of merchant and driver partners, the expansion in aggregate consumption outpaces the deflation in per-query costs.
5. Chapter 4: Frontline Productivity Claims ── The Driver 10% Metric
In the official prepared remarks, Grab’s President and Chief Operating Officer stated:
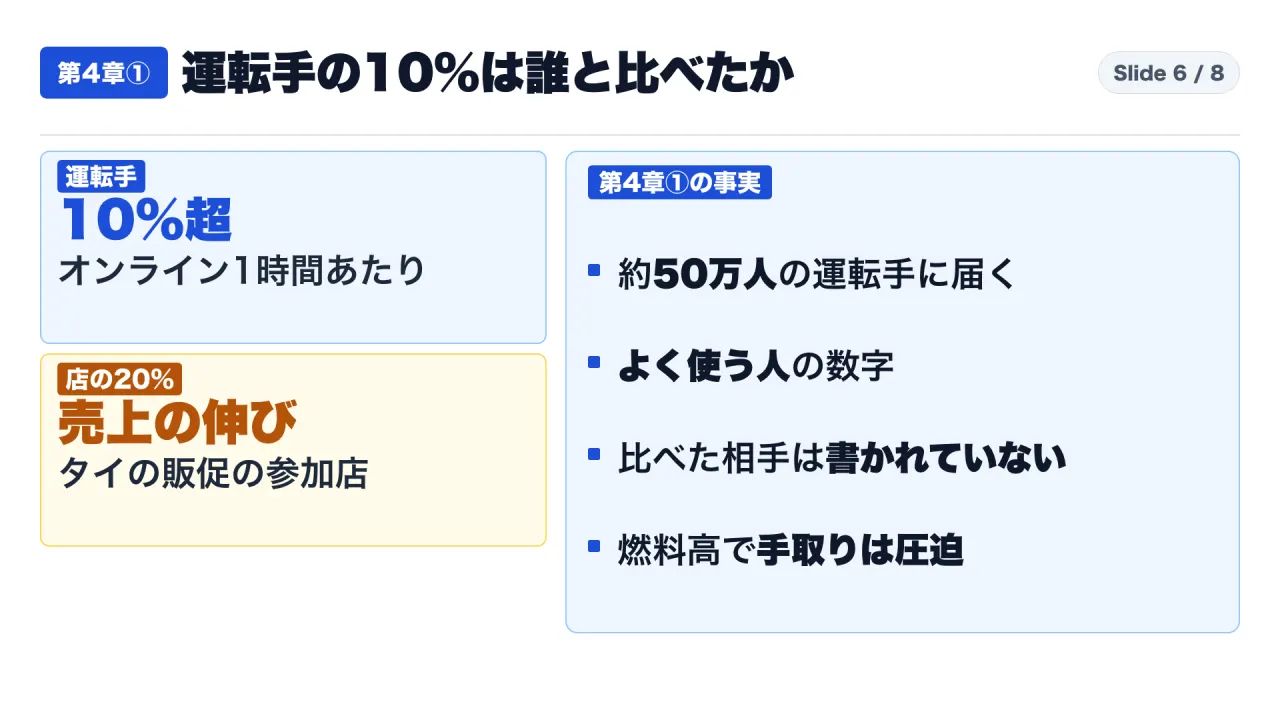
“Our AI Driver Assistant now reaches nearly 500,000 driver-partners, shows them where demand is, and helps those who actively use it earn over 10% more per online hour.”
The Missing Control Group
Scrutinizing the text reveals critical evaluation gaps:
- Who Is the Comparison Group? Does “earn over 10% more” compare active users against drivers who do not use the tool, or does it compare the same drivers before and after adoption? The filing does not disclose the baseline.
- Selection Bias: Drivers who proactively adopt digital coaching tools are often the most motivated and experienced operators on the platform. Conflating pre-existing worker diligence with AI enablement is a common attribution error.
- Gross Revenue vs. Net Take-Home: Management explicitly notes that fuel price volatility impacted driver earnings. Earning 10% more in gross bookings per online hour does not necessarily translate to a 10% increase in net income after vehicle leasing and fuel expenses.
Clarifying the 20% Merchant Figure
Viral market commentaries claimed that “active drivers earn 20% more.” Primary documentation disproves this. The +20% figure appears exclusively in the Supplemental Presentation regarding merchant partners in Thailand participating in the Thai Helps Thai Plus campaign, who generated 20% higher average sales when using the Merchant AI Assistant.
6. Synthesis: What Can and Cannot Be Formally Asserted
Confirmed Invariants:
- Grab reduced cost per AI interaction by 42% QoQ while total AI interactions expanded 60% QoQ.
- An “interaction” is a blended average across at least five distinct tools (merchants, drivers, consumers, shopping).
- Regional corporate costs expanded by $7 million YoY to $101 million, driven by continued investments in AI cloud and software.
- Grab achieved record Adjusted EBITDA of $237 million, driven by advertising revenue, core volume growth, and digital banking profits—not AI cost savings.
Unverified Parameters:
- Total corporate cash expenditure on AI infrastructure, model APIs, and internal ML teams.
- Granular cost reductions broken down by individual AI tool.
- Rigorous A/B control group data for the driver 10% hourly earnings claim.
- Executive assertions regarding centralized model-switching policies, which appear only in unverified interview reports.
7. Enterprise Implementation Playbook: How to Track and Report AI ROI
For IT directors, finance managers, and engineering leaders seeking to establish transparent AI metrics, Grab’s disclosures provide a valuable blueprint for what to measure and what to avoid:
1. Enforce the Three-Line AI Metric Ledger
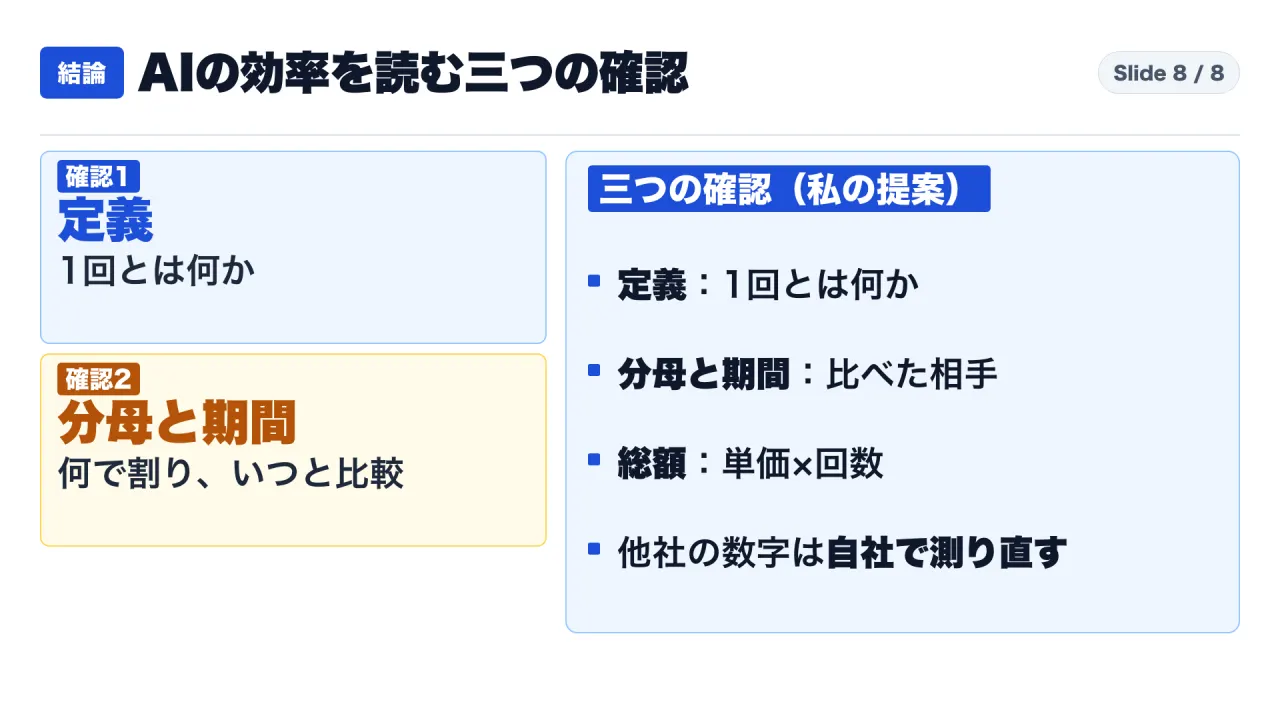
Never report unit cost in isolation. Every monthly AI dashboard presented to senior leadership should display three interdependent rows:
| Metric Dimension | Concrete Corporate Definition | Operational Significance |
|---|---|---|
| Total AI Expenditure | Gross monthly invoice (Cloud compute + Model API charges) | Absolute cash outflow |
| Total Invocations | Count of standardized, defined business tasks | Consumption volume |
| Cost Per Invocation | Total Expenditure divided by Total Invocations | True operational unit cost |
2. Formally Define the Unit of Consumption
Establish unambiguous, single-sentence definitions for what constitutes an “interaction” within your organization:
- Ineffective Definition: “Any call made to an internal LLM endpoint.” (Blends $0.0001 auto-complete calls with $0.50 document analysis tasks).
- Effective Definition: “A resolved customer service ticket processed end-to-end by the customer support bot.”
3. Ask Three Questions Before Adopting External Vendor Benchmarks
When enterprise software vendors or cloud providers claim dramatic efficiency numbers:
- What is the exact mathematical definition of a single interaction?
- What is the comparison timeframe (QoQ, YoY, or synthetic pre-launch baseline)?
- What happened to total gross software spend over the same period?
8. Primary Source Documentation
- Grab Holdings Limited Form 6-K (Accession
0001855612-26-000148, November 3, 2026): Q3 2026 Unaudited Financial Results Press Release: SEC EDGAR Database - Grab Q3 2026 Earnings Prepared Remarks (November 3, 2026): Management Strategic Transcript: Grab Investor Relations Portal
- Grab Q3 2026 Supplemental Presentation (November 3, 2026): Operating and Segment Highlights: Grab Investor Relations Portal
- Federal Reserve Statistical Release H.10 (November 2, 2026): Foreign Exchange Rates as of October 30, 2026: Federal Reserve Board Portal