Anatomy of a Market Disinformation Meme: How the Viral "$3T Wiped" Graphic Concealed a Historic 1,600-Point Dow Rally and Misattributed AI Infrastructure Bottlenecks
A forensic fact-check reveals how post-midterm social media posts weaponized a recycled 2025 tariff headline to fabricate a Democratic socialism panic while erasing a 1,600-point Dow surge and obscuring the real driver of the selloff: local ballot revolts halting 39 AI data centers.
Japanese Edition: https://consuloji.substack.com/p/31600ai39
Executive Summary & Key Takeaways
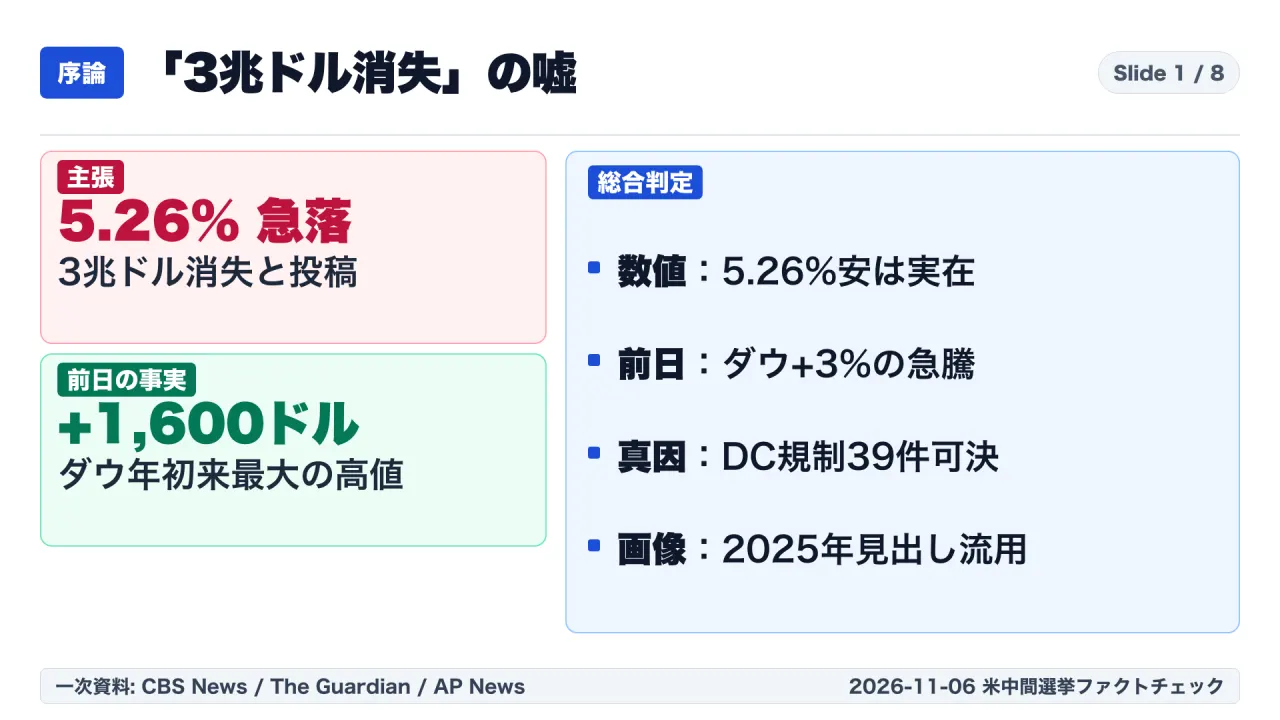
- Core Analytical Thesis: Following the November 3, 2026 U.S. midterm elections, a composite screenshot showing a 5.26% Nasdaq drop under the headline “$3T WIPED” and the slogan “Welcome to Democratic Socialism” spread rapidly across social platforms. Cross-examining this artifact against verified market records and primary reporting (CBS News, The Guardian, AP News, Al Jazeera) confirms it is Misleading via Selective Omission and Fabricated Causality. While the Nasdaq fell 5.26% intraday on November 5, 2026 (closing down 5.5%) and erased roughly $2.5 trillion to $3.0 trillion in market value across U.S. exchanges, the headline “$3T WIPED” was an internet meme recycled directly from the April 2025 tariff shock. More critically, the graphic omitted the preceding session on November 4, 2026, when the Dow Jones Industrial Average surged approximately 1,600 points (+3.0%) in its largest one-day gain of 2026, alongside gains in the S&P 500 (+1.6%) and Nasdaq (+1.4%). The subsequent November 5 technology selloff was driven not by political ideology, but by municipal ballot results in which 39 out of 45 communities across ten states voted to restrict AI data center construction, placing roughly 30% of projected 2028 capacity under threat of freeze.
- Key Takeaways:
- Divided government (“political gridlock”) reduced equity risk premiums on November 4, 2026, by eliminating radical legislative tail risks.
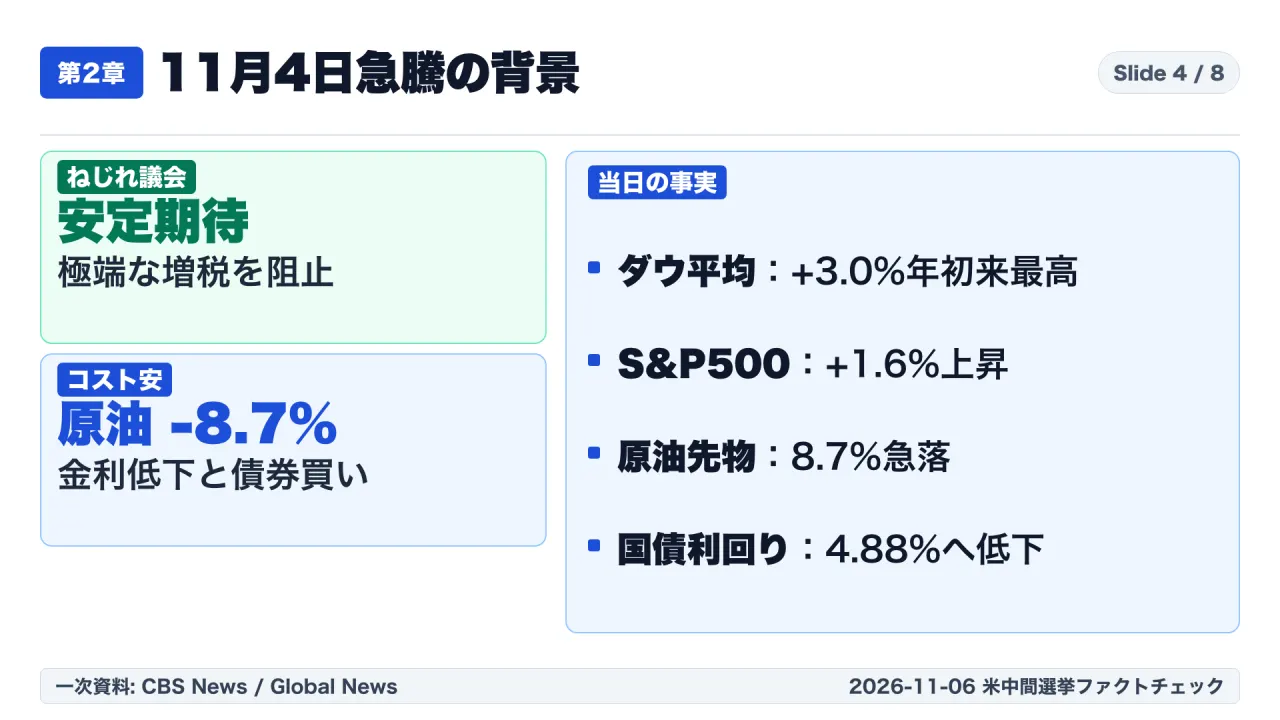
- An 8.7% plunge in Brent crude ($94.62/barrel) and falling 10-year Treasury yields catalyzed the post-election rally.
- Local municipal zoning, water rights, and power hookups—rather than federal bills—represent the true bottleneck for AI hardware multiples.
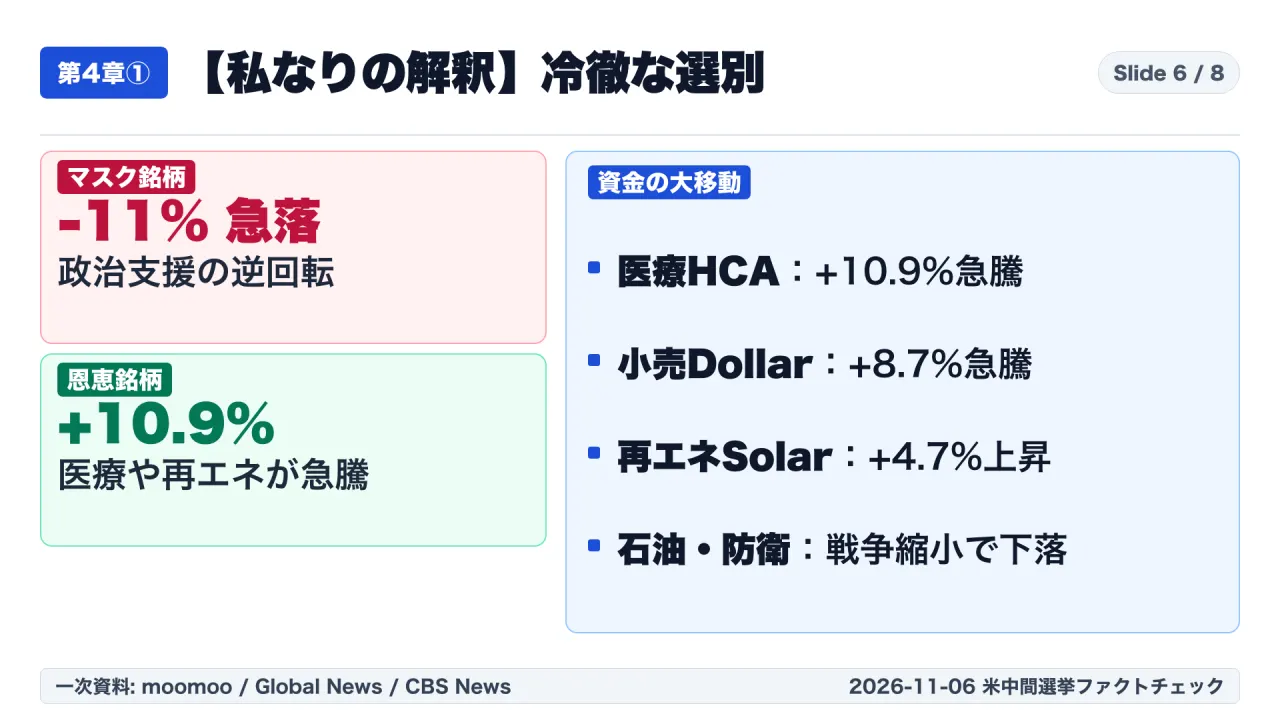
- Capital rotated out of crowded tech into healthcare (+10.9%), discount retail (+8.7%), and defensive equities.
1. Fact-Check Verdict: Authentic Market Data, Fabricated Causality
The overall classification for the viral image is Misleading: Selective Factual Omission and Fabricated Causality.
- Intraday Loss Percentage and Market Capitalization Loss:
- The numerical readout of a 5.26% decline on the Nasdaq was authentic market data captured during afternoon trading on November 5, 2026 (closing down 5.5%). The broader selloff across U.S. exchanges erased between $2.5 trillion and $3.0 trillion in market value that day. However, the banner “$3T WIPED” was a visual template recycled from coverage of the April 2025 tariff selloff.
- The Concealed Preceding Rally:
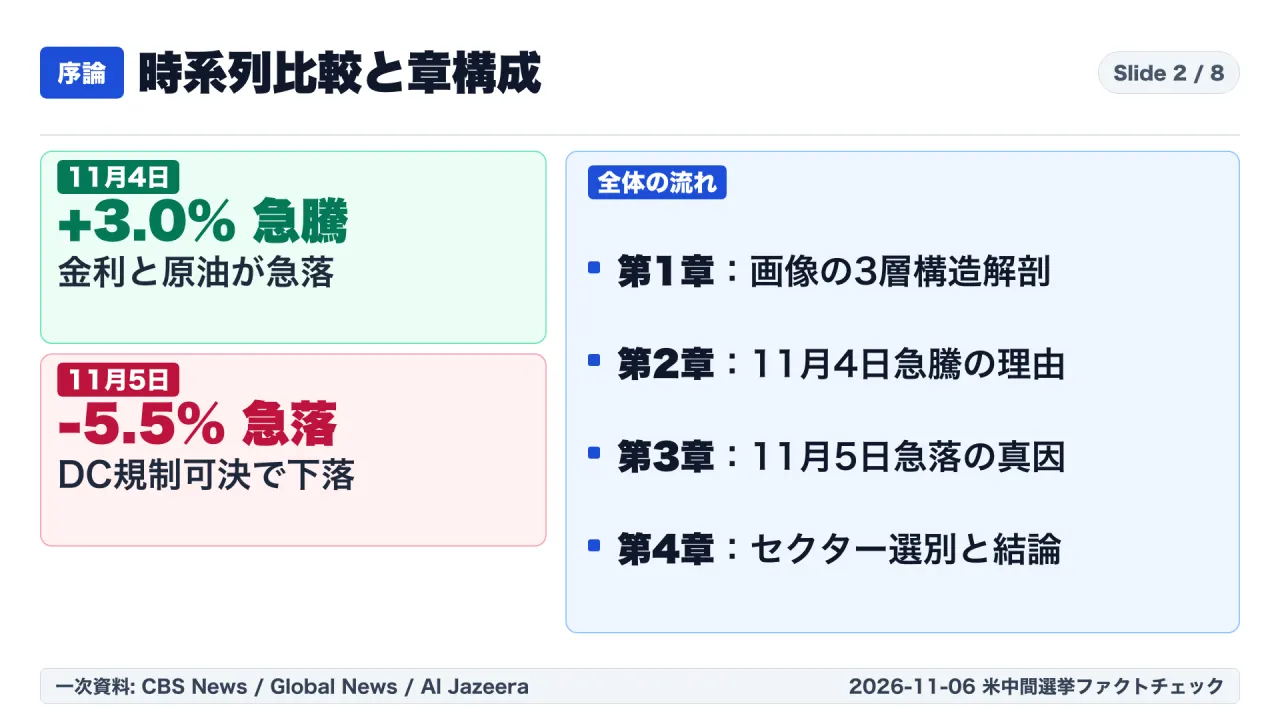
- The primary deception lies in temporal truncation. By presenting the November 5 decline in isolation, the graphic concealed the fact that on November 4, 2026—the session immediately following the election—U.S. markets staged their strongest one-day rally of the year. The Dow gained approximately 1,600 points (+3.0%), the S&P 500 rose 1.6%, and the Nasdaq Composite climbed 1.4%.
- The Structural Driver of the November 5 Correction:
- When the Nasdaq corrected 5.5% on November 5, the catalyst was not fear of federal socialist legislation. With a Republican president holding veto power and Democrats lacking a two-thirds congressional supermajority, radical statutory shifts were structurally impossible. Instead, the selloff stemmed from local municipal ballot results certified on November 5: voters in 39 out of 45 municipalities approved strict restrictions or moratoriums on AI data centers, jeopardizing roughly 30% of projected 2028 hyperscale capacity.
2. Forensic Deconstruction: The Three Layers of the Viral Artifact
The circulating image achieved viral reach by superimposing real-time financial metrics onto internet meme culture and partisan slogans.
| Evaluated Claim | Displayed Content in Viral Image | Verified Market and Empirical Facts | Fact-Check Classification |
|---|---|---|---|
| Market Drawdown Metric | “Nasdaq” flashing a “5.26%” drop | On the afternoon of November 5, 2026, the Nasdaq passed 5.26% down and closed at -5.5%. The Dow fell 3.4% (>1,800 points). | Accurate (isolated metric) |
| Market Capitalization Loss | “$3T WIPED” headline banner | Total U.S. equity market capitalization declined by $2.5T to $3.0T on November 5. The phrase was recycled from April 2025. | Mostly Accurate (recycled meme) |
| Immediate Post-Election Crash | “Markets collapse immediately after Blue Wave” | On November 4, 2026 (the session directly after election night), the Dow gained 1,600 points (+3.0%), S&P gained +1.6%, Nasdaq gained +1.4%. | Misleading (omits record rally) |
| Ideological Causality | “Welcome to Democratic Socialism caused the selloff” | Divided government guarantees presidential veto power against major tax hikes. 10-year Treasury yields actually declined from 4.95% to 4.83%. | False (unsupported by data) |
| Industry Target Concentration | Broad systemic flight from all private capital assets | Defensive, healthcare, and retail equities surged (HCA +10.9%, Dollar Tree +8.7%). Selloff was confined to AI infrastructure and high-multiple tech. | False (ignores sector rotation) |
The graphic combined genuine intraday data with recycled meme catchphrases and unsupported political conjecture. In reality, markets trade on statutory probability, discount rates, and physical earnings visibility.

3. Why Markets Rallied on November 4: The Divided Government Dividend
To understand why the viral image’s narrative collapses, one must examine the macro drivers that propelled the November 4 market surge. Far from panicking over Democratic majorities in Congress, Wall Street welcomed the outcome through two distinct economic mechanisms.
The Political Gridlock Dividend
Financial markets historically favor divided government. When the presidency is held by one party and the legislature by another, radical policy shifts become nearly impossible to enact:
- Veto Protection Against Tax Hikes: While Democrats secured majorities in both chambers (54 Senate seats and approximately 251 House seats), they fell far short of the two-thirds supermajority (67 in the Senate, 290 in the House) required to override a presidential veto under Article I, Section 7 of the U.S. Constitution. Sweeping corporate tax increases were dead on arrival.
- Brakes on Unilateral Tariffs and Deficits: At the same time, Democratic congressional control established an institutional check against unilateral executive actions, such as uncoordinated expansion of broad import tariffs.
As George Saravelos, Head of Global FX Research at Deutsche Bank, documented, the elimination of both redistributive legislative extremes and protectionist executive disruptions sharply compressed macroeconomic risk premiums, prompting institutional re-entry into equities.
Inflation Relief: Plunging Crude Oil and Treasury Yields
The second catalyst was an immediate repricing of energy and interest-rate risk. Following eight months of military tension between the United States and Iran that maintained an elevated risk premium and pushed average 10-year Treasury yields to 5.13% in October 2026, institutional desks anticipated congressional pressure toward diplomatic de-escalation:
- Brent crude oil plunged 8.7% on November 4, settling at $94.62 per barrel.
- The U.S. 10-Year Treasury yield fell from 4.95% on election night down to 4.88% on November 4, and declined further to 4.83% on November 5.
Cheaper energy and falling discount rates represented a clear positive shock for consumer spending and corporate operating margins, powering the Dow’s 1,600-point jump.
4. The True Catalyst of the November 5 Selloff: Local AI Data Center Ballot Revolts
39 Out of 45 Municipal Ballot Measures Passed
Alongside federal races, voters in 45 local jurisdictions across ten states voted on municipal referendums designed to restrict, tax, or pause new AI data center construction. Grassroots resistance had escalated over three physical issues:
- Soaring residential electricity bills caused by local utilities socializing transmission upgrade costs.
- The depletion of municipal aquifers used for evaporative cooling in high-density clusters.
- Severe industrial noise pollution and land-use conflicts in residential zones.
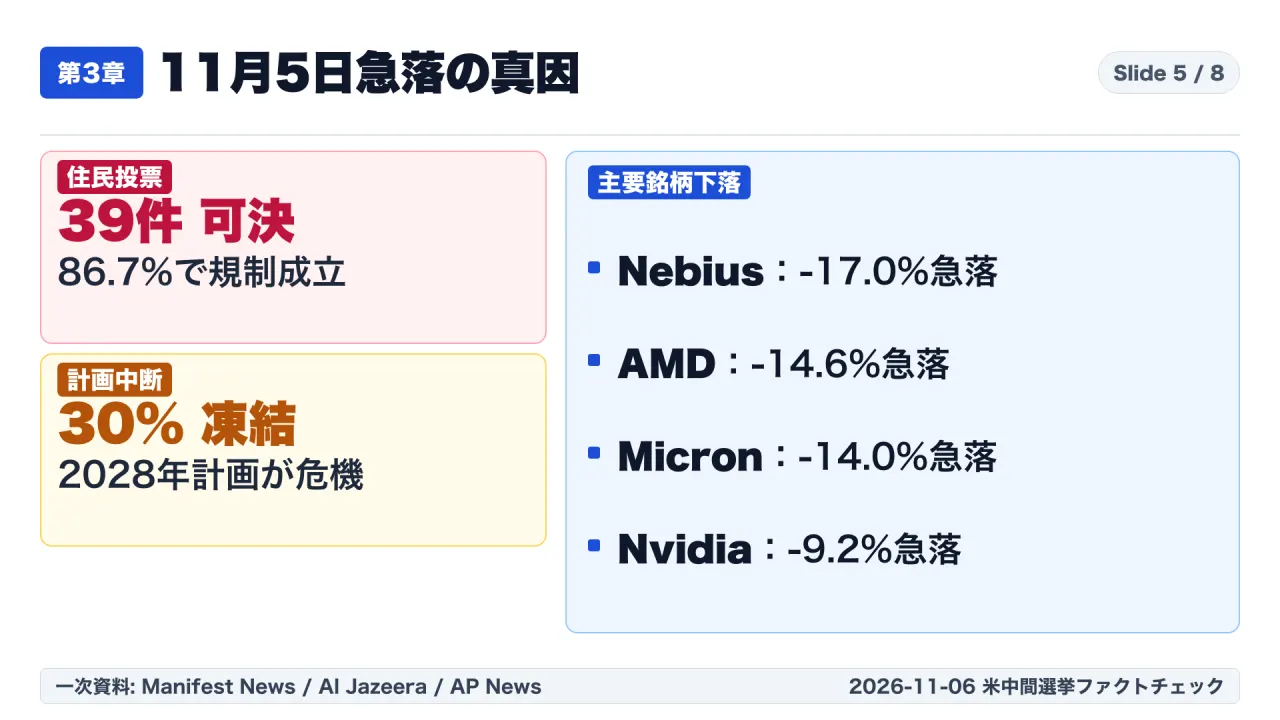
When election boards certified results on November 5, 39 out of 45 ballot initiatives were approved by voters (an 86.7% passage rate), with only one rejection in North Dakota. Simultaneously, in Texas—which hosts approximately 27% of all planned data center capacity in the United States—voters elected a governor who had campaigned on pausing commercial data center grid approvals.
Valuation Multiple Contraction: The Physical Boundary of AI
According to analysis by UBS, the local ballot victories placed approximately 30% of all projected 2028 U.S. data center capacity under immediate threat of delay or cancellation.
The equity market’s multi-year rally had assumed unconstrained exponential scaling: hyperscalers would deploy hundreds of billions on facilities, absorbing millions of advanced GPUs from Nvidia, AMD, and memory suppliers. The municipal votes shattered this assumption:
- If physical facilities cannot secure municipal zoning approval, cooling water permits, or electrical substation hookups, server racks cannot be deployed.
- If server racks cannot be deployed, hyperscalers cannot purchase GPUs or high-bandwidth memory at projected acceleration rates.
The result on November 5 was an aggressive valuation contraction across the AI supply chain:
- Nebius Group: -17.0%
- AMD: -14.6%
- Micron Technology: -14.0%
- CoreWeave: -12.1%
- Nvidia: -9.2%
The selloff was not a rejection of capitalism; it was a repricing of semiconductor multiples against physical infrastructure limits.
5. Sector Rotation vs. Systemic Flight: Following Capital Flows
If market participants genuinely feared that Democratic control would dismantle private enterprise, capital would have fled all equities into cash or sovereign bonds. Data from the New York Stock Exchange reveals that the opposite occurred: institutional investors executed an aggressive rotation out of extended technology into undervalued domestic equities and policy-favored sectors.
Unwinding Political Speculation
Corporate leaders who had made aggressive partisan bets faced immediate market re-evaluations. Elon Musk had directed roughly $500 million into Republican campaign entities during the 2026 cycle. With Republican candidates failing to capture key races in Texas and Democrats taking control of congressional oversight committees, investors recognized elevated regulatory friction around pending corporate consolidations:
- Tesla (TSLA) dropped between 11% and 12% on November 5.
- SpaceX secondary market valuations fell over 9%.
Inflows into Defensive and Policy Beneficiaries
Concurrently, institutional capital poured into sectors positioned to benefit from Democratic legislative priorities:
- Healthcare Providers: HCA Healthcare surged +10.9% on expectations that Democratic majorities would protect and expand federal healthcare support.
- Discount Retailers: Dollar Tree climbed +8.7%, reflecting expectations of enhanced social safety-net support that bolsters low-income consumer purchasing power.
- Renewable Energy: First Solar advanced +4.7% and Enphase Energy gained +4.3%, defying the drop in crude oil as investors priced in preserved clean energy tax incentives.
- Large-Cap Consumer Equities: The Walt Disney Company rose +13.56% and Adobe gained +6.75%.
The market was not collapsing; it was rotating capital with mathematical precision.
6. Structural Fundamentals and Historical Midterm Seasonality
The 88-Year Post-Midterm Historical Track Record
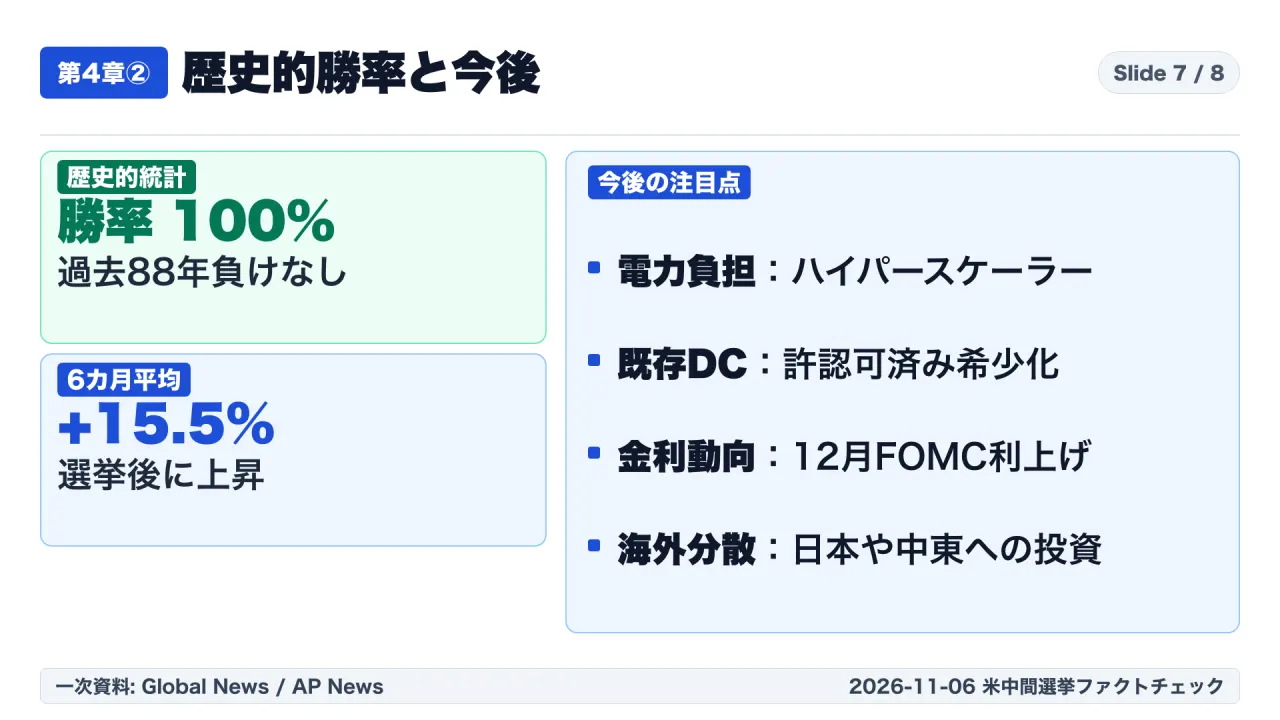
Historical data compiled by Stephen Chiavarone (CIO, Federated Hermes) shows the S&P 500 has never delivered a negative 12-month return following midterms over 88 years, averaging +14.0%. Longitudinal research from Edward Jones covering 14 midterms since 1970 confirms an average +15.5% gain over the subsequent six months.
| Historical Benchmark | Empirical Measurement | Market Context / Significance |
|---|---|---|
| Federated Hermes 88-Year Study | 100% positive 12-month returns | The S&P 500 has never declined over the 12 months following midterms since 1938. |
| Average 12-Month Post-Midterm Return | +14.0% average gain | Historical baseline across both Democratic and Republican midterm outcomes. |
| Edward Jones 14-Cycle Study (1970–Present) | +15.5% average gain | Average advance measured over the immediate six-month post-election window. |
| U.S. Real GDP Growth Projections | Above 2.0% for 2026 and 2027 | Macro fundamentals indicate continued economic expansion, not structural recession. |
| Federal Reserve Policy Pricing | 83% implied probability | Market pricing for policy adjustments at the December 2026 FOMC meeting (target 4.00%–4.25%). |
The true drivers of intermediate market performance are macroeconomic fundamentals: real U.S. GDP growth projected above 2.0% across 2026 and 2027, the path of Federal Reserve monetary policy (where markets priced an 83% probability of interest rate adjustments at the December 2026 meeting toward a 4.00% to 4.25% target range), and the upcoming spring 2027 federal debt ceiling negotiations. Partisan viral memes ignore these macro realities.
7. Actionable Playbook: Institutional Defense Against Financial Narrative Traps
Three Principles for Navigating Market Narrative Shocks
- Mandate Multi-Day Time Series Audits:
- Cross-reference trailing multi-day performance. Identifying whether a single-day selloff was preceded by a historic rally (such as the November 4 1,600-point Dow advance) neutralizes distorted political framing.
- Decouple Political Headlines from Physical Supply Bottlenecks:
- Disregard broad ideological slogans. Interrogate whether legislation has the votes to override a presidential veto, and determine whether the real bottlenecks are physical constraints governed by municipal zoning boards, utilities, and water authorities.
- Audit Intra-Market Sector Dispersion:
- If an index decline is accompanied by sharp gains in domestic healthcare, regional utilities, or discount retailers, the event is a sector rotation, not a systemic capital strike.
Operational Verification Checklist
- Verified performance across the full weekly cycle rather than relying on an isolated single-session screenshot.
- Checked whether constitutional veto barriers prevent the legislative outcomes claimed in political commentary.
- Examined local municipal zoning and utility commission dockets for physical supply constraints.
- Traced capital flows into defensive and non-tech sectors before assuming broad market flight.
- Cross-referenced claims against primary SEC filings, verified election certifications, and established financial reporting.
Markets operate on earnings, interest rates, and physical constraints. Maintaining rigorous adherence to primary source verification remains the only reliable defense against financial disinformation.

Primary Sources & References
- CBS News: 2026 U.S. Midterm Election Results and Market Coverage (November 2026)
- The Guardian: Wall Street Surges Following Midterm Elections as Divided Government Emerges (November 4, 2026)
- AP News: Local Ballot Measures Across 10 States Impose AI Data Center Restrictions (November 5, 2026)
- Al Jazeera English: Oil Prices Drop and Geopolitical Tensions Ease Post-U.S. Elections (November 2026)
- Deutsche Bank Research: Global FX and Macro Strategy on Divided Government Dividends (George Saravelos)
- UBS Global Wealth Management: U.S. Data Center Power and Infrastructure Constraints Assessment
- Swissquote Bank: Equity Sector Rotation Analysis Post-Midterm Elections (Ipek Ozkardeskaya)
- Federated Hermes: 88-Year Historical S&P 500 Performance Following Midterm Cycles (Stephen Chiavarone)
- Edward Jones: Market Seasonality and Midterm Election Cycle Analysis
This article analyzes primary technical and financial disclosures for informational purposes only and does not constitute investment advice.