Inside CoreWeave's $15 Billion Refinancing Wall: Why Bond Yields Spiked to 16% While Asian Hardware Shipments Surged 259%
A cross-asset audit of Form 10-Q debt maturities, 8-year PJM grid delays, 40 municipal voter bans, and Google’s $15 billion migration to Malaysia.
Japanese Edition: https://consuloji.substack.com/p/coreweave103715016google150
Executive Summary & Key Takeaways
- Core Thesis: The market dislocation of early November 2026—marked by a 12.16% single-day drop in the Philadelphia Semiconductor Index (SOX) erasing $3.0 trillion in market capitalization, followed by a record $7.0 billion retail inflow into 3x leveraged semiconductor and tech ETFs—does not reflect an evaporation of AI demand. Upstream manufacturing confirms historic demand: South Korea’s October 2026 semiconductor exports surged 259.4% year-over-year to $56.44 billion, and Taiwan’s Q3 real GDP grew 14.36%. The real structural crisis is a domestic duration mismatch in the United States. Neo-cloud providers like CoreWeave accumulated billions in high-yield debt against a $103.7 billion Take-or-Pay backlog. However, Take-or-Pay contracts yield zero revenue until data centers are energized and operational. With 40 out of 41 US municipalities voting to enact data center restrictions, public hearings recording 90.5% opposition, and PJM grid queues averaging 8 years, energization delays of 12 to 24 months collide directly with CoreWeave’s $15.01 billion in contractual debt maturities arriving between late 2026 and 2028. This drove CoreWeave bond yields to 15.0%–16.0% and 5-year CDS spreads to 1,000–1,200 bps. Simultaneously, well-capitalized hyperscalers are bypassing US grid queues: Alphabet (Google) committed $15.0 billion to Malaysia, securing guaranteed 12-month utility interconnections, a 1-GW green power tariff, and dedicated off-river water infrastructure.
- Primary Sources Verified: CoreWeave Form 10-Q for the quarter ended June 30, 2026 (Note 8: Debt and Financing Obligations); Prophecy Gov Public Hearing NLP Audit (American Sentiment: 906 Local Hearings, 10,202 Citizen Testimonies); US Federal Energy Regulatory Commission (FERC) Docket RM26-4 and PJM Interconnection queue disclosures; Ministry of Investment, Trade and Industry of Malaysia (MITI), Tenaga Nasional Berhad (TNB), and Gamuda Berhad joint filings; and South Korea Ministry of Trade, Industry and Energy (MOTIE) October 2026 Export Bulletin.
- Actionable Engineering & Governance Takeaways:
- Audit cloud vendor balance sheet duration: inspect debt maturity schedules (Form 10-Q Note 8) of specialized neo-cloud GPU providers. A multi-billion backlog cannot offset near-term refinancing liabilities if debt matures before utility energization.
- Enforce vendor multi-cloud escape clauses: mandate contractual termination rights if a compute provider fails to deliver energized, operational GPU clusters within 90 days of schedule due to grid delays.
- Require physical infrastructure decoupling: assess whether data center operators rely on congested Regional Transmission Organizations (PJM, ERCOT, MISO) or possess behind-the-meter generation, dedicated power, or fast-track overseas interconnections.
- Limits of the Evidence: CoreWeave operates under private credit covenants whose full collateral pledges are not fully public; secondary bond yields and CDS spreads reflect indicative broker quotes. While MOTIE data confirms record component shipments, individual customer activation timelines remain proprietary. Southeast Asian mega-campus developments remain subject to local regulatory evolution.
1. The Disconnect: Hedge Fund Deleveraging versus Asian Silicon Supercycle
On November 5, 2026, global markets experienced an intense wave of volatility. The SOX Index fell 12.16% in a single session, dragging the S&P 500 down 4.36% and eliminating approximately $3.0 trillion in market capitalization across US exchanges. NVIDIA equity closed at $161.80 on November 6, down 24% from its October 6 peak of $212.19, erasing nearly $1.4 trillion in valuation.
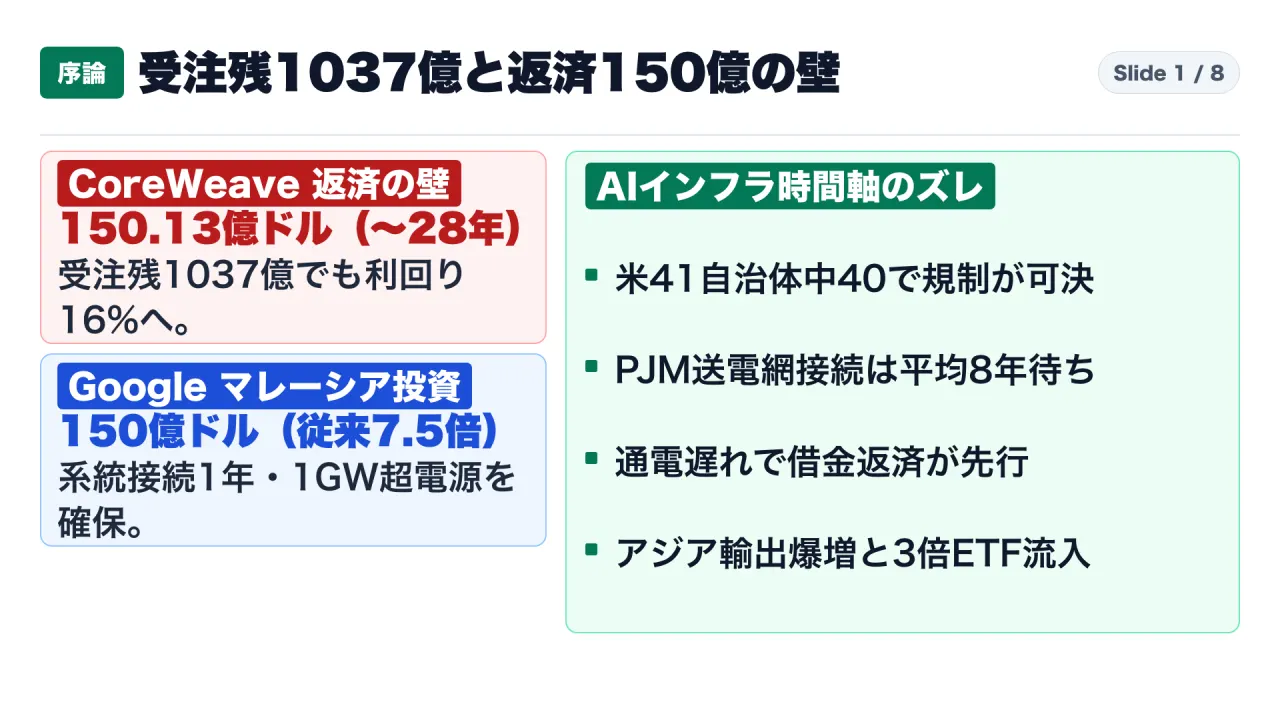
Yet, market participants interpreting this drop as an AI demand collapse overlooked two contrasting data points. First, retail and algorithmic investors executed aggressive contrarian buying: single-day inflows into 3x leveraged long semiconductor and tech ETFs (SOXL, TQQQ) hit a historic record of $7.0 billion. South Korean retail investors purchased $2.2 billion in US equities across five sessions, allocating over 70% to 3x semiconductor ETFs.
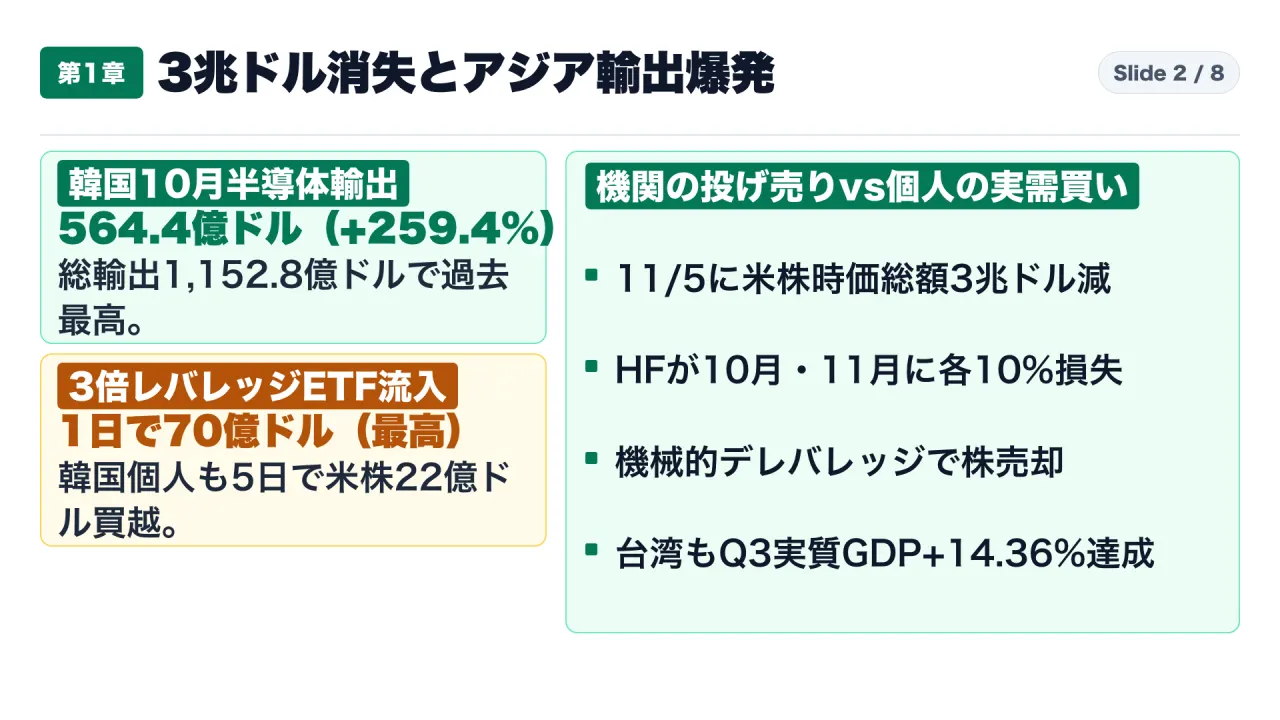
Second, upstream manufacturing and trade telemetry from East Asia proved that physical demand for advanced silicon accelerated at historic rates:
| Metric & Institution | Reported Performance (October–November 2026) | Underlying Mechanism & Primary Verification |
|---|---|---|
| US Equity Market Liquidation (Nov 5, 2026) | SOX: -12.16% / S&P 500: -4.36% ($3.0T erased) / NVIDIA: -24% ($161.80) | Prime brokerage reports showed US hedge funds lost 10% in October and 10% in early November, triggering automated risk-mandate deleveraging. |
| Foreign Institutional Korean Stock Sales | Net outflow of $5.6B (8.15T KRW) across Samsung and SK Hynix in one week | Mechanical liquidity harvesting by Western funds seeking cash to meet domestic margin calls. |
| Leveraged ETF Retail Inflows | Single-day inflow of $7.0B into 3x leveraged bull funds (SOXL, TQQQ) |
Aggressive retail dip-buying predicated on physical component shortages and strong corporate earnings in Asia. |
| South Korea Export Trade Bulletin (MOTIE) | Total exports: $115.28B (+93.7% YoY) / Semiconductor exports: $56.44B (+259.4% YoY) / Trade surplus: +$42.50B | Vertical ramp in shipments of HBM3e/HBM4, enterprise SSDs, and server boards. First month in history exceeding $100B in exports. |
| Taiwan Q3 2026 Macroeconomic Output | Advanced chip exports: $31.30B (+59% YoY) / Preliminary Q3 Real GDP: +14.36% annualized | Full-capacity utilization across TSMC CoWoS packaging facilities and server original design manufacturers (ODMs). |
The selloff was driven by portfolio leverage liquidation rather than canceled physical compute orders. To understand where execution fails, analysts must examine US municipal zoning boards and electrical transmission grids.
2. The US Power Grid Lockdown: 40 Municipal Bans and PJM’s 8-Year Queue
While semiconductor foundries in Hsinchu and Icheon ship silicon at record velocity, physical facilities in the United States face severe regulatory resistance.
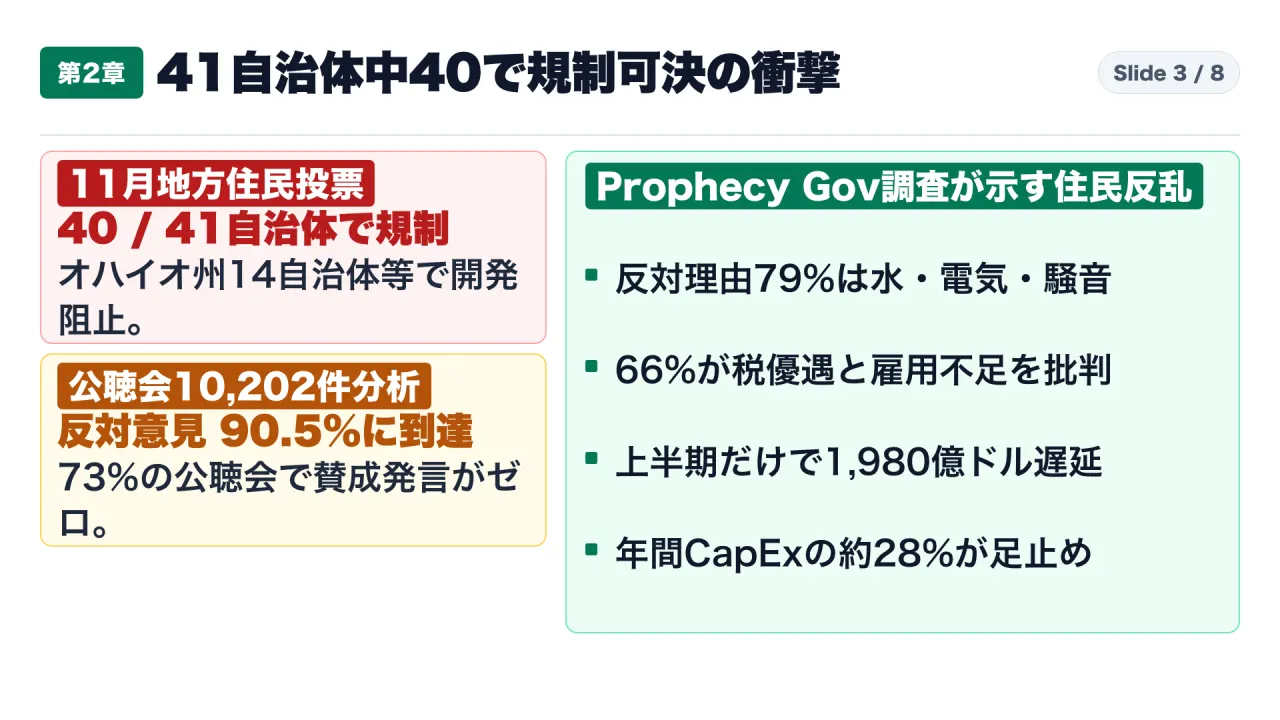
The November 3 Municipal Ballot Measures: A 97.6% Rejection Rate
During local elections on November 3, 2026, 41 municipalities across 10 US states voted on referendums regarding data center zoning restrictions, environmental reviews, water caps, and tax abatement repeals. Voters approved restrictions in 40 out of 41 municipalities (97.6%):
- Ashville, Ohio: In a key hyperscaler corridor, an EdgeConneX zoning variance was rejected by over 81% of voters; 14 Ohio municipalities enacted binding restrictions.
- Edgewater, Florida: Citizens voted by over 77% to amend the municipal charter to permanently ban commercial data center construction.
- The Harwood Exception (North Dakota): The sole exception was Harwood, North Dakota, where Measure 2 to halt Applied Digital’s $3.0 billion campus was defeated 325 to 105, permitting development.
Prophecy Gov Audit: 10,202 Citizen Testimonies Across 906 Hearings
Public policy firm Prophecy Gov conducted NLP analysis on 10,202 citizen testimonies across 906 hearings in 417 US municipalities (American Sentiment):
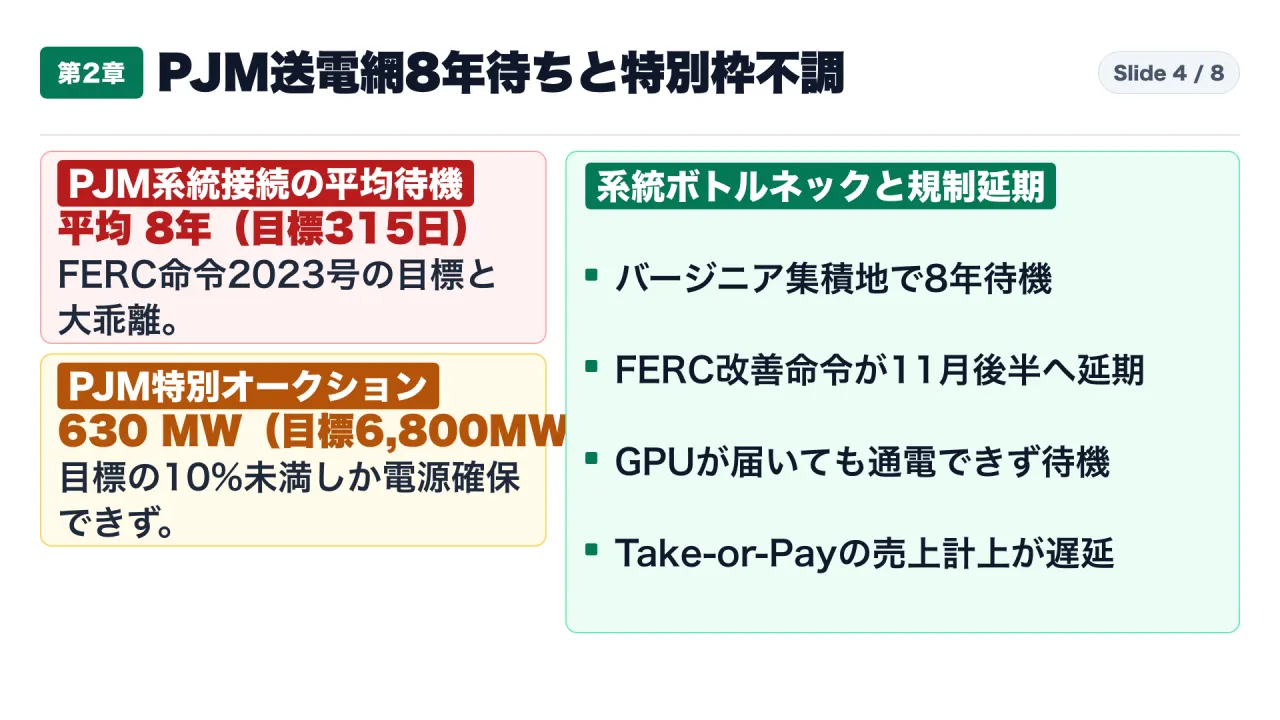
- Overwhelming Opposition (90.5%): 90.5% of citizen comments opposed planned facilities; 73% of hearings had zero supporters.
- Resource Competition: 79% of negative comments cited water depletion from evaporative cooling, residential power rate hikes from utility cost shifting, and continuous noise pollution. An additional 66% noted facilities create minimal permanent jobs despite large tax abatements.
- $198 Billion in Frozen Capital: In the first half of 2026 alone, municipal denials, lawsuits, and zoning moratoria delayed or froze $198.0 billion in US data center projects—roughly 28% of annual hyperscaler capex ($690B–$725B).
Grid Transmission Collapse: PJM’s 8-Year Queue and Auction Shortfalls
In PJM Interconnection—covering 13 states and Northern Virginia—the average queue duration from application to energization reached 8 years. Despite FERC Order 2023, transmission bottlenecks have worsened. In PJM’s reliability backstop auction seeking 6,800 MW of fast-track generation, only 630 MW cleared (less than 10% of target). Consequently, FERC issued show-cause orders under Docket RM26-4, extending compliance deadlines to mid-November 2026.
3. Dissecting CoreWeave’s Form 10-Q: The $15.01 Billion Debt Maturity Wall
This energization delay directly impacts neo-cloud providers that raised debt to procure GPUs. CoreWeave’s Form 10-Q for the quarter ended June 30, 2026, reveals a leveraged capital structure:
Balance Sheet Disclosures and Note 8 Debt Maturities
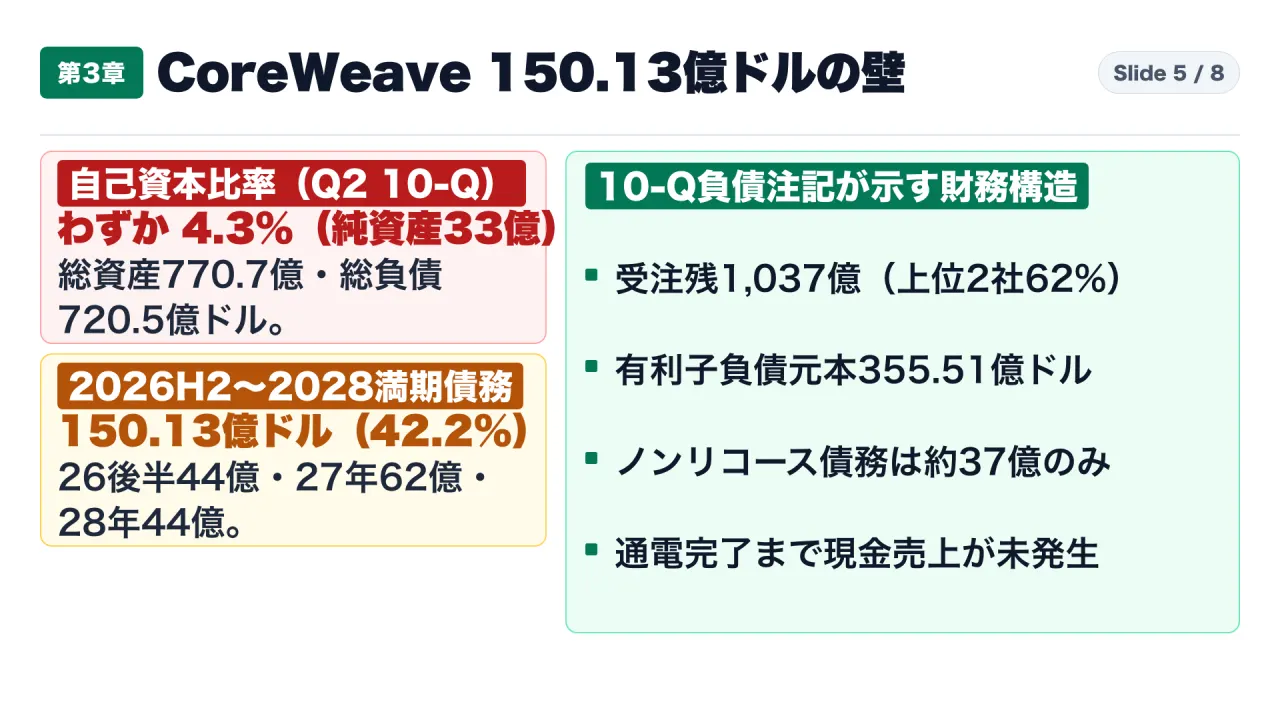
- Total Consolidated Assets: $77.07 billion (mostly GPU hardware, construction-in-progress, and leases).
- Total Consolidated Liabilities: $72.05 billion.
- Stockholders’ Equity: $3.335 billion, yielding an equity-to-assets ratio of 4.3%.
- Total Principal Debt Outstanding: $35.551 billion (only ~$3.7 billion non-recourse; over $31.8 billion carries recourse or cross-defaults).
- Contractual Revenue Backlog (RPO): $103.7 billion to $104.0 billion (98% Take-or-Pay; two customers represent 62% of revenue).
| Tranche & Maturity Period | Principal Debt Due (USD) | Share of Total Debt | Operational Status & Liquidity Risk |
|---|---|---|---|
| Late 2026 (Remaining H2) | $4.413 billion | 12.4% | Immediate maturity wall requiring refinancing or operating cash flow conversion. |
| Calendar Year 2027 | $6.184 billion | 17.4% | Peak annual debt maturity tranche as initial GPU term loans mature. |
| Calendar Year 2028 | $4.416 billion | 12.4% | Secondary equipment financing facilities reaching final maturity. |
| Two-and-a-Half-Year Total | $15.013 billion | 42.2% | 42.2% of total debt matures before new utility interconnections clear. |
| 2029 and Thereafter | $20.538 billion | 57.8% | Long-term senior secured notes and structured credit facilities. |
The Mechanism of Duration Mismatch
Take-or-Pay cloud contracts require facilities to be energized and operational (“Online”) before cash billing starts. If grid interconnections stall, GPUs remain unpowered, producing zero operating cash flow while customer contracts may permit walk-away rights.
This operational lag triggers severe financial pressures:
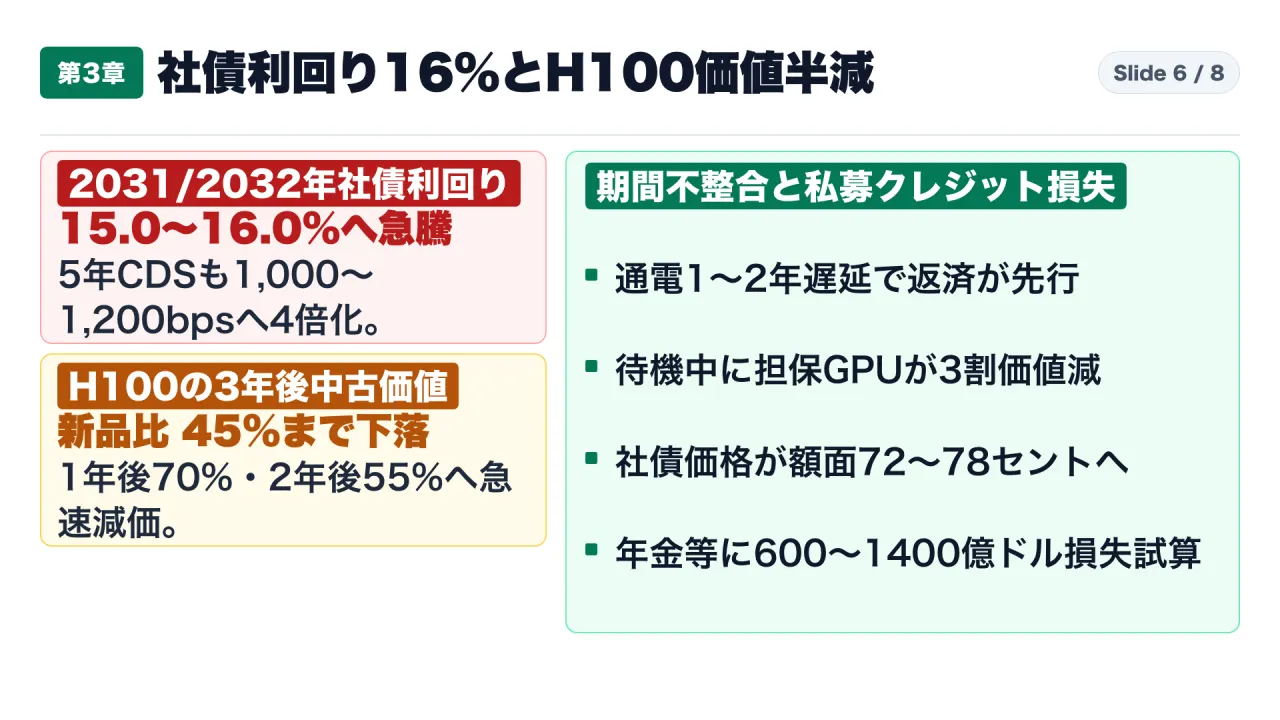
- Accelerated Collateral Depreciation: Secondary market data shows NVIDIA H100 servers depreciate rapidly: retaining ~70% of value after 1 year, 55% after 2 years, and 45% after 3 years as Blackwell architectures scale. Unpowered GPUs losing value while awaiting power degrade loan-to-value ratios.
- Distressed Debt Repricing: CoreWeave senior notes due 2031 and 2032 traded down to 72–78 cents on the dollar, pushing yields to 15.0%–16.0%. Five-year CDS spreads widened from 200–280 bps to 1,000–1,200 bps.
- Private Credit Exposure: University of Chicago analysis highlighted that across the $1.8T–$3.0T neo-cloud private credit market, institutional lenders face potential direct losses of $60B–$140B if duration mismatches require debt restructuring.
4. Hyperscaler Offshoring: Google’s $15 Billion Blueprint in Malaysia
Faced with domestic opposition and 8-year utility queues, well-capitalized hyperscalers are shifting infrastructure to sovereign jurisdictions offering guaranteed power and water access.
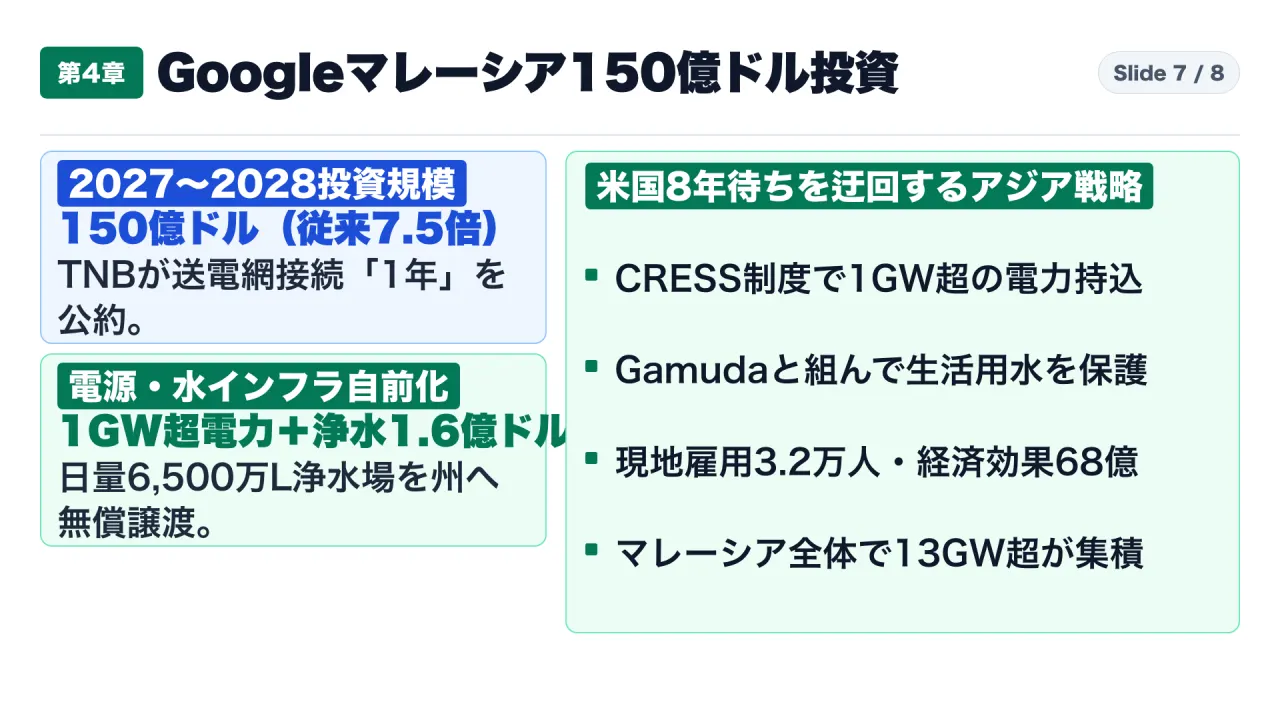
On November 4, 2026, Alphabet (Google) President Ruth Porat and Malaysian Prime Minister Anwar Ibrahim announced a $15.0 billion investment commitment across 2027–2028—a 7.5× expansion over Google’s May 2024 initial plan.
Google’s Malaysian deployment resolves US infrastructure bottlenecks through three pillars:
- Guaranteed 12-Month Grid Connection: Malaysia’s state utility Tenaga Nasional Berhad (TNB) instituted a fast-track lane guaranteeing data center grid connections within 12 months—one-eighth of PJM’s 8-year delay.
- Dedicated 1-GW Clean Energy via CRESS: Under Malaysia’s Corporate Renewable Energy Supply Scheme, Google contracted for over 1 GW (1,000 MW) of clean power wheeled across the national grid to its Elmina and Springhill industrial campuses.
- $160 Million Off-River Water Plant Donated to State: Google partnered with Gamuda Berhad to finance a $160 million (650M MYR) package: an off-river reservoir storing wet-season surplus from the Linggi River and a 65-million-liter-per-day (65 MLD) treatment plant transferred to the state government free of charge, avoiding residential water conflicts.
5. Architectural & Capital Allocation Takeaways: Duration Matching in AI Infrastructure
The November 2026 dislocations show that AI infrastructure is shifting from speculative land-grabs to complex operational execution. Demand remains high; what has fractured is the business model of debt-leveraged intermediaries unable to secure power.
Enterprise technical architects and investors should evaluate infrastructure counterparties through two core frameworks:
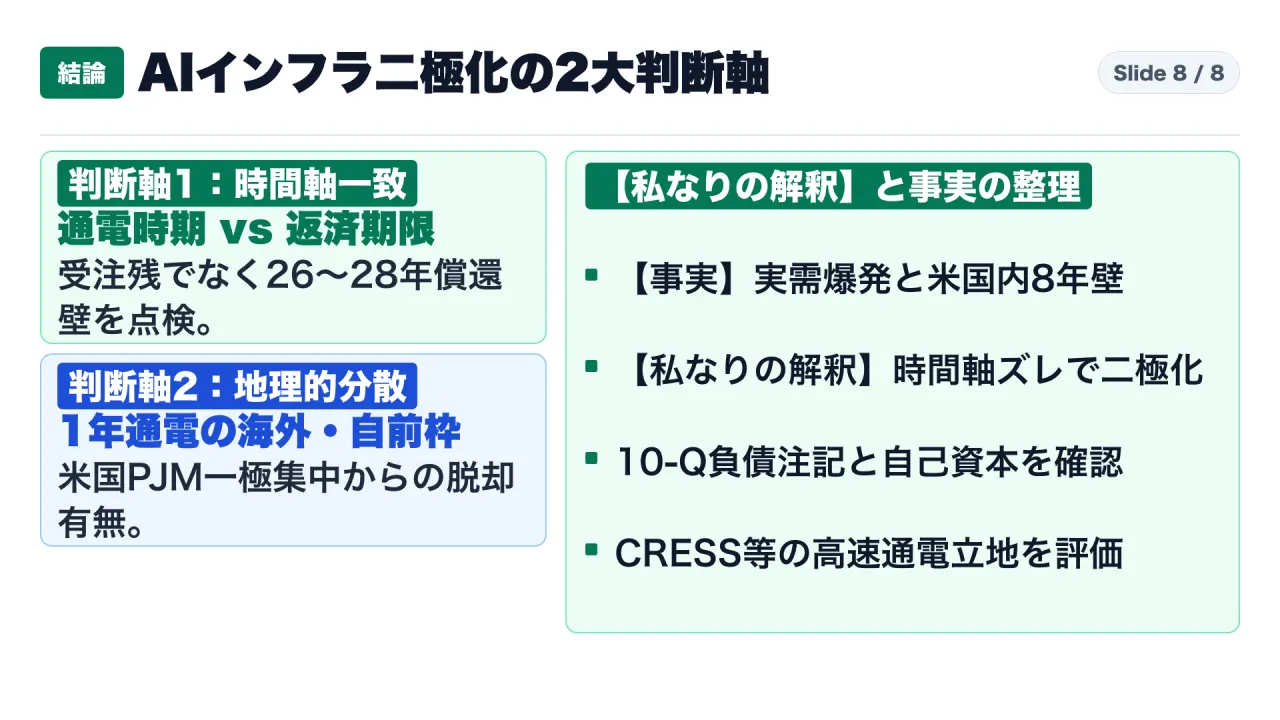
Framework 1: Synchronizing Capital Duration with Grid Energization
A Take-or-Pay backlog cannot protect a provider if data centers remain unpowered when short-term debt matures:
- Cross-reference vendor Form 10-Q debt maturity schedules against physical site energization milestones.
- Verify whether the provider maintains sufficient unencumbered liquidity to absorb a 12- to 24-month grid delay.
- Track collateral depreciation: verify equipment financing models accommodate hardware value declines (such as H100 values reaching 45% by year 3) without tripping covenant thresholds.
Framework 2: Geographic and Interconnection Diversification
Avoid concentration in utility regions with multi-year transmission queues or municipal moratoriums:
- Assess whether providers rely on public RTO queues (PJM, ERCOT) or have secured behind-the-meter generation.
- Validate international deployment roadmaps: assess whether providers have structured comprehensive community-benefit infrastructure packages—modeled on Google’s Malaysian strategy of fast-track state utility agreements, dedicated clean power wheeled via corporate tariffs, and fully funded water treatment infrastructure.
Sources
- CoreWeave, Inc., Form 10-Q for the Quarterly Period Ended June 30, 2026 (Note 8: Debt and Financing Obligations): https://investors.coreweave.com/financials/sec-filings
- Prophecy Gov, American Sentiment: Local Data Center Public Hearing Analysis (906 Hearings / 10,202 Comments): https://www.prophecygov.com/reports/american-sentiment-data-centers-2026
- Federal Energy Regulatory Commission (FERC), Docket RM26-4 Show-Cause Orders and PJM Interconnection Queue Telemetry: https://www.ferc.gov/media/rm26-4-000
- Alphabet Inc. (Google) & Malaysian Ministry of Investment, Trade and Industry (MITI) / TNB / Gamuda Joint Infrastructure Filing: https://blog.google/around-the-globe/google-asia/malaysia-15-billion-ai-cloud-investment-2026/
- Republic of Korea Ministry of Trade, Industry and Energy (MOTIE), October 2026 Export-Import Data Bulletin: https://english.motie.go.kr/www/main.do
This article analyzes primary technical and financial disclosures for informational purposes only and does not constitute investment advice.