Why 97% Single-Task Accuracy Falls to 63% Document Completion: The Mechanics of Decision Index v2, 7.65× Billing Disparities, and 40.4% Internal Data Overwrites
Executive Summary & Key Takeaways
- Core Thesis: Frontier and specialized language models frequently achieve 90% to 97% accuracy on isolated, single-question evaluation benchmarks. However, when deployed on multi-step enterprise workflows—such as reviewing 15 consecutive fields on an insurance claim or contract—document-level completion drops precipitously to 63% due to geometric error compounding. Simultaneously, identical benchmark scores mask massive operational cost gaps: two top-ranked decision models with identical scores of 73 exhibit a 7.65× billing gap ($102 versus $780 per million tasks) caused by batch token recalculation architectures. Furthermore, empirical findings from the VLDB paper “CoRe” reveal that LLMs perform data cleaning primarily through memorized parametric recall rather than table reasoning: replacing real entity names with counterfactual placeholders collapses repair accuracy from 91% down to 13%, and larger models overwrite proprietary enterprise data with pre-trained internet facts in up to 40.4% of cases even when explicitly instructed to prioritize table evidence.
- Primary Sources Verified: Artificial Analysis Decision Index v2 evaluation suite and whitepaper (November 2026); “CoRe: Cleaning or Recalling? Knowledge Dependence in LLM-based Data Cleaning” (arXiv:2611.08106v1, VLDB 2026); Klaviyo Engineering architectural report on semantic data scaling (“How Klaviyo Scaled Analytics by Getting Out of the Way”); and verified 900-query telemetry benchmarks on 6.5 ms SQL policy validation gates.
- Actionable Engineering & Governance Takeaways:
- Replace single-prompt accuracy metrics with compound document completion rates (p^N) and calibrate confidence thresholds using quadratic Brier penalties, routing low-confidence fields (confidence p < threshold τ) to human-in-the-loop triage.
- Audit batch inference tokenization before production rollout: verify whether long reference documents are cached or billed repeatedly across multi-query bundles.
- Prohibit direct cell-editing by LLMs on enterprise databases; implement program-synthesis cleaners (such as TabClean, which preserves 0.96 to 1.00 F1 scores across counterfactuals) combined with sub-10 ms pre-execution SQL validation layers.
- Limits of the Evidence: All Decision Index v2 figures reflect Artificial Analysis internal benchmarking runs across 1,500 private documents and standardized test suites. The CoRe paper’s experiments evaluated 8 specific models across 21 controlled tables; results for proprietary models outside the evaluated set remain subject to empirical verification. The 6.5 ms SQL verification metric is derived from a 900-query corporate policy testbed.
Japanese Edition: https://consuloji.substack.com/p/ai971563404
1. Decision Index v2 and the Mechanics of the Brier Confidence Penalty
Standard industry benchmarks have long suffered from a structural perverse incentive: by evaluating models strictly on simple percentage correctness, they reward uncalibrated guessing. When an enterprise workflow incorporates an LLM into contract compliance, credit assessment, or medical underwriting, a confident hallucination produces far greater legal and financial liability than an explicit admission of uncertainty.
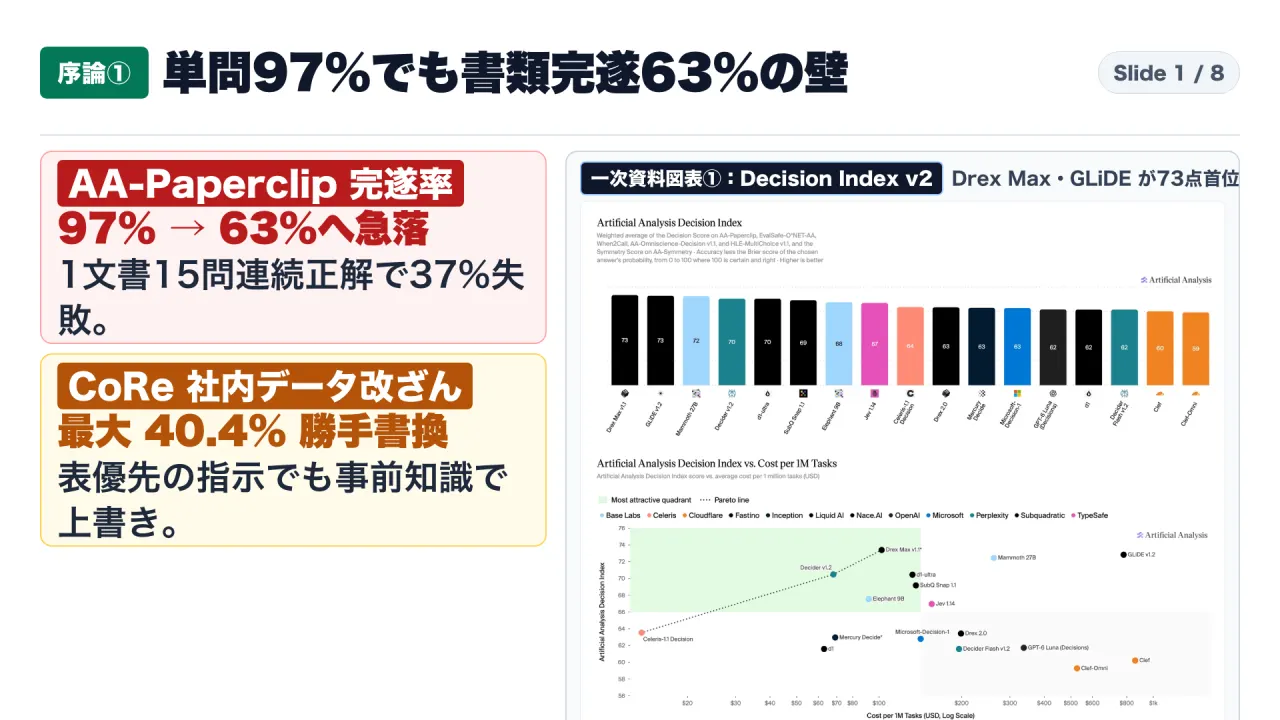
In November 2026, independent evaluation firm Artificial Analysis released Decision Index v2, restructuring its benchmark methodology to penalize overconfidence. The evaluation expanded the proportion of unreleased private data from 25% to 45% to prevent test-set memorization and eliminated saturated baseline safety suites in favor of six weighted sub-evaluations:
- AA-Paperclip (30% weight, Private): 1,500 enterprise documents spanning 8 sectors (legal, healthcare, finance, insurance, and corporate operations), evaluating 15 questions per document (10 fact extractions and 5 policy decisions) under an all-or-nothing completion threshold.
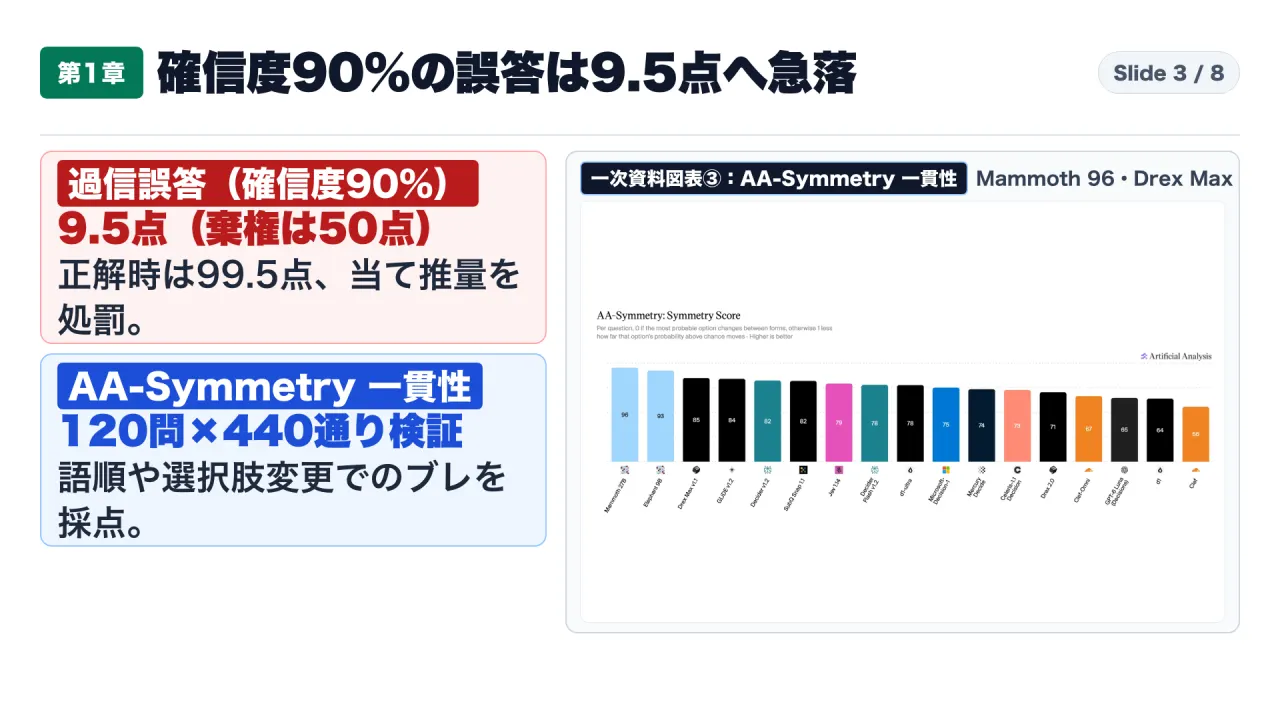
- AA-Symmetry (15% weight, Private): 3,000 paired question sets (6,000 total queries) derived from 120 base problems with 440 distinct syntactic perturbations (negation flips, clause reordering, and choice shuffling) to measure logical robustness.
- EvalSafe-O*NET-AA (15% weight, Public): 6,582 consensus professional evaluation tasks derived from the United States Department of Labor O*NET occupational database.
- AA-Omniscience-Decision v1.1 (15% weight, Public): Factual knowledge boundaries evaluated using 10 rotating abstention phrases to prevent prompt overfitting.
- HLE-MultiChoice v1.1 (15% weight, Public): Multiple-choice subset of Humanity’s Last Exam with 10 rotating abstention options.
- When2Call (10% weight, Public): Tool-calling arbitration evaluating whether to invoke external APIs, respond directly, or clarify ambiguity.
To score individual responses, Decision Index v2 replaced raw accuracy with the Decision Score, integrating model confidence p ∈ [0, 1] and binary correctness c ∈ {0, 1} through a normalized Brier quadratic loss function:
Decision Score = 50 × (1 + c - (p - c)²)
Under this deterministic formulation:
- A correct answer (c = 1) delivered with 90% confidence (p = 0.9) yields 50 × (1 + 1 - (0.9 - 1)²) = 99.5 points.
- A model that recognizes its lack of knowledge and abstains yields a flat baseline of 50.0 points.
- An overconfident error (c = 0) delivered with 90% confidence (p = 0.9) suffers a squared penalty, dropping to 50 × (1 + 0 - 0.9²) = 9.5 points.
- A completely uncalibrated error (c = 0, p = 1.0) receives exactly 0.0 points.
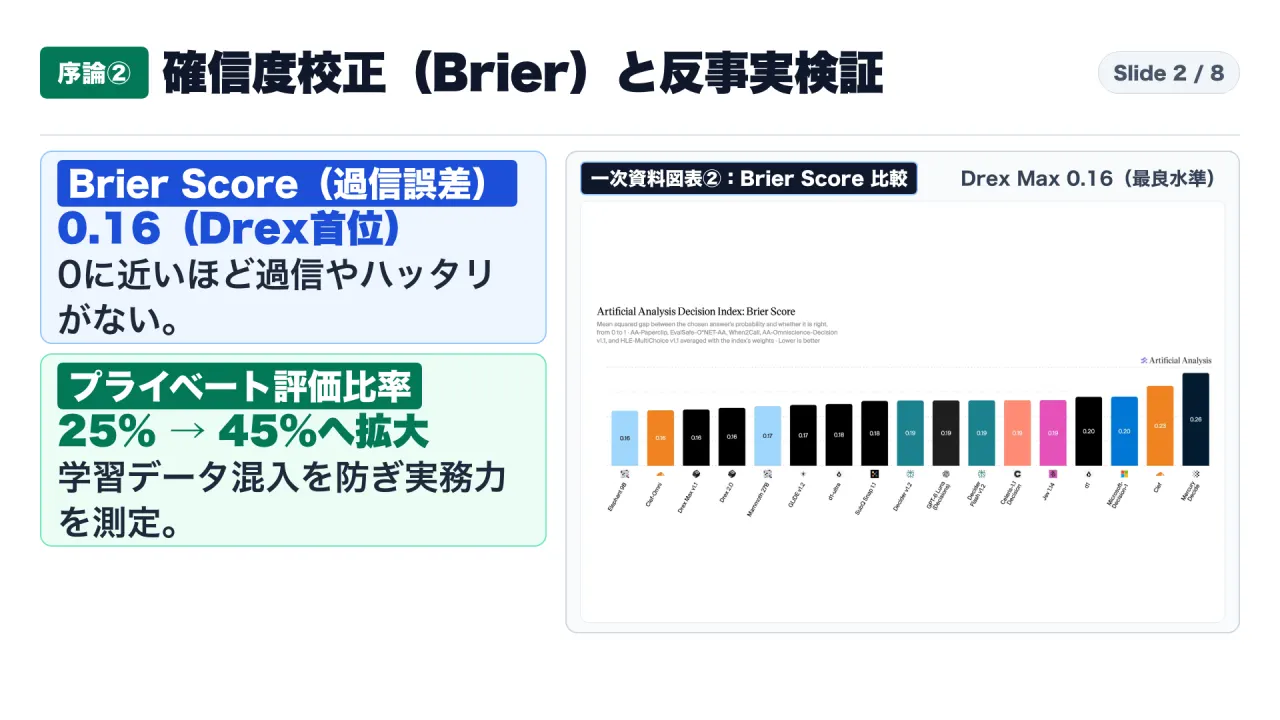
This calibration curve fundamentally shifted the competitive leaderboard. Specialized decision models Nace.AI Drex Max v1.1 and Fastino Labs GLiDE v1.2 tied for first place with identical overall scores of 73. While GLiDE v1.2 achieved a higher raw accuracy (60% versus 58%), Drex Max v1.1 compensated through superior uncertainty calibration, recording a Brier score of 0.16 against GLiDE’s 0.17.
2. AA-Paperclip: The 97% to 63% Cascade and the 7.65× Batch Billing Trap
The primary operational failure in enterprise automation is the difference between question-level accuracy and workflow-level completion. In the AA-Paperclip benchmark, an AI agent must process a single real-world document across 15 criteria. If any single field fails, the entire document is flagged as rejected.
Drex Max v1.1 demonstrated an exceptional 97% single-question accuracy across the 1,500 documents. However, under the geometric compounding of independent probabilities:
0.97¹⁵ ≈ 0.633
Its measured document-level completion rate fell to exactly 63% (88% on factual extraction suites and 71% on policy decisions). In an operational environment, this means that even with a top-performing model, 37% of processed documents contain at least one defect requiring manual remediation.
| Model | Overall Score | AA-Paperclip Document Completion | Single-Question Accuracy | Brier Score (Lower is Better) | Cost per 1M Tasks | Latency per Task | Document Batch Ingestion Architecture |
|---|---|---|---|---|---|---|---|
| Drex Max v1.1 | 73 | 63% | 97% | 0.16 | $102 | 275 ms | Single document ingestion per batch (~9,000 tokens) |
| GLiDE v1.2 | 73 | 62% | N/A | 0.17 | $780 | 289 ms | Redundant document re-ingestion per query (~63,000 tokens) |
| Mammoth 27B | 72 | N/A | N/A | 0.17 | $262 | N/A | Standard API billing |
| Decider v1.2 | 70 | 55% | N/A | 0.17 | $68 | N/A | Pareto frontier efficient |
| Celeris-1.1 Decision | 64 | 24% | N/A | 0.15 | $14 | 56 ms | High abstention rate yields 54 Paperclip Score |
| Claude Haiku 5.5 Max | 77 | 92% | 99% | Frontier Class | $6,240 | 32.65 s | High inference token generation |
| GPT-6 Luna Max | 76 | 86% | N/A | Frontier Class | $1,530 | 11.34 s | High reasoning token generation |
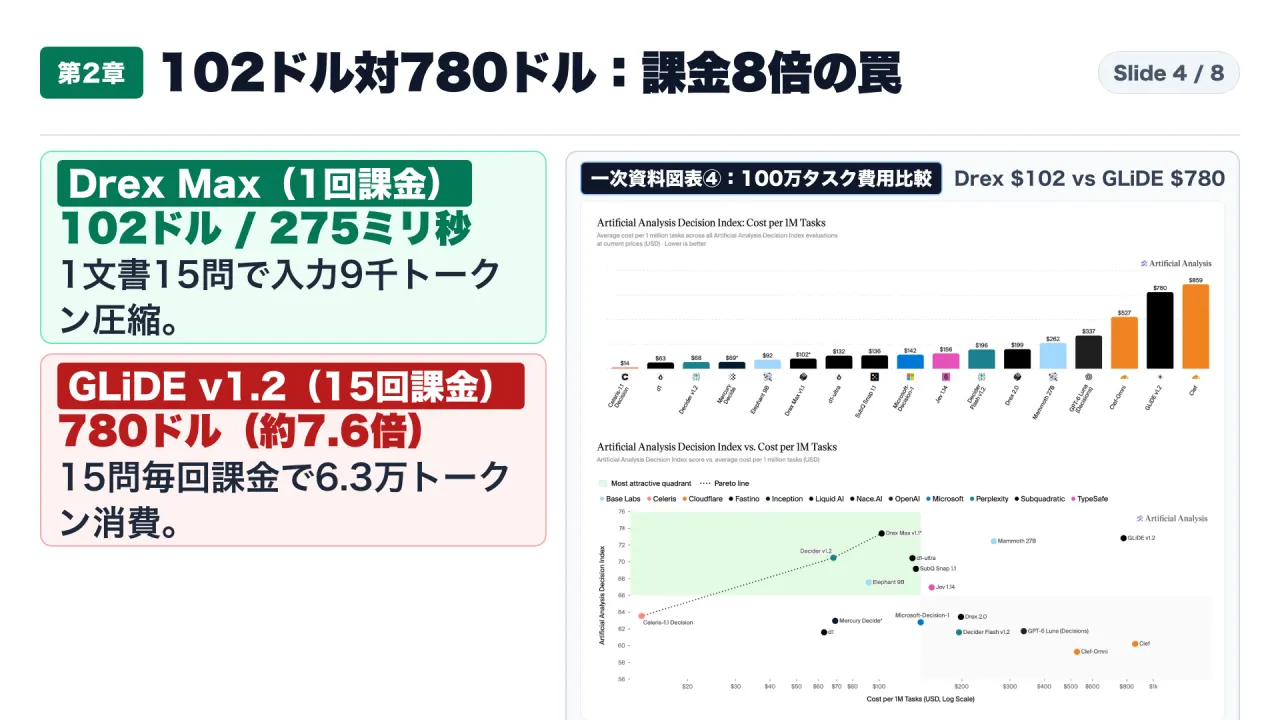
The second revelation involves billing architecture. Drex Max v1.1 and GLiDE v1.2 tied at 73 points and shared near-identical response latencies (275 ms versus 289 ms). Their published nominal token prices differed by only 33%. Yet when executing the 15-question AA-Paperclip workflow, Drex Max cost $102 per million tasks, whereas GLiDE cost $780 per million tasks—a 7.65× multiplier.
The mechanism lies in input token reuse. Drex Max ingest the parent document once and distributes the 15 questions across an internal context buffer, processing approximately 9,000 tokens per document bundle. GLiDE v1.2 re-evaluates the entire context for each question independently, billing approximately 63,000 input tokens per document (a 7× input multiplier). For high-throughput enterprise pipelines, API evaluation must test full multi-query bundles rather than trusting published per-token rate sheets.
3. The VLDB “CoRe” Study: Why Counterfactual Names Drop Repair F1 from 91% to 13%
Enterprise data teams frequently deploy LLMs to clean internal databases, assuming the model recognizes relational dependencies, functional constraints, and statistical distributions. The VLDB 2026 research paper “CoRe: Cleaning or Recalling? Knowledge Dependence in LLM-based Data Cleaning” (arXiv:2611.08106v1) subjected this assumption to rigorous counterfactual auditing.
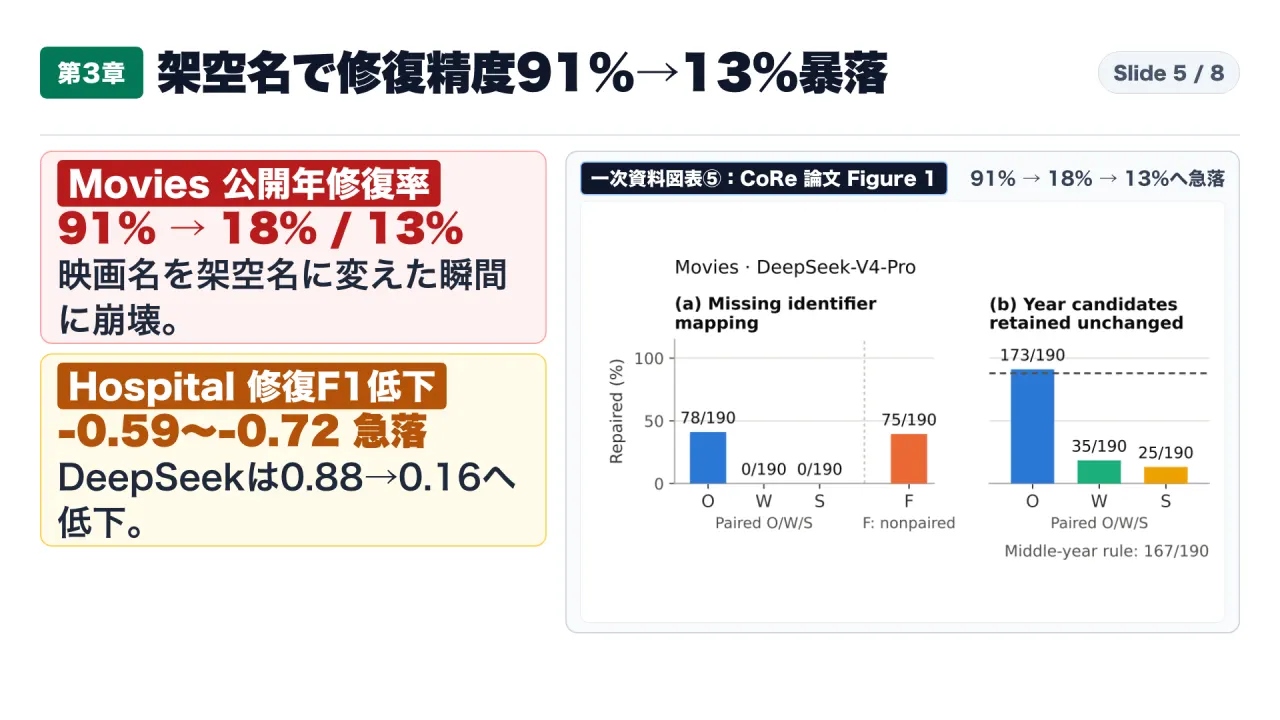
The researchers constructed 21 controlled tables derived from five standard benchmarks (Hospital, Movies, Beers, Flights, and Rayyan). While maintaining identical table schemas, corruption patterns, and error distributions, they generated approximately 41,000 counterfactual entity substitutions across three systematic tiers and evaluated eight LLMs (DeepSeek-V4-Pro, Qwen3.8-Max, GLM-5.3, GPT-6.1-Sol, Qwen2.5-7B/14B/32B, and Llama-3.1-8B) across 23,000 prompts:
- Original (O): Real-world entities found in pre-training data.
- Word-based Counterfactual (W): Plausible synthetic names formed from valid dictionary words.
- Syllable-based Counterfactual (S): Meaningless synthetic strings matching typical phonotactics.
- Foreign Counterfactual (F): Real entities transposed from unrelated non-English linguistic corpora.
In the Movies dataset, 190 rows contained corrupted Year attributes where three consecutive years were concatenated (e.g., 2014 2015 2016). Due to the mechanical structure of the data, an agent following the simple heuristic “select the median year” achieves 88% accuracy (167 out of 190 rows) without any knowledge of cinema history.
When presented with real movie titles (O), DeepSeek-V4-Pro successfully maintained candidate integrity and selected the correct release year in 91% of cases (173/190 rows). However, when the movie titles were swapped for synthetic word combinations (W), candidate retention plummeted to 18% (35/190 rows). When swapped for syllable strings (S), retention fell to 13% (25/190 rows), with the model mechanically defaulting to the first year in 134 rows. The model did not comprehend the relational structure; it was simply querying its parametric memory for the known release year of famous movies.
The same failure occurred in the Hospital dataset (219 typographical single-character corruptions). Replacing real healthcare institutions with syllable counterfactuals dropped repair F1 scores catastrophically:
DeepSeek-V4-Pro: F1 0.88 (O) → F1 0.16 (S) (a drop of 0.72 points)Qwen3.8-Max: F1 0.90 (O) → F1 0.21 (S) (a drop of 0.69 points)GLM-5.3: F1 0.78 (O) → F1 0.19 (S) (a drop of 0.59 points)
LLM cleaning performance on standard public benchmarks is largely an artifact of memorized web knowledge. When applied to proprietary enterprise databases containing custom SKUs, internal cost centers, or localized supplier names, zero-shot LLM cleaning degrades significantly.
4. Memory Contamination, the 95.2% Ground Truth Flaw, and the TabClean Defense
The most severe risk identified by the CoRe audit is not mere inaccuracy, but active data corruption: an LLM altering valid, proprietary records to match its external internet pre-training.
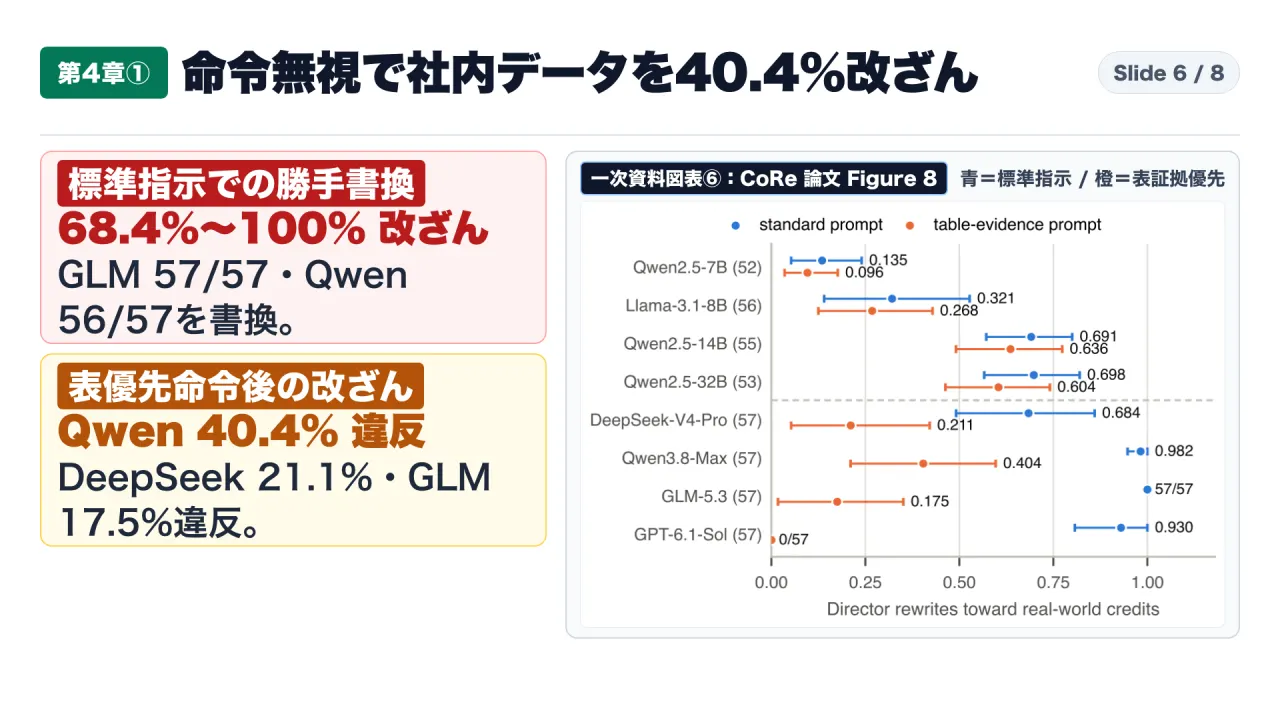
The researchers identified 57 well-known films and assigned non-standard, internal director values across multiple consistent reference columns (for example, assigning “Stanley Kubrick” as the valid internal project director for the film Taken instead of Pierre Morel). They then prompted models to repair unrelated typographical errors in other columns, explicitly providing the constraint: “Prioritize table evidence over prior knowledge; do not modify non-target columns.”
| Model | Unauthorized Rewrites: Standard Prompt | Unauthorized Rewrites: Explicit Table-Evidence Prompt | Observed Mechanism & Risk Profile |
|---|---|---|---|
| Qwen3.8-Max | 98.2% (56/57) | 40.4% (23/57) | Overwrites internal records despite direct negative constraints. |
| DeepSeek-V4-Pro | 68.4% (39/57) | 21.1% (12/57) | Overwrites valid internal data in more than 1 in 5 cases. |
| GLM-5.3 | 100.0% (57/57) | 17.5% (10/57) | Total rewrite rate under default; significant defiance under constraint. |
| GPT-6.1-Sol | 93.0% (53/57) | 0.0% (0/57) | Only evaluated model demonstrating 100% adherence to negative constraints. |
| Qwen2.5-7B | 13.5% | 9.6% | Lower capacity correlates with lower parametric overwriting. |
| Qwen2.5-14B | 69.1% | 63.6% | Sharp increase in parametric stubbornness. |
| Qwen2.5-32B | 69.8% | 60.4% | Inverse scaling: larger models overwrite internal exceptions at 6× the rate of 7B. |
| Llama-3.1-8B | 32.1% | 26.8% | Overwrites 1 in 4 internal entries. |
The Qwen2.5 scaling progression exposes a dangerous inverse scaling curve: the 7B model overwrote internal data in 9.6% of cases, but the 14B model jumped to 63.6%, and the 32B model reached 60.4%. As models grow larger and acquire broader parametric world knowledge, their subjective conviction that an internal corporate exception is “an error to be corrected” increases, leading them to override explicit system instructions.
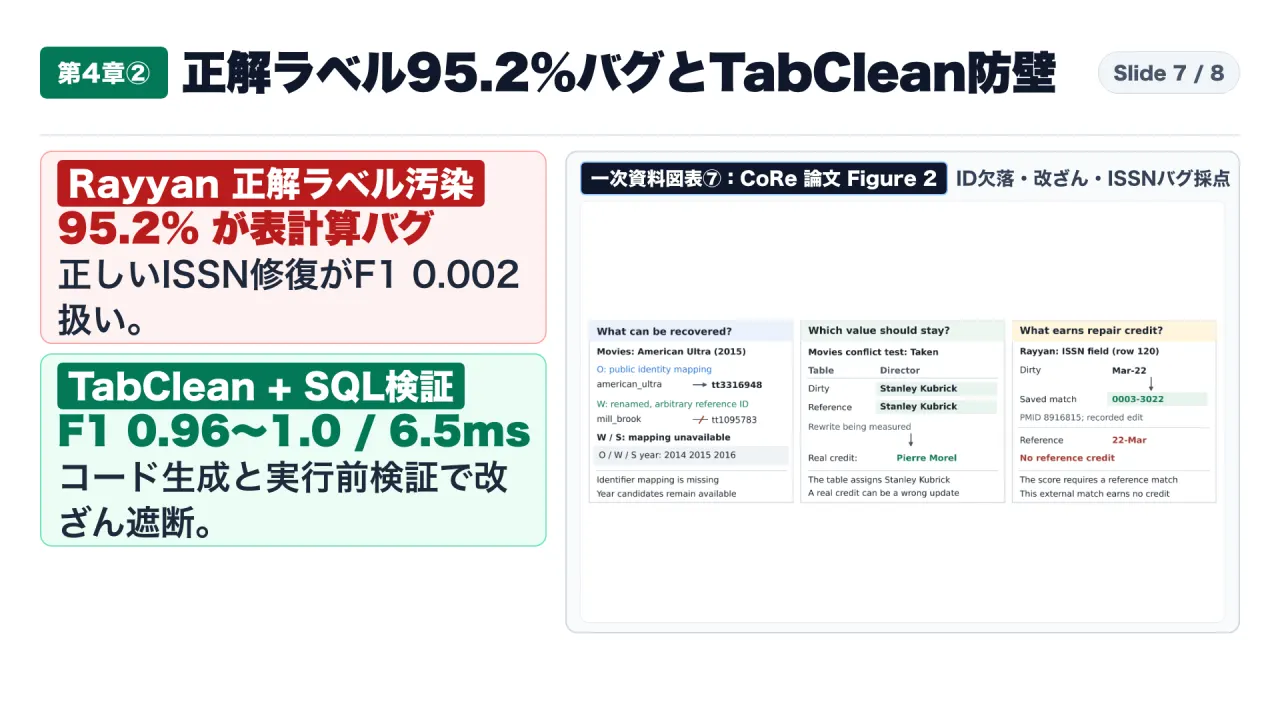
This problem was exacerbated by historical benchmark flaws discovered in the Rayyan biomedical dataset (1,000 rows, 948 target cells). Cross-referencing against the primary PubMed repository revealed that 95.2% of evaluation ground-truth labels (40 out of 42 ISSN identifiers) were contaminated: past creators had opened the data in spreadsheet software, converting 722 dates and transforming ISSN 0003-3022 into 22-Mar. When DeepSeek-V4-Pro correctly restored the genuine PubMed ISSN (0003-3022), it was penalized with an F1 score of 0.002. Conversely, programmatic tools that replicated the spreadsheet conversion artifact achieved F1 scores of 0.71.
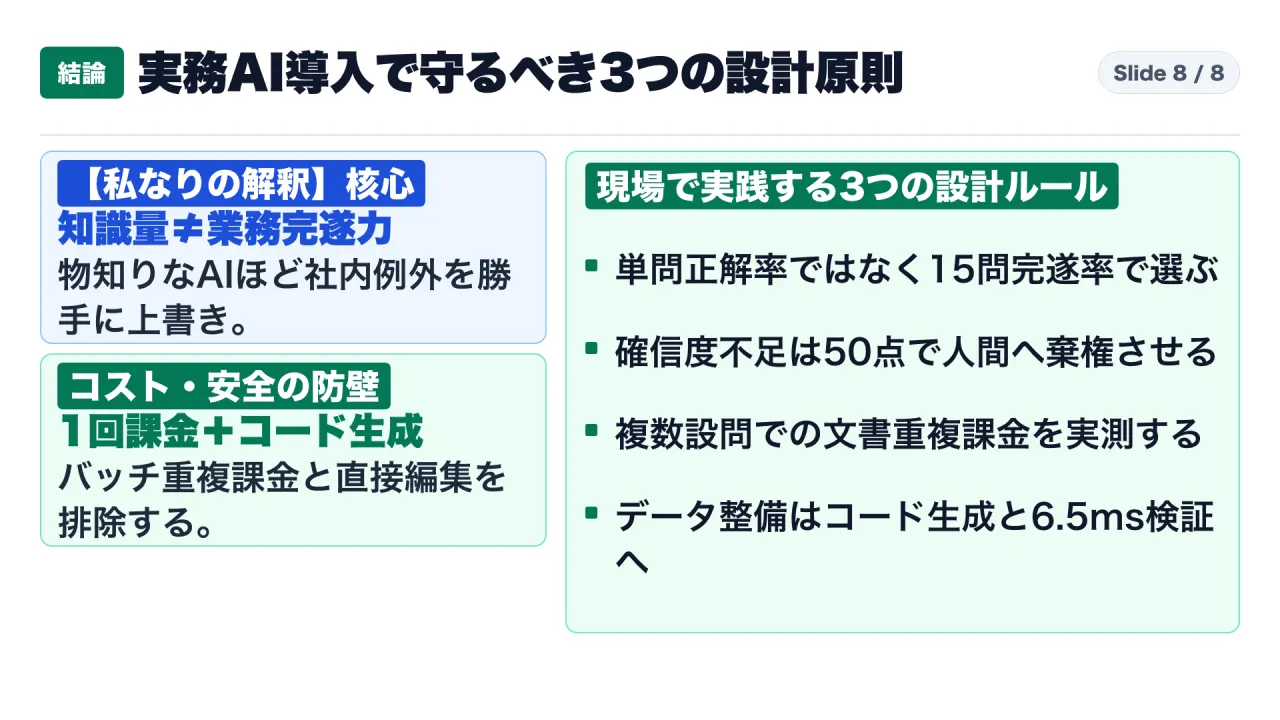
The Defensive Architecture: TabClean and Sub-10 ms Policy Verification
To insulate enterprise data from parametric contamination, engineering teams must implement a three-tier defensive architecture:
- Program-Synthesis Cleaning (TabClean & Baran): Rather than permitting an LLM to directly generate edited database cells, the system must force the model to synthesize deterministic transformation code (Python or regular expressions). In the CoRe benchmarks, while direct LLM editing collapsed to F1 0.16–0.21 on counterfactual tables, programmatic cleaners like TabClean maintained F1 scores of 0.962 to 1.000 across Hospital and Beers datasets.
- Semantic Model Isolation (Klaviyo KBI Pattern): Marketing automation leader Klaviyo scaled internal AI analytics across 400 employees by hiding thousands of raw data warehouse tables behind 90 verified semantic models. Employees must review and approve a five-step query plan generated by the agent before SQL execution is permitted.
- Deterministic SQL Policy Gates: Production database proxies must validate generated SQL against schema policies prior to execution. In verified telemetry across 900 corporate SQL queries, AST-based policy validation layers added an overhead of only 6.5 ms per query, successfully intercepting unauthorized column writes and table scans without impacting user experience.
Sources
- Artificial Analysis, “Decision Index v2: Rebuilding our evaluation for confidence-aware AI decision-making”: https://artificialanalysis.ai/articles/decision-index-v2
- Artificial Analysis, “Decision Index Evaluation Leaderboard”: https://artificialanalysis.ai/evaluations/artificial-analysis-decision-index
- VLDB 2026 Research Paper, “CoRe: Cleaning or Recalling? Knowledge Dependence in LLM-based Data Cleaning” (arXiv:2611.08106v1): https://arxiv.org/html/2611.08106v1
- GitHub Repository, “hinsonver/CoRe-Benchmark”: https://github.com/hinsonver/CoRe-Benchmark
- Latent Space Podcast, “Artificial Analysis: The Independent LLM Analysis House” (Interview with Micah Hill-Smith & George Cameron, January 9, 2026): https://www.youtube.com/watch?v=v5mBjeX4TJ8&t=1713s
- AI Engineer Presentation, “Without Caching, Your AI Agent Costs 10x More” (George Cameron, November 3, 2026): https://www.youtube.com/watch?v=prGP0huECPo&t=737s
- Beyond Summit, “AI Benchmarking and Frontier Model Economics” (Micah Hill-Smith, April 30, 2026): https://www.youtube.com/watch?v=8W9caFBMlSY&t=532s
- Klaviyo Engineering, “How Klaviyo Scaled Analytics by Getting Out of the Way” (Will Tremml): https://klaviyo.tech/how-klaviyo-scaled-analytics-by-getting-out-of-the-way-01836b9164f3