Why Anthropic's $1.4 Trillion IPO Target Faces Reality: Jack Selby on the $130B Cash Paradox, 20x Open-Source Price Arbitrage, and Counterparty Credit Contagion
A financial and technical investigation into the structural economics of frontier AI reveals how a sub-$1.0 trillion valuation correction looms as open-source models deliver 20x price discounts, $130B cash reserves reflect Treasury yields rather than operating cash flow, and multi-year compute commitments cascade counterparty credit risks across Oracle and SoftBank.
Published: November 13, 2026 | Read time: ~12 min | Watch Video (Japanese)
Executive Summary: The Widening Disconnect Between AI Capital Formation and Unit Economics
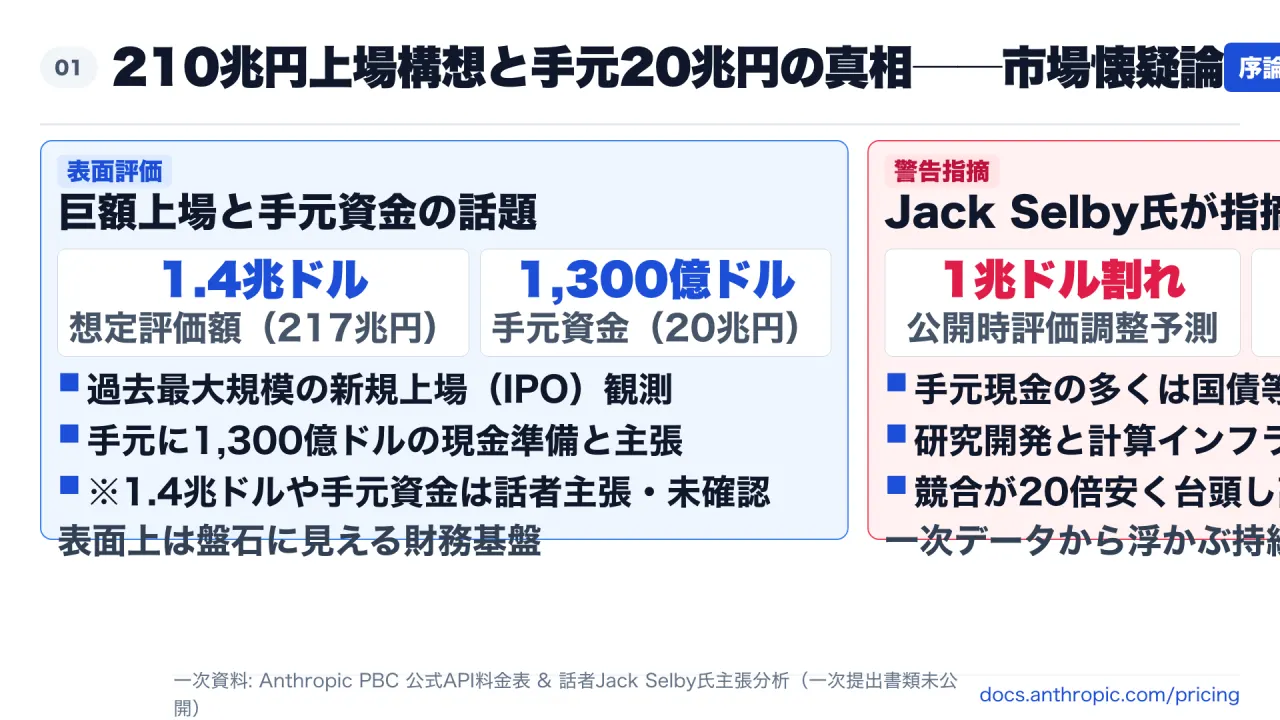
As artificial intelligence capital markets prepare for a historic liquidity event—centered around reports of Anthropic targeting an initial public offering (IPO) valuation of up to $1.40 trillion—foundational financial cracks are emerging beneath the surface of the industry’s growth narrative.
Silicon Valley veteran and Thiel Capital managing director Jack Selby—an original member of the foundational “PayPal Mafia”—issued a sharp critique of prevailing frontier model valuations. Selby argued that public equity markets will force a severe repricing to well below $1.00 trillion, driven by structural market realities:
- The $130 Billion Cash Paradox: Market commentary highlights a $130.0 billion liquid war chest, but skepticism points to unspent investor capital invested in short-term Treasuries generating interest income, rather than operational cash flow (Note: Figures regarding the $1.40T valuation target and $130.0B cash holdings reflect statements and estimates by speaker Jack Selby; official SEC registration statements have not been publicly filed).
- The 20x Open-Source Price Arbitrage: Official pricing releases confirm that open architectures like DeepSeek Flash offer $0.15 input / $0.60 output per million tokens, compared to commercial baselines like Claude Sonnet 4.5 at $3.00 input / $15.00 output—a 20x input and 25x output price divergence rapidly commoditizing the model layer into a utility.
- Multi-Year Take-or-Pay Infrastructure Commitments: Fixed commitments across cloud providers lock in high server costs, while policy lobbying in Washington faces criticism for seeking regulatory capture to protect uncompetitive margins.
- Credit Contagion Across Partners: Oracle’s latest SEC Form 10-Q reveals $664 billion in Remaining Performance Obligations (RPO) and quarterly CapEx surging to $28.499 billion, while institutional allocators like SoftBank Group face concentrated exposure to AI valuation fluctuations.
This report examines audited quarterly filings, official inference pricing schedules, and primary disclosures to evaluate the sustainability of frontier AI business models.
The $130 Billion Balance Sheet Paradox: Treasury Yields vs. Operational Cash Burn
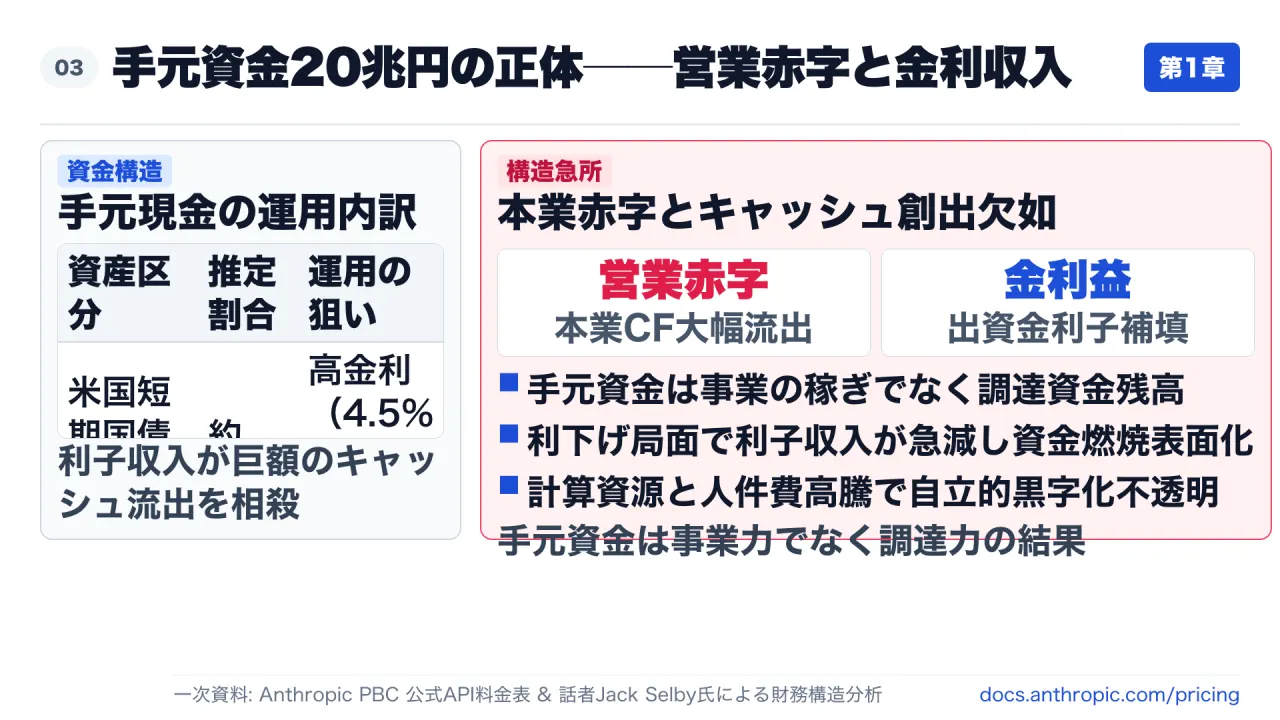
A critical pillar of market optimism has been commentary surrounding Anthropic’s reported $130.0 billion gross liquid assets. However, market observers emphasize that this balance sheet is heavily subsidized by macroeconomic risk-free rates rather than operational self-sufficiency.
| Reserve Asset Classification | Estimated Portfolio Weight | Primary Role and Return Profile |
|---|---|---|
| U.S. Treasury Bills & Notes (<12M) | ~68% | Capturing ~4.5% yields on short-term sovereign paper |
| Commercial Paper & Institutional Notes | ~24% | Prime corporate paper yield enhancement |
| Cash Deposits at Insured Institutions | ~8% | Immediate operational working capital |
The Operating Reality: Negative Operating Cash Flow
While short-term paper yields generate billions in interest income, the core operational activities of frontier model development, cluster training, and high-performance inference create substantial operational cash outflows.
In effect, unspent financing proceeds parked in sovereign paper generate coupon income that masks underlying operational burn. If benchmark interest rates ease or compute drawdowns accelerate, the liquidity buffer faces rapid erosion.
(Clarification: Financial metrics regarding Anthropic’s cash allocation and burn rate reflect market estimates and speaker commentary by Jack Selby; official primary SEC S-1 filings remain unconfirmed).
The 20x Open-Source Pricing Arbitrage and the Inevitable Commoditization of Frontier AI
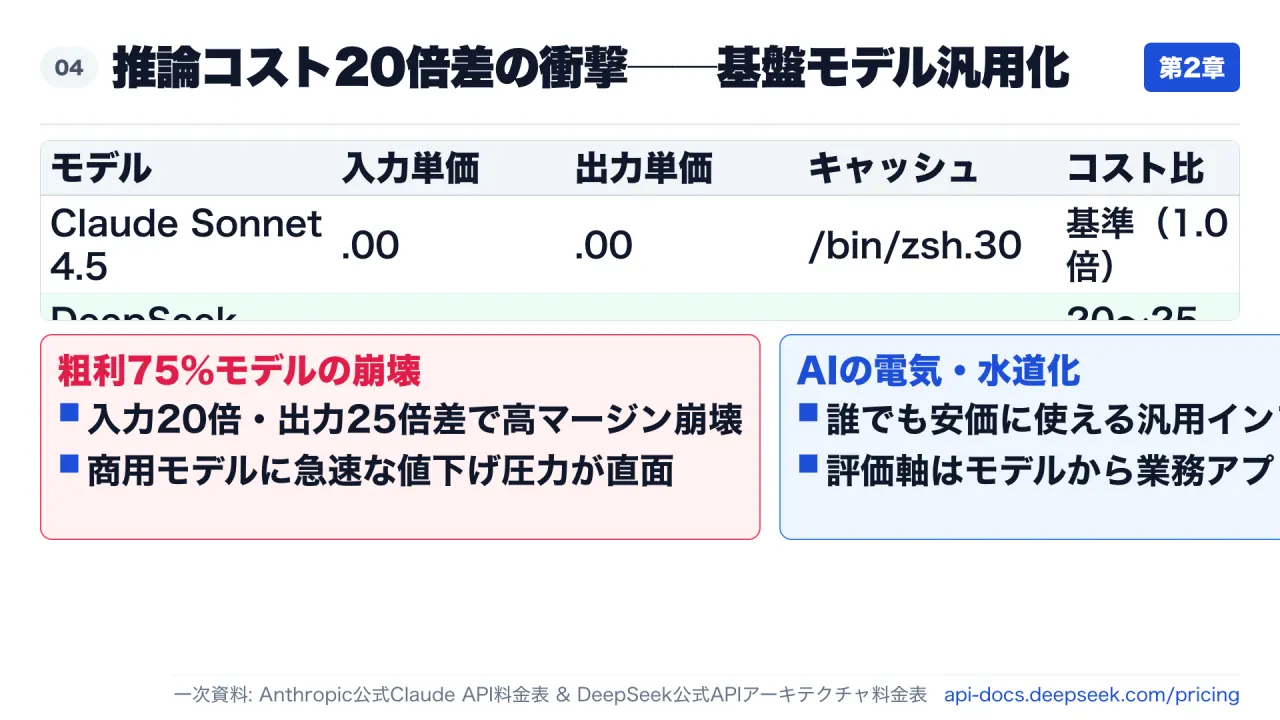
The foundational assumption justifying a $1.40 trillion valuation is that frontier model developers can maintain software-grade gross margins exceeding 75%.
Official API pricing schedules from Anthropic and DeepSeek demonstrate that economic reality has shattered this margin assumption.
| Pricing Metric (Per 1 Million Tokens) | Anthropic Claude Sonnet 4.5 (Commercial Proprietary) | DeepSeek deepseek-flash (Open Architecture, Off-Peak) | Price Disparity Factor |
|---|---|---|---|
| Standard Input Tokens (Prompt) | $3.00 | $0.15 | 20.0x cheaper |
| Cached Input Hit Tokens | $0.30 | $0.003 | 100.0x cheaper |
| Generated Output Tokens (Completion) | $15.00 | $0.60 | 25.0x cheaper |
| Peak Pricing (Input / Output) | $3.00 / $15.00 | $0.30 / $1.20 | 10.0x / 12.5x cheaper |
Comparing standard prompt input rates, Claude Sonnet 4.5 stands at $3.00 per million tokens while DeepSeek Flash off-peak is priced at $0.15—an exact 20-fold price divergence. On completions, Sonnet 4.5 costs $15.00 compared to DeepSeek’s $0.60, representing a 25-fold discount. Furthermore, DeepSeek’s prompt cache hit price of $0.003 highlights radical architectural efficiencies.
As functional performance between commercial endpoints and open-weight models narrows in enterprise coding and document synthesis, intelligence is rapidly transitioning from a proprietary luxury good into a public utility like electricity or water. Public utilities cannot sustain 100x+ price-to-sales multiples.
Fixed Infrastructure Obligations vs. Policy Lobbying in Washington
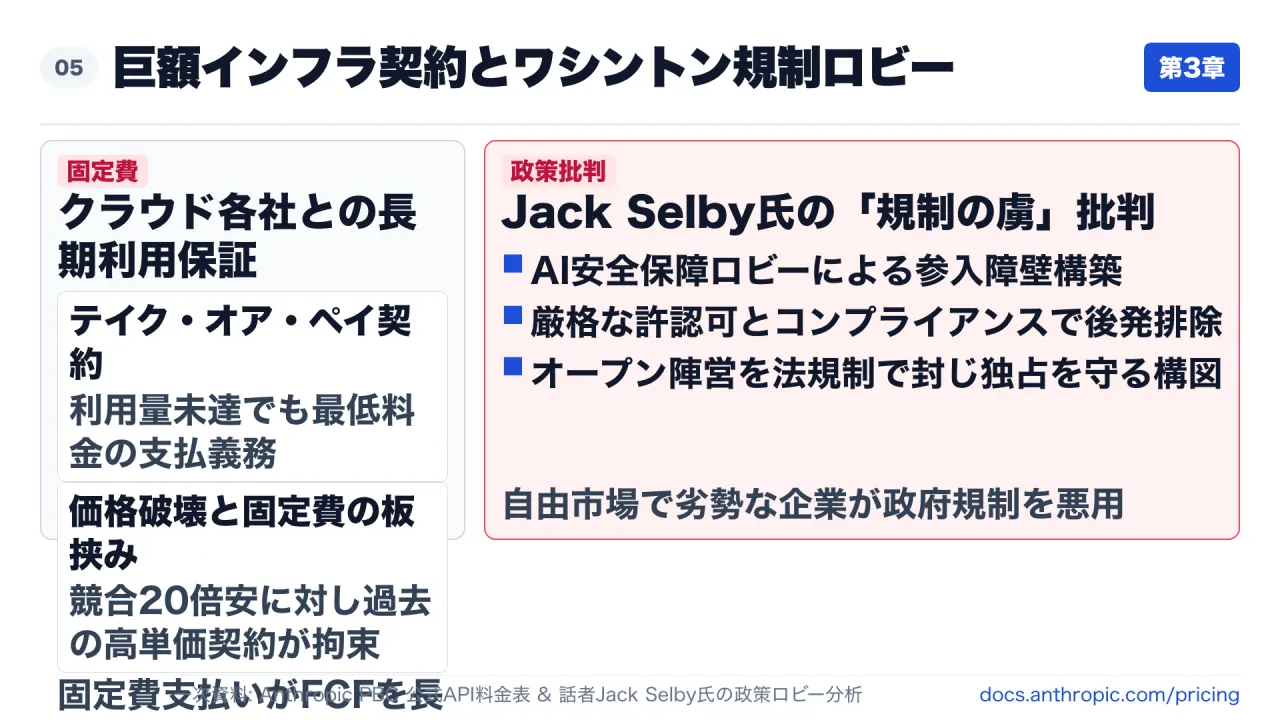
While inference prices collapse, frontier developers remain bound by multi-year cloud compute contracts. Under typical take-or-pay arrangements, companies must service fixed infrastructure minimums regardless of end-user pricing pressure.
In response, prominent tech leaders have faced scrutiny over policy lobbying in Washington. Critics like Selby argue that pushing for extensive national security licensing regimes and stringent safety standards functions as regulatory capture, erecting barriers to lock out open-source developers and insulate uncompetitive cost structures from free market dynamics.
Counterparty Risk: Financial Exposure Across Cloud Hyperscalers and Institutional Capital
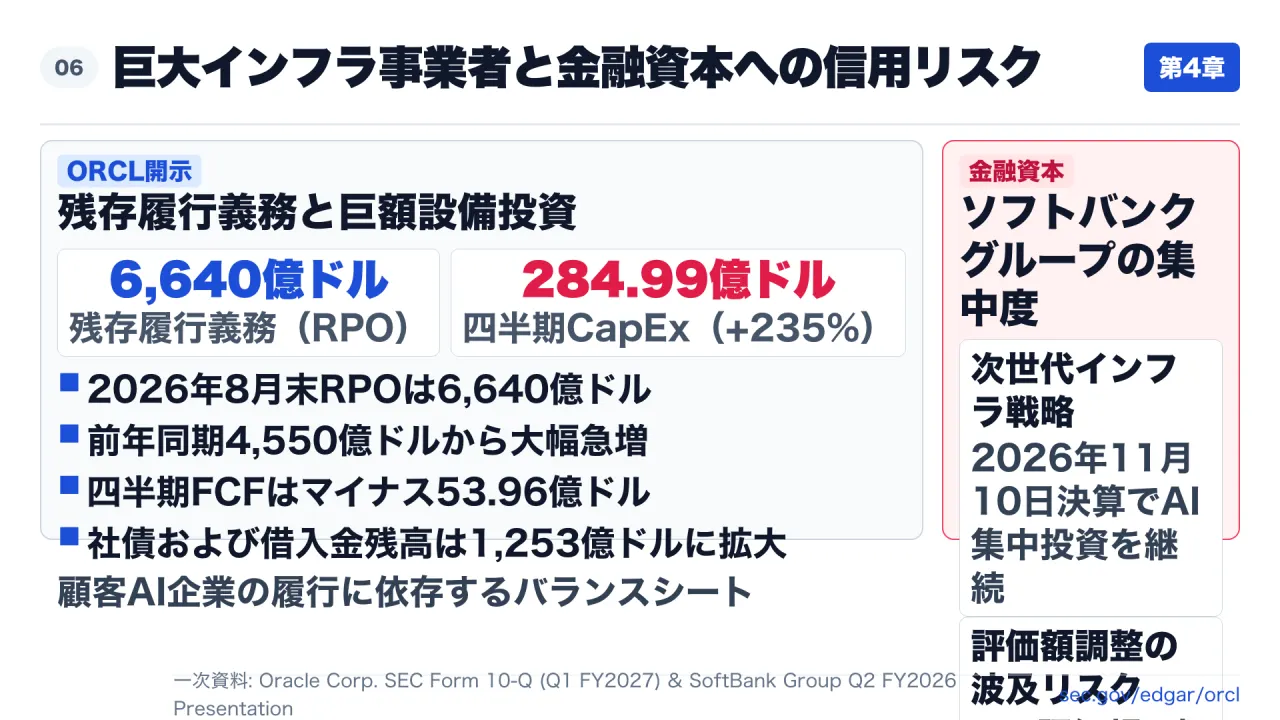
Structural valuation adjustments do not remain contained to model developers; they propagate across infrastructure suppliers and financial sponsors.
1. Oracle Corporation: SEC Form 10-Q Disclosures (Quarter Ended August 31, 2026)
Oracle’s latest quarterly filing filed with the SEC provides verified figures on cloud infrastructure scale:
- Remaining Performance Obligations (RPO): Reached $664 billion as of August 31, 2026, up substantially from $455 billion in August 2025, driven primarily by large cloud contracts.
- Quarterly Capital Expenditures: Surged to $28.499 billion for the three-month period (a 235% increase from $8.502 billion in the prior-year period).
- Free Cash Flow: Stood at negative $(5.396) billion for the quarter.
- Notes Payable and Borrowings: Totaled $125.337 billion ($7.625 billion current, $117.712 billion non-current).
As cloud providers commit tens of billions in CapEx and expand balance sheet leverage to build AI data centers, counterparty payment fulfillment becomes a primary risk determinant.
2. SoftBank Group: Sensitivity to Valuation Re-Rating
SoftBank Group’s Q2 FY2026 investor presentation (November 10, 2026) outlines ongoing large-scale capital allocation into AI data centers and next-generation infrastructure. Given significant portfolio concentration in artificial intelligence, downward valuation adjustments in frontier AI directly pressure group net asset values and equity earnings.
Structural Transition from Capital-Intensive Labs to Computing Utilities
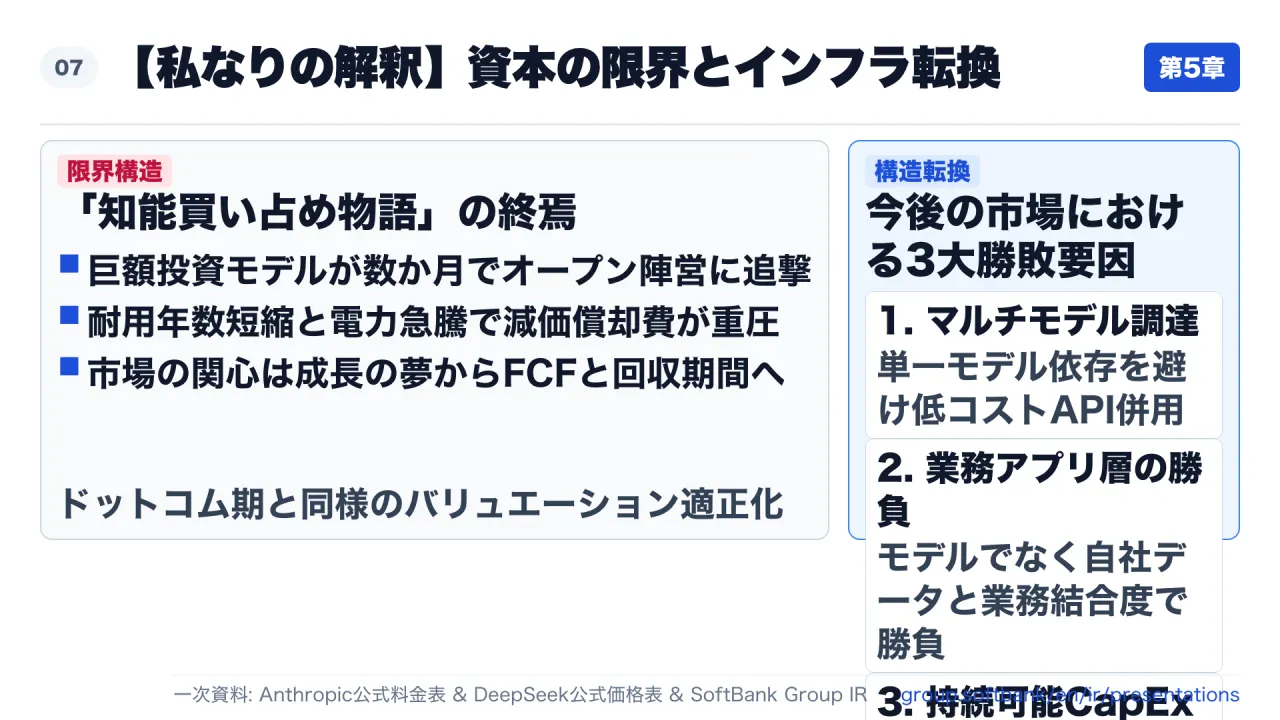
The capital model that propelled the initial AI surge—pouring tens of billions of dollars into compute under the narrative of near-term AGI—is confronting economic reality.
Public markets are shifting toward strict cash flow and capital efficiency:
- Multi-Model Heterogeneity: Enterprise IT is abandoning single-model lock-in in favor of dynamic routing across open architectures and low-cost API endpoints.
- Value in the Application Layer: Defensible gross margins reside not in commoditized model weights, but in proprietary data integration and domain-specific workflow execution.
- Rationalized Infrastructure Deployment: Hyperscalers must align CapEx commitments with sustainable commercial end-user demand.
Actionable Governance Framework for Enterprise Decision-Makers
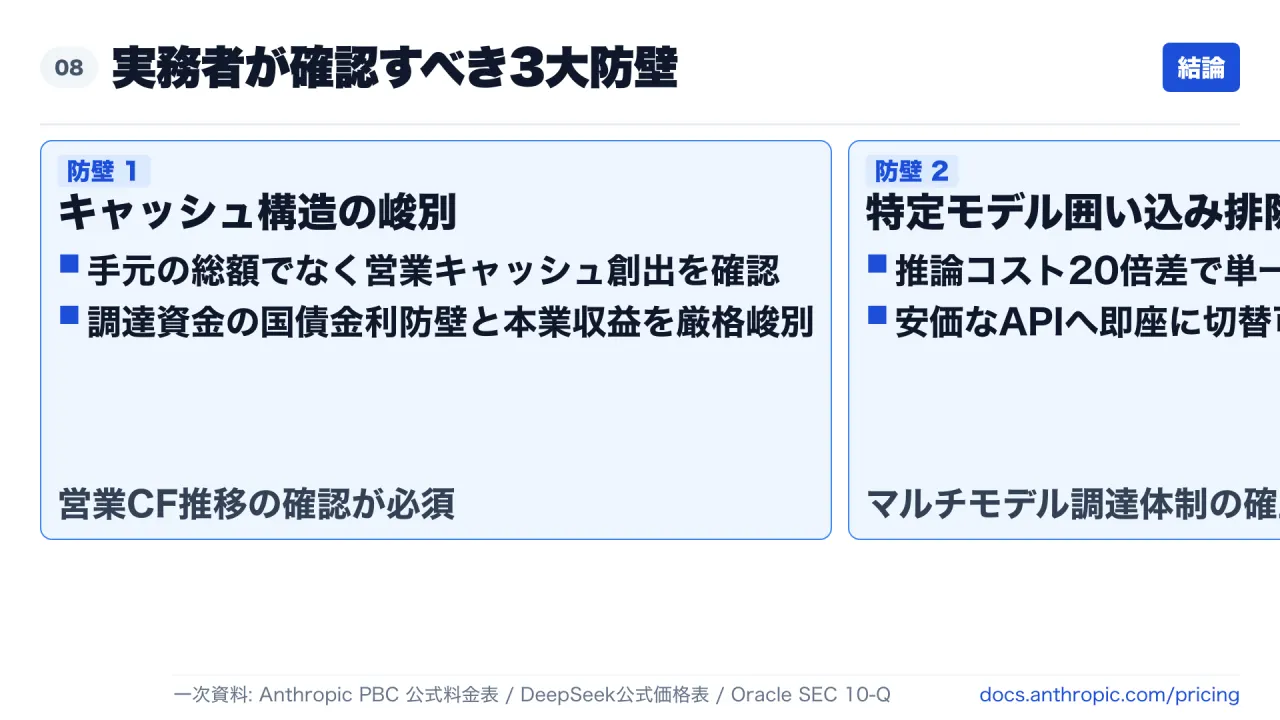
To navigate upcoming market realignments, corporate leaders should enforce three operational disciplines:
- Differentiate Operating Cash Flow from Gross Liquidity: In evaluating vendor sustainability, separate treasury interest income from underlying software gross margin and operating cash burn.
- Eliminate Proprietary Model Lock-In: Architect enterprise middleware with model-agnostic layers, ensuring workloads can immediately pivot to open-source or cost-effective APIs.
- Build for Utility Economics: Assume compute costs trend toward commodity levels, anchoring corporate competitive advantage in internal proprietary data and integrated business processes.