BlackRock's $6.79T SEC Form 13F-HR: What $787.1B in Chip Exposure and Split-Adjusted Filings Show
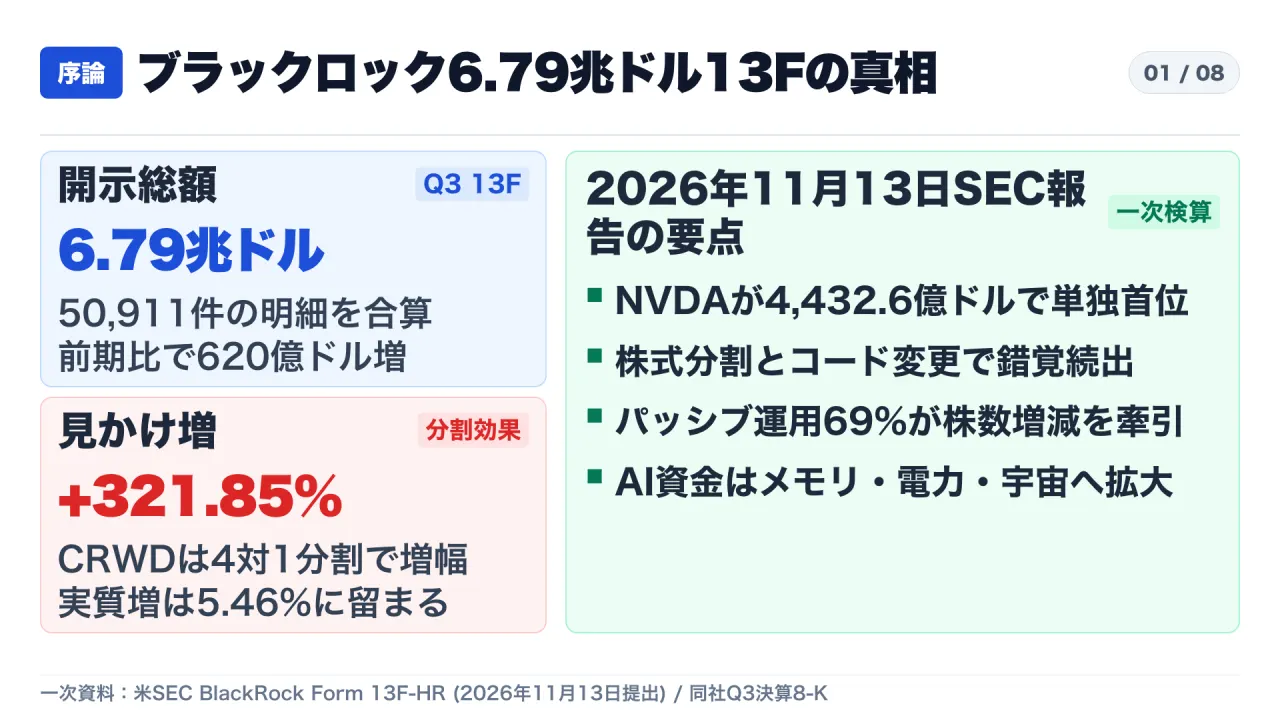
On November 13, 2026, BlackRock, Inc. filed its Q3 2026 Form 13F-HR (period ended September 30, 2026; Accession No. 0002012383-26-003985; File No. 028-24466) with the U.S. Securities and Exchange Commission (SEC). The filing reports $6,791,591,104,981 (approximately $6.79 trillion) in Section 13(f) securities across 50,911 line items, led by Nvidia (NVDA) at $443.26 billion (6.53% of the reported portfolio).
Japanese Edition: Read the original Japanese article on Substack
Video Episode (Japanese Audio): Watch on YouTube
Headline trackers and automated screening dashboards frequently misread these quarterly filings by treating raw share-count jumps or corporate restructurings as active conviction bets. Cross-checking BlackRock’s Q3 and Q2 form13fInfoTable.xml filings directly against BlackRock’s Q3 2026 earnings Form 8-K (Ex-99.1, filed October 14, 2026) and issuer Form 8-K disclosures separates three mechanical illusions—stock splits, CUSIP identifier transitions, and passive fund flows—from the actual capital shifts across semiconductors, memory, power infrastructure, and space-based compute. (This analysis examines primary regulatory filings for structural insight and does not constitute investment advice.)
- Core Thesis: Of BlackRock’s
$15.49 trillionfirmwide assets under management (AUM),69%sits in index-tracking products (41%iShares ETFs and28%non-ETF index mandates), and Form 13F-HR aggregates30investment-managing subsidiaries. Meanwhile, headline share surges such as CrowdStrike (+321.85%raw vs.+5.46%split-adjusted) and Amphenol (+102.82%raw vs.+1.41%split-adjusted), as well as ONEOK’s apparent$5.3 billion“new position” (-2.93%actual change after a CUSIP switch), reflect corporate actions rather than sudden conviction shifts, while four semiconductor holdings total$787.1 billion($787.14 billionunrounded,11.59%of the 13F portfolio). - Primary Sources Verified: SEC EDGAR BlackRock Q3 2026 Form 13F-HR (
primary_doc.xmlandform13fInfoTable.xml), BlackRock Q2 2026 Form 13F-HR (form13fInfoTable.xml), BlackRock Q3 2026 Form 8-K Ex-99.1, CrowdStrike Form 8-K Ex-99.1 (June 3, 2026), Amphenol IR Split History & Form 8-K (August 6, 2026), ONEOK Form 8-K (August 31, 2026), and SpaceX Q3 2026 Form 8-K Ex-99.1 (October 20, 2026). - Actionable Analytical Takeaways: For analysts and corporate strategy teams—including institutional and overseas observers monitoring U.S. 13F disclosures—every
>100%share-count jump or “new” multi-billion-dollar entry requires an immediate Form 8-K split/CUSIP check, separation of price-appreciation effects from net share additions, and strict recognition of the 45-day reporting lag and non-13(f) exclusions.
1. Situating $6.79 Trillion Inside $15.49 Trillion of Firmwide AUM
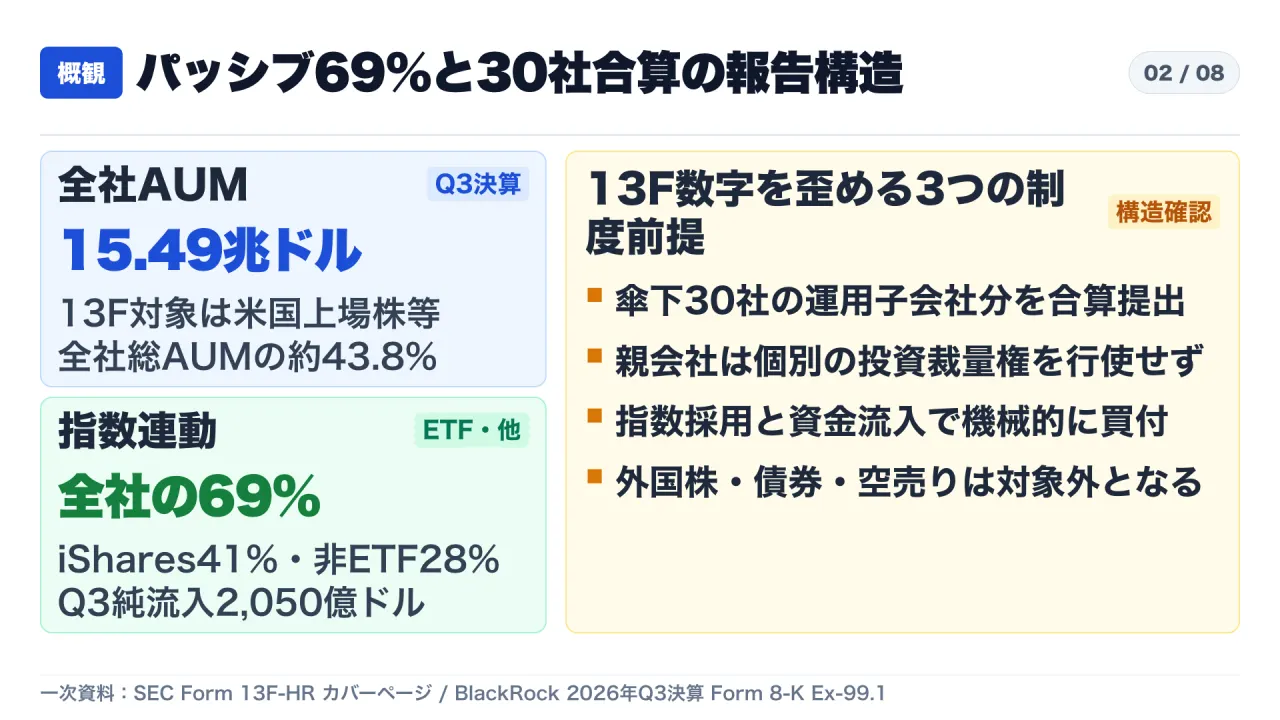
Treating BlackRock’s Form 13F-HR as a single portfolio manager’s discretionary call misinterprets how the filing is constructed. On the cover page (additionalInformation) of its Q3 2026 Form 13F-HR, the parent entity explicitly states that it does not exercise investment discretion over any Section 13(f) securities and files a 13F Combination Report aggregating 30 reporting investment-managing subsidiaries (otherIncludedManagersCount: 30).
Reconciling the 13F total against BlackRock’s Q3 2026 earnings release (Form 8-K Ex-99.1, October 14, 2026) clarifies why passive indexing dominates share-count movements:
| AUM Segment (as of September 30, 2026) | Value ($ Millions) | Share of Total AUM | Scope & Mechanism |
|---|---|---|---|
| Total Firmwide AUM | $15,488,263 | 100.0% | Equities, fixed income, multi-asset, alternatives, and cash |
| iShares ETFs | $6,358,457 | 41% | Includes $4,769,980M in equity ETFs |
| Non-ETF Index Mandates | $4,356,747 | 28% | Includes $3,569,272M in equity index strategies |
| Active Strategies | $3,671,914 | 24% | Includes $644,722M in active equities |
| Cash Management | $1,101,145 | 7% | Short-term liquidity instruments |
| Total Equity AUM | $8,983,974 | 57% | Global public equity mandates |
| Form 13F-HR Reported Total | $6,791,591 | ~43.8% | U.S.-listed Section 13(f) securities only (~75.6% of equity AUM) |
Combined, iShares ETFs (41%) and non-ETF index funds (28%) account for 69% of BlackRock’s total AUM. Moreover, out of $205,466 million (~$205 billion) in net Q3 inflows across the firm, $135 billion entered iShares ETFs. Conceptually, the filing resembles aggregating every parcel delivered to a massive apartment building’s mailroom: the building manager is reporting the combined orders of thousands of residents and automated index rules, not expressing a single discretionary taste. In addition, Form 13F excludes non-U.S. equities, bonds, short positions, and most derivatives.
2. Top-10 Concentration and $787.1B in Four Semiconductor Leaders
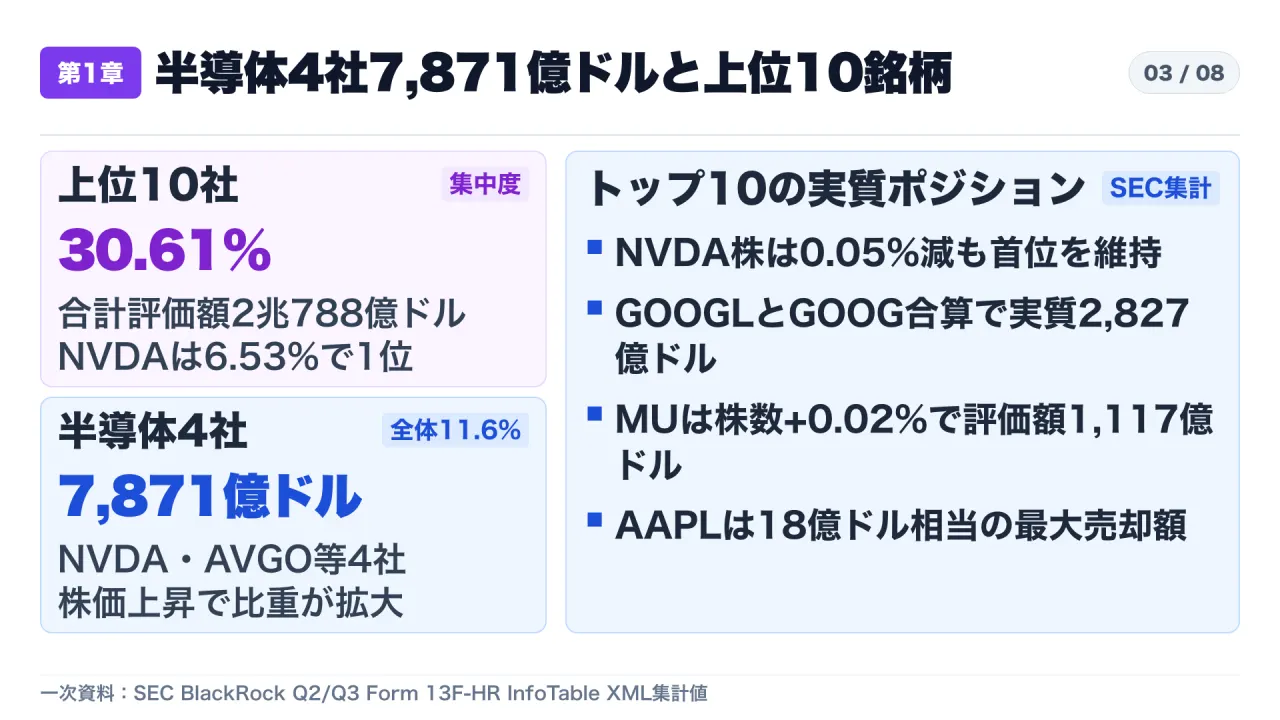
Aggregating every line item by CUSIP across the Q2 2026 XML (49,968 rows, $6,729,538,649,155) and Q3 2026 XML (50,911 rows, $6,791,591,104,981) shows a quarter-over-quarter increase of roughly $62.05 billion (+0.92%). The top 10 positions total approximately $2.0788 trillion (30.61% of the portfolio):
| Rank | Issuer (Ticker) | Q3 Value ($B) | Portfolio Weight | Q3 Shares | QoQ Share Change |
|---|---|---|---|---|---|
| 1 | Nvidia (NVDA) | $443.26B | 6.53% | 1,940,885,915 | -0.05% |
| 2 | Apple (AAPL) | $385.33B | 5.67% | 1,157,077,341 | -0.51% |
| 3 | Microsoft (MSFT) | $311.39B | 4.58% | 607,119,181 | -0.04% |
| 4 | Amazon (AMZN) | $186.33B | 2.74% | 747,880,787 | -0.07% |
| 5 | Alphabet Class A (GOOGL) | $157.94B | 2.33% | 459,026,815 | -0.42% |
| 6 | Broadcom (AVGO) | $138.92B | 2.05% | 395,562,035 | -0.67% |
| 7 | Meta Platforms (META) | $125.92B | 1.85% | 173,634,368 | +0.14% |
| 8 | Alphabet Class C (GOOG) | $124.76B | 1.84% | 366,136,908 | -1.02% |
| 9 | Micron Technology (MU) | $111.67B | 1.64% | 104,845,553 | +0.02% |
| 10 | AMD (AMD) | $93.29B | 1.37% | 152,491,791 | +1.46% |
Three structural details stand out in the primary XML totals:
- Price Appreciation vs. Share Accumulation: Nvidia remained #1 ahead of Apple (
$385.33B,-0.51%shares, roughly$1.8Bin share reductions) by$57.9 billion, even though BlackRock’s Nvidia share count edged down-0.05%. Market-cap appreciation, not aggressive buying, widened the lead. - Split Share Classes: Because Alphabet reports Class A (
GOOGL) and non-voting Class C (GOOG) on separate lines, it ranks #5 and #8 individually; combined, Alphabet totals$282.70 billion(4.16%), making it BlackRock’s fourth-largest equity exposure ahead of Amazon. - $787.1B Semiconductor Concentration: Summing Nvidia (
$443.26B), Broadcom ($138.92B), Micron ($111.67B), and AMD ($93.29B) yields$787.14 billion($787.1Brounded,11.59%of total 13F value). Micron’s share count barely moved (+0.02%), yet its dollar value rose to$111.67 billionon memory pricing and AI server demand.
3. Three Illusions Created by Stock Splits and CUSIP Reorganizations
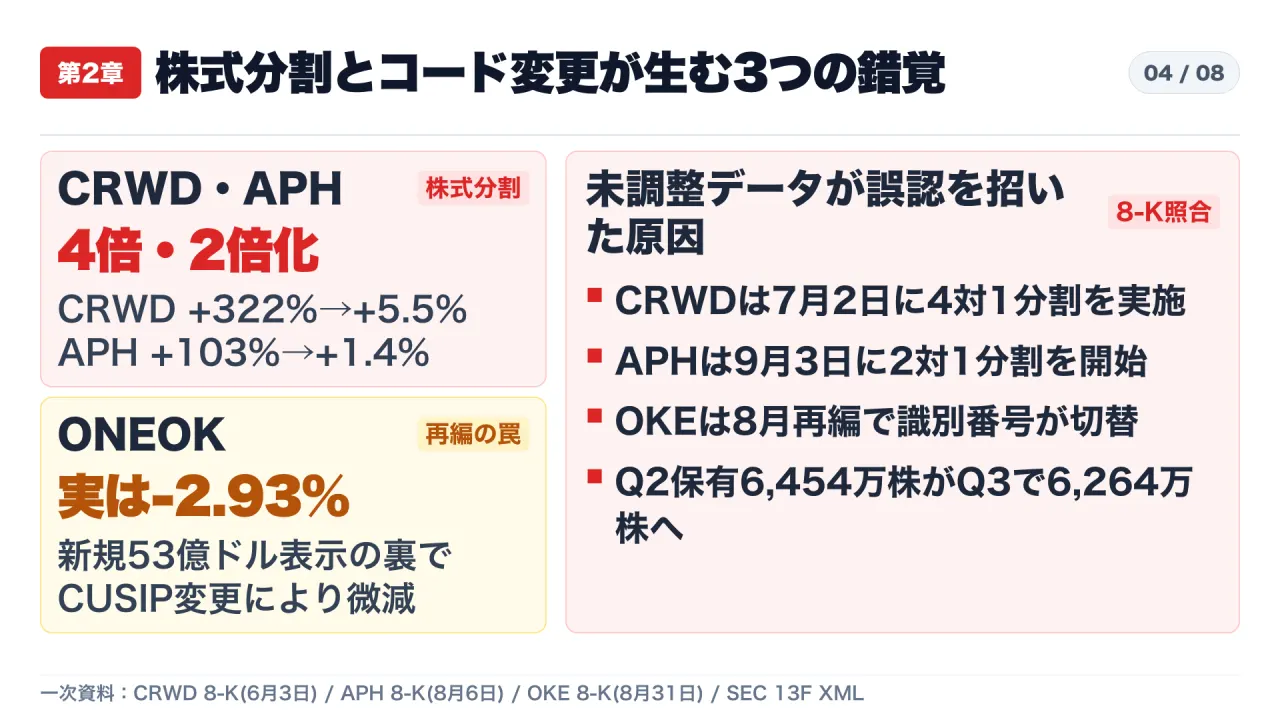
Unadjusted screening tools routinely flag corporate actions as massive buying sprees. Matching SEC Form 8-K filings directly against Q2 and Q3 XML entries overturns three widely circulated headline claims:
| Issuer (Ticker) | Unadjusted Headline Figure | Primary Corporate Action (Form 8-K) | Split/CUSIP-Adjusted Change | Q3 Holding |
|---|---|---|---|---|
| CrowdStrike (CRWD) | +321.85% raw share jump | 4-for-1 stock split (announced June 3, 2026; ex-split July 2, 2026) | +5.46% | 92,159,102 shares / $24.40B |
| Amphenol (APH) | +102.82% raw share jump | 2-for-1 stock split (announced August 6, 2026; split trading September 3, 2026) | +1.41% | 205,363,064 shares / $17.31B |
| ONEOK (OKE) | Reported as “$5.3B new buy” | Falcon TopCo restructuring (Form 8-K August 31, 2026): CUSIP changed 682680103 → 30609A109 |
-2.93% | 62,644,218 shares / $5.34B |
In CrowdStrike’s case, Q2 holdings of 21,846,397 pre-split shares correspond to 87,385,588 post-split shares (21,846,397 × 4), meaning the Q3 total of 92,159,102 shares represents +5.46% net buying alongside 24% YoY ARR growth to $5.51B—not a fourfold bet. Similarly, Amphenol’s jump from 101,252,038 to 205,363,064 shares adjusts to +1.41% after accounting for the 2-for-1 split.
ONEOK illustrates an even subtler trap: following an August 31, 2026 holding-company reorganization under Falcon TopCo (renamed ONEOK, Inc.), its CUSIP switched from 682680103 to 30609A109. Trackers matching only by CUSIP misclassified the new identifier as a $5.3 billion initiation, whereas Q2 XML already held 64,537,467 shares ($5.61B) under the old CUSIP—making the Q3 position of 62,644,218 shares ($5.34B) a -2.93% reduction. A parallel identifier shift occurred with ExxonMobil (30231G102 → 30233Q108, ExxonMobil Holdings Corp), where holdings moved -1.05% from 334,746,496 to 331,225,100 shares.
4. Genuine Capital Shifts, SpaceX’s +46.46% Surge, and Full-XML Verification
Once split and identifier artifacts are stripped out, genuine Q3 share-count expansions emerge across memory, semiconductor equipment, power, and orbital infrastructure:
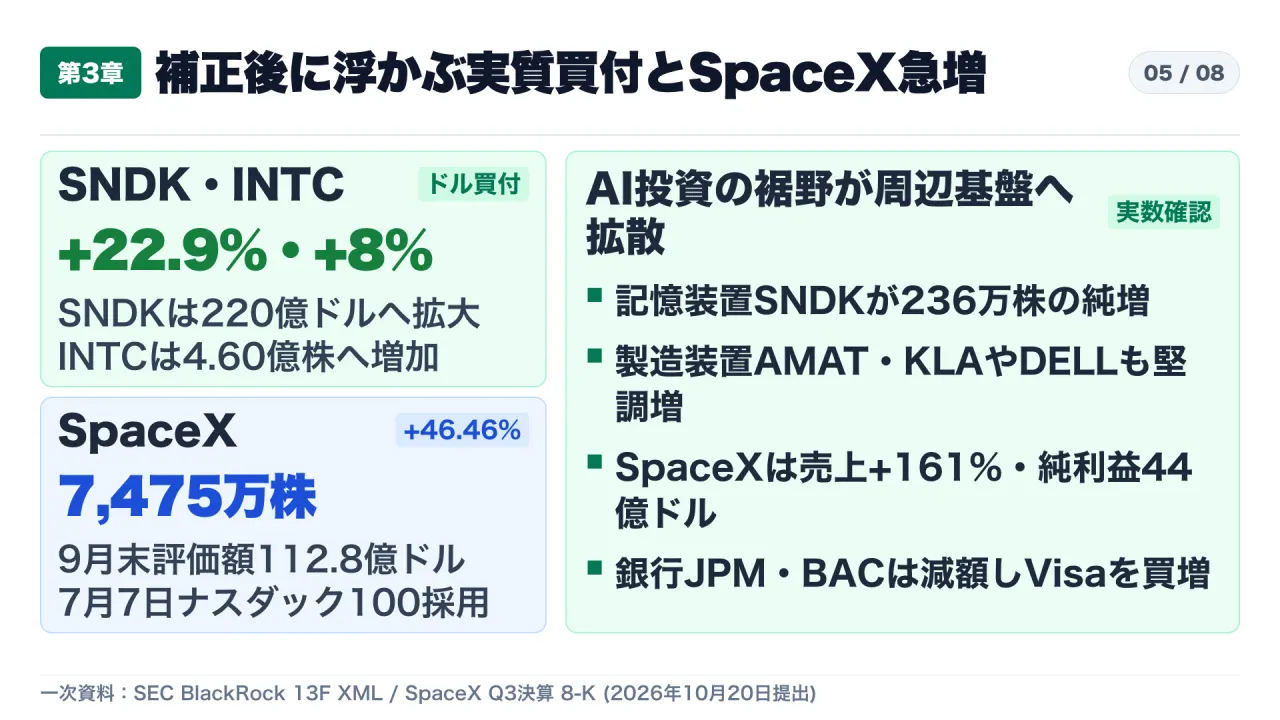
- Memory, Foundries, and Server Hardware: SanDisk (
SNDK) rose+22.94%(10,295,300→12,657,009shares,$22.02B), Intel (INTC) increased+7.98%(426,478,962→460,492,943shares,$55.37B), Dell Technologies (DELL) climbed+8.52%(24,094,119→26,146,266shares,$14.07B), KLA (KLAC) added+2.95%($25.33B), and Applied Materials (AMAT) added+1.58%($41.67B). - SpaceX (
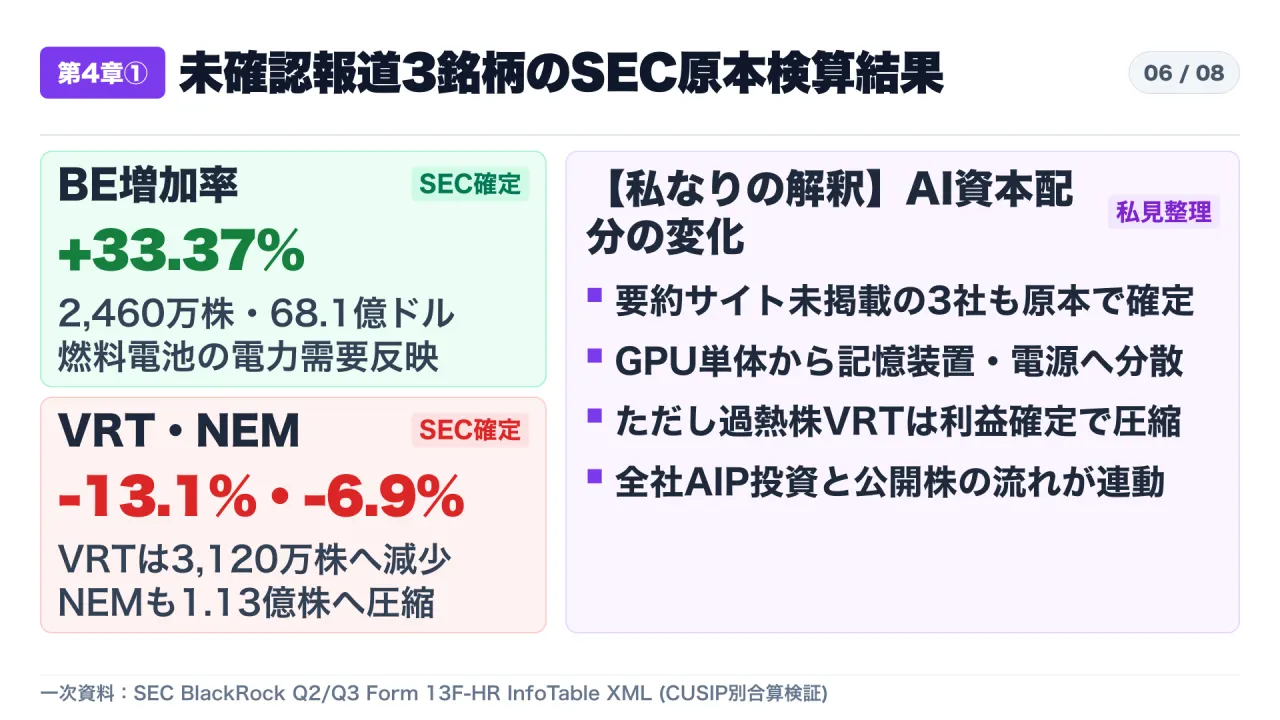
SPCX) +46.46%: Holdings jumped from51,037,137shares ($8.72B) in Q2 to74,748,399shares ($11.28Bat Q3 filing value). Two drivers aligned: early inclusion in the Nasdaq-100 on July 7, 2026 (triggering mechanical index buying) and operational scale reflected in SpaceX’s October 20, 2026 Q3 Form 8-K Ex-99.1 (+161%YoY revenue to$14.6Band$4.4Bnet income vs. a$1.1Bloss a year prior). - Full-XML Audit of Three Unverified Media Claims: Several summary reports noted they could not verify Q3 changes for three sub-top-50 tickers. Parsing every row of the
>23 MBofficial Q2 and Q3 XML files confirms all three directly:- Bloom Energy (
BE, CUSIP093712107):18,442,336→24,596,598shares (+33.37%,$6.81B) - Vertiv Holdings (
VRT, CUSIP92537N108):35,921,459→31,202,611shares (-13.14%,$7.53B) - Newmont Corp (
NEM, CUSIP651639106):120,875,298→112,594,100shares (-6.85%,$12.99B)
- Bloom Energy (
- Select Reductions: Alongside Apple (
-0.51%) and combined Alphabet (~$1.98Bimplied share reduction), BlackRock trimmed GE Aerospace (-3.35%,$26.91B), JPMorgan Chase (-1.39%,$67.30B), and Bank of America (-2.89%,$28.84B), while adding+3.27%in Visa ($51.09B).
5. Limitations, the 45-Day Lag, and Three Verification Rules
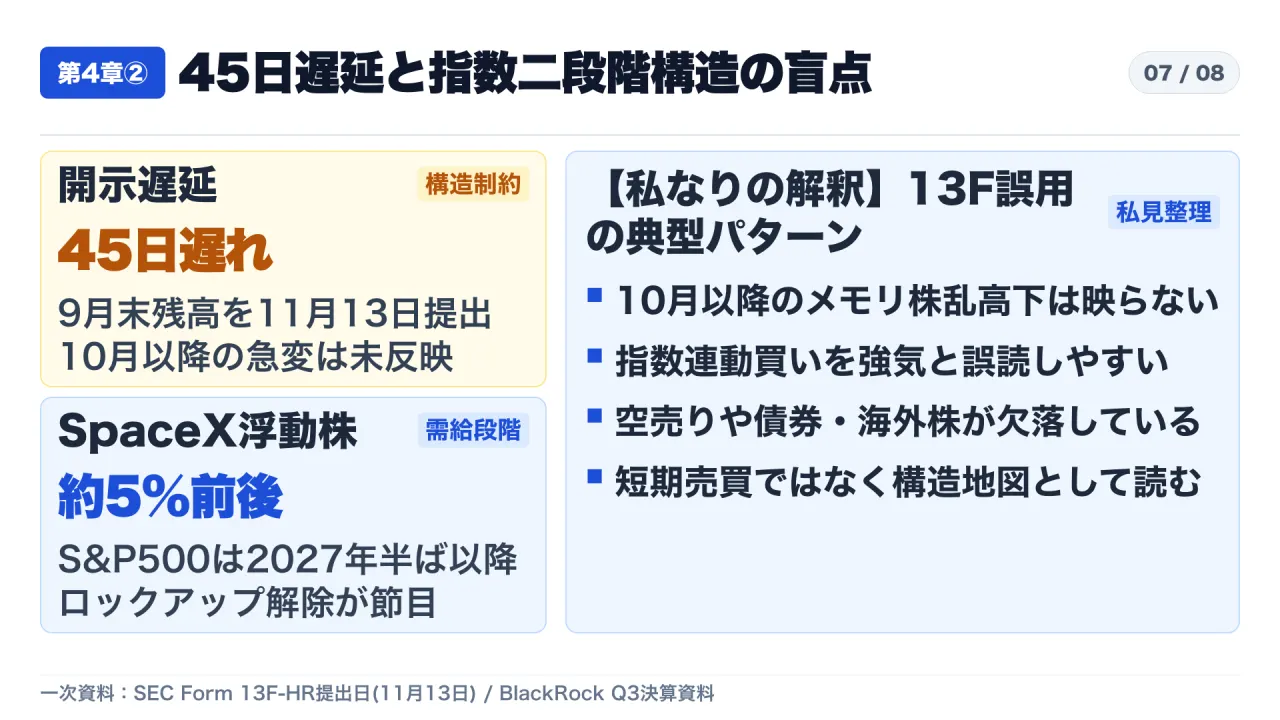
Two structural constraints govern how any researcher, corporate planner, or Japan-based market observer should interpret Form 13F data. First, the September 30 snapshot was filed on November 13—a roughly 45-day reporting lag during which post-quarter market shifts are invisible, akin to planning today’s outfit using travel photos taken six weeks ago. Second, for newly listed companies with low initial free float (around 5% for SpaceX) that enter select indices early before lockup expirations or broader benchmark inclusion, mechanical two-stage index demand can look like active institutional conviction unless cross-checked against float and index schedules.
Before citing any 13F screener alert in research memos or strategy briefings, apply three checks:
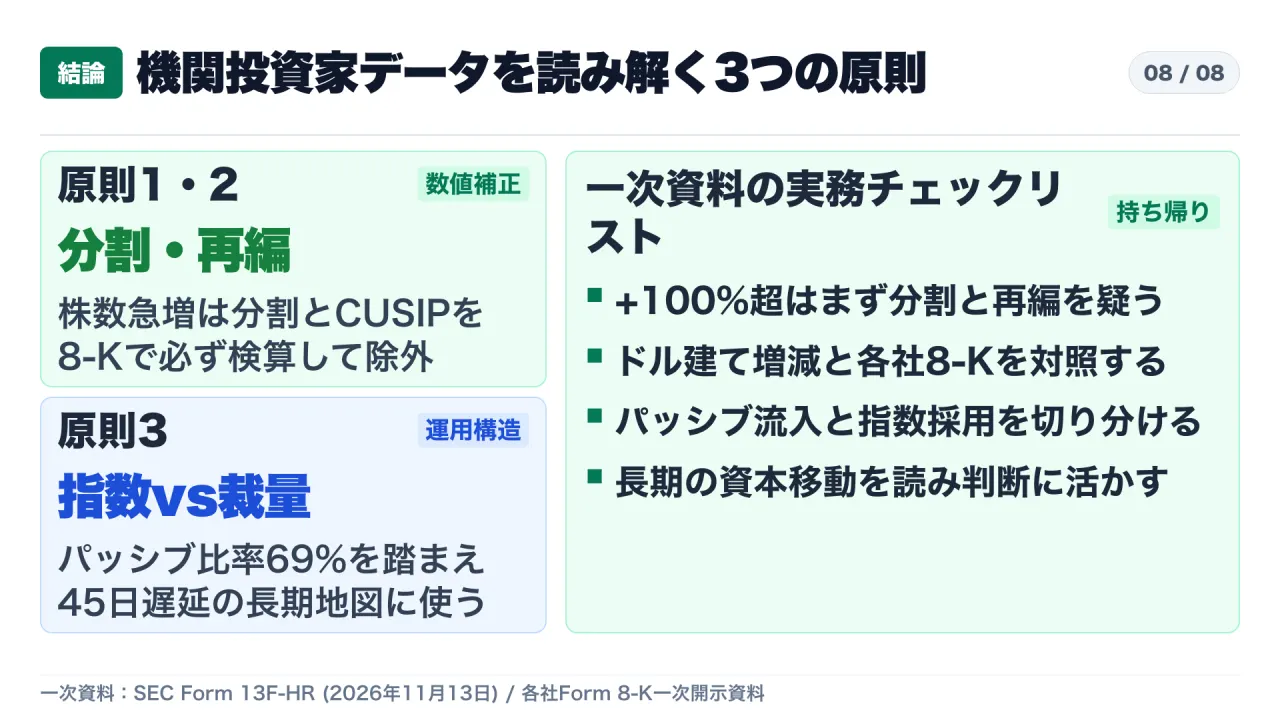
- Audit Form 8-K Splits and CUSIP Changes First: Any
>100%share jump or multi-billion-dollar “new position” must be reconciled against issuer Form 8-K filings and issuer-name matching across Q2/Q3 XML rows. - Pair Share-Change Rates With Dollar Value and Earnings: Separating valuation gains (
NVDA,MU) from net share additions (SNDK,INTC,BE) reveals whether capital is rotating from GPUs toward memory, equipment, power generation, and orbital compute. - Treat 13F as a Long-Term Structural Map, Not a Short-Term Signal: Given the
69%passive AUM mix,45-daylag, and exclusion of shorts, bonds, and non-U.S. equities, 13F data maps institutional weighting shifts rather than real-time trading direction.
Primary Sources
- BlackRock, Inc. Form 13F-HR Cover Page (Q3 2026, filed November 13, 2026)
- BlackRock, Inc. Q3 2026 Form 13F-HR InfoTable XML (50,911 entries)
- BlackRock, Inc. Q2 2026 Form 13F-HR InfoTable XML (49,968 entries)
- BlackRock, Inc. Q3 2026 Earnings Release Form 8-K Ex-99.1 (October 14, 2026)
- CrowdStrike Holdings, Inc. Form 8-K Ex-99.1 (June 3, 2026, 4-for-1 split)
- Amphenol Corporation Dividend & Stock Split History and Amphenol Form 8-K (August 6, 2026, 2-for-1 split)
- ONEOK, Inc. Form 8-K (August 31, 2026, Falcon TopCo reorganization)
- Space Exploration Technologies Corp. Q3 2026 Form 8-K Ex-99.1 (October 20, 2026)