Why a $1.6 Trillion AI CapEx Cut Is Repricing Memory and Credit Instead of Ending the Buildout
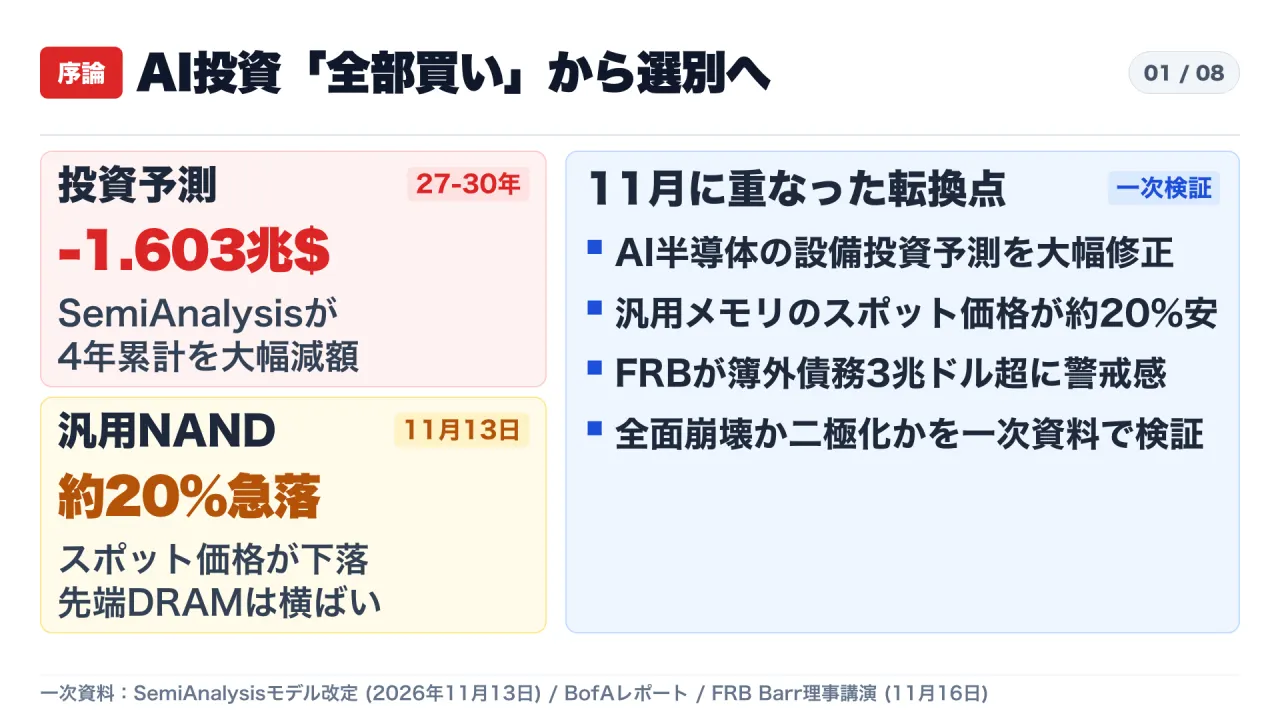
SemiAnalysis cut $1.603 trillion from 2027–2030 AI accelerator spending while generic NAND spot prices fell 20%, SK hynix hit 80% operating margins, and the Fed flagged $3 trillion in off-balance-sheet AI debt.
Japanese Edition: Read the original Japanese article on Substack
Video Episode (Japanese Audio): Watch on YouTube
In November 2026, the narrative around artificial intelligence infrastructure and semiconductor memory shifted decisively from indiscriminate expansion to rigorous selectivity centered on unit economics, power availability, and credit backing. Within the span of a single week, semiconductor research firm SemiAnalysis cut its cumulative 2027–2030 global AI accelerator spending forecast by $1.603 trillion, Bank of America reported a roughly 20% plunge in generic NAND flash spot prices, and Federal Reserve Governor Michael S. Barr warned that major AI firms are on track to surpass $800 billion in on-balance-sheet debt alongside more than $3 trillion in potential off-balance-sheet obligations.
At first glance, those headlines look like the opening act of a broad AI investment collapse. Yet when primary disclosures from memory makers, cloud compute buyers, and institutional analysts are placed side by side, a very different mechanism emerges. Rather than an across-the-board contraction, the market is undergoing an asymmetric repricing and bifurcation: commodity components exposed to legacy manufacturing capacity and speculative buyers are losing pricing power, while advanced high-bandwidth memory (HBM), custom silicon backed by hyperscaler balance sheets, and contracted power capacity remain severely constrained.
This article reconciles the November 2026 forecast revisions, spot memory pricing data, corporate earnings releases, SEC S-1/A filings, and central bank financial stability remarks to separate structural repricing from cyclical noise.
1. The Big Picture: Asymmetric Repricing Rather Than Total Collapse
When SemiAnalysis published its revised AI accelerator model on November 13, 2026, the headline reduction of $1.603 trillion over four years immediately triggered volatility across semiconductor equities. However, examining the year-by-year trajectory reveals that growth in absolute dollar terms has not vanished. Even under the lowered baseline, global AI accelerator spending is still projected to expand from $392 billion in 2026 to $923 billion in 2030—a 2.35-fold increase over four years.
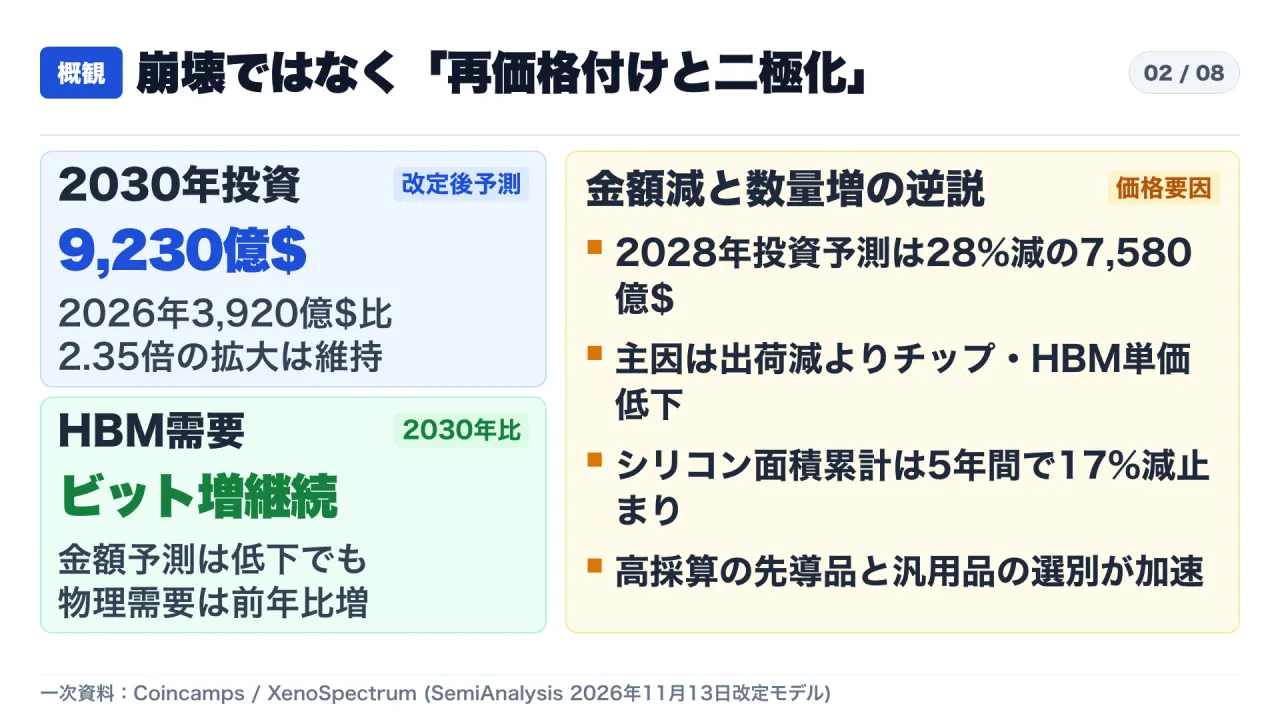
| Metric | Prior Forecast | Revised Forecast | Structural Implication |
|---|---|---|---|
| 2026 AI Accelerator Spending | — | $392 billion | Unchanged baseline |
| 2027 AI Accelerator Spending | $770 billion | $627 billion | -$143 billion (-18.6%) |
| 2028 AI Accelerator Spending | $1,054 billion | $758 billion | -$296 billion (-28%) |
| 2029 AI Accelerator Spending | $1,352 billion | $796 billion | -$556 billion |
| 2030 AI Accelerator Spending | $1,531 billion | $923 billion | -$608 billion (~40% cut, still 2.35x vs. 2026) |
| 2026–2030 Cumulative Silicon Area | — | — | -17% total (Nvidia accounts for 66% of the reduction) |
| HBM Bit Demand Outlook | — | — | -30% in 2028, -12% in 2030 (year-over-year growth continues) |
The divergence between dollar spending cuts and physical volume estimates is the most telling detail in the dataset. While 2030 dollar spending was trimmed by roughly 40%, cumulative silicon die area across 2026–2030 fell by only 17%, and HBM bit demand for 2030 was adjusted downward by just 12% while continuing to grow year over year. Think of the distinction like an urban luxury apartment boom: the number of buildings breaking ground continues to rise, but common drywall and interior fixtures supplied by dozens of undifferentiated contractors suffer rapid price erosion, while custom acoustic insulation and high-capacity electrical substations remain booked out years in advance.
In other words, the primary driver of the $1.603 trillion revenue adjustment is lower projected average selling prices (ASPs) for GPUs and HBM modules rather than a disappearance of underlying compute demand. Earlier consensus models assumed suppliers could sustain peak scarcity pricing indefinitely. As hyperscalers diversify silicon sourcing and push back on unit economics, those scarcity premiums are being repriced downward.
2. Three Drivers Behind the $1.6 Trillion Cut and Divergent Vendor Impact
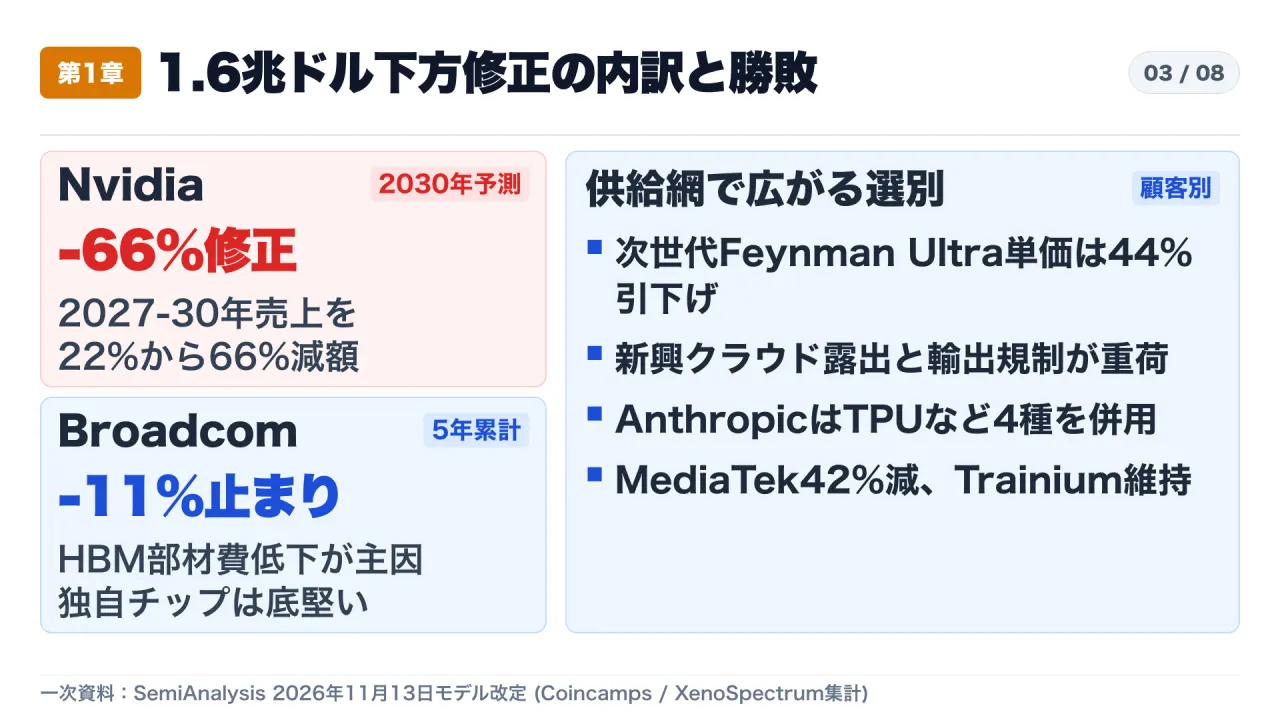
In its November 13, 2026 model update, SemiAnalysis attributed the spending revision to three structural bottlenecks that converged during the second half of 2026:
- Decelerating Net New ARR at Frontier AI Labs: In the third quarter of 2026, the pace of net new annual recurring revenue (ARR) additions at leading AI model developers slowed relative to prior exponential curves. As a result, SemiAnalysis calibrated future capacity additions toward levels that end-user software revenues can plausibly sustain.
- Tighter Capital Market Discipline for Unbacked Data Centers: Equity and debt investors grew noticeably more reluctant to finance speculative data center builds lacking binding take-or-pay commitments from creditworthy hyperscale cloud providers.
- Post-Midterm Regulatory and Power Delays: Following the November 2026 U.S. midterm elections, permitting and grid-interconnection friction delayed approximately 5.8 gigawatts (GW) of U.S. data center capacity previously scheduled to come online between late 2027 and the first half of 2028.
Crucially, this slowdown does not hit chip designers equally. On a shipment-basis compute revenue view, Nvidia absorbed the sharpest downward revisions—22% in 2027, 39% in 2028, 56% in 2029, and 66% in 2030—accounting for 66% of the entire five-year silicon area reduction. SemiAnalysis also slashed its projected ASP for Nvidia’s next-generation Feynman Ultra platform by 44%, from roughly $175,000 to about $98,000, citing customer concentration in financially leveraged neocloud operators and heightened exposure to export-control legislation.
By contrast, custom silicon partner Broadcom saw its five-year cumulative ASIC revenue forecast reduced by just 11%, and most of that adjustment reflected lower pass-through HBM component costs rather than lost unit shipments. Similarly, shipment projections for Amazon’s in-house Trainium chips in 2027–2028 were left intact. Elsewhere in the custom and merchant accelerator ecosystem, buyers are visibly hedging: Anthropic now splits workloads across four distinct chip architectures—Google TPUs, Amazon Trainium, AMD GPUs, and Nvidia GPUs. Vendors with weaker financial backing or narrower customer ecosystems fared poorly in the revision, with MediaTek’s Triggerfish project cut by 42% and AMD’s 2028–2030 spending outlook reduced by 29% to 35%.
3. Memory Market Bifurcation: Commodity NAND Drops 20% While HBM Locks In Multi-Year Contracts
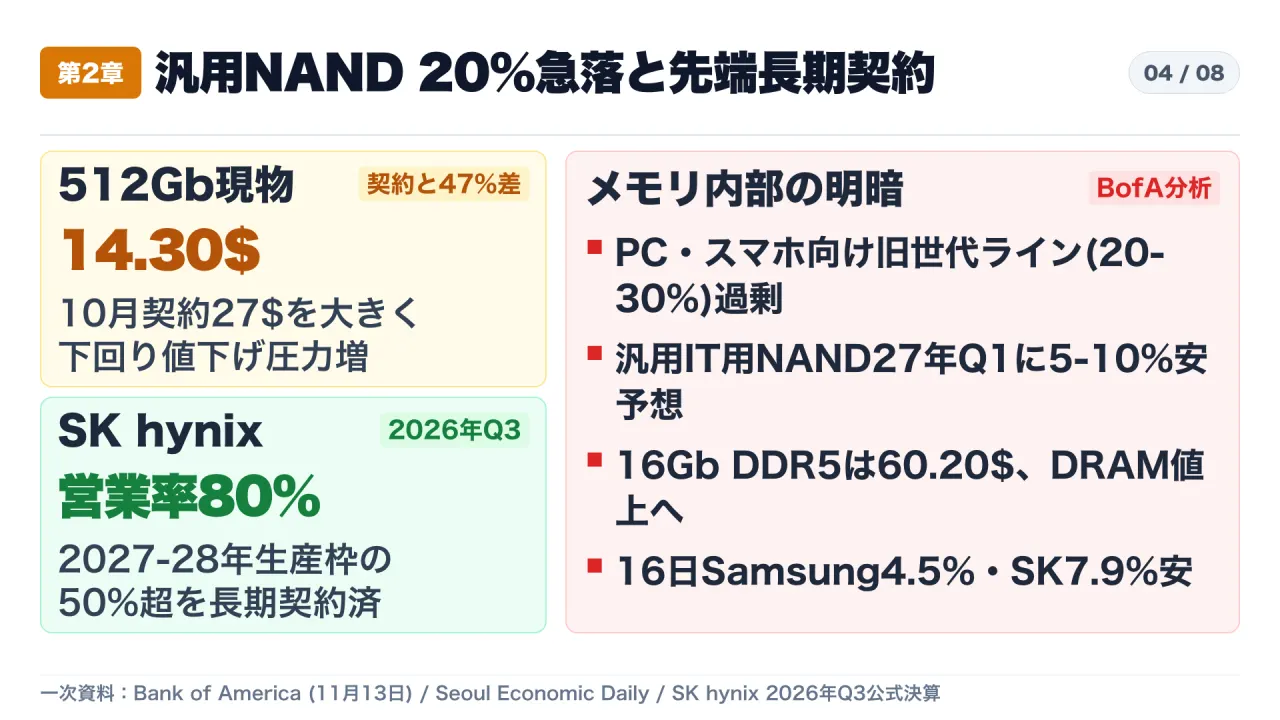
The same sorting mechanism is playing out even more starkly inside the memory semiconductor sector. On November 13, 2026, Bank of America released spot-market tracking showing that generic NAND flash prices fell roughly 20% from mid-October to late October 2026. Yet on October 28, 2026, SK hynix reported historic profitability driven by AI-grade memory locked under multi-year agreements. Placing these two datasets side by side exposes why treating “memory” as a single cyclical trade leads to analytical errors.
| Segment / Indicator | Latest Level | Price / Margin Trajectory | Underlying Supply-Demand Driver |
|---|---|---|---|
| 512Gb NAND Wafer Spot | $14.30 | -12% WoW / -32% QoQ (-47% vs. ~$27 Oct. contract) | 20%–30% of global legacy lines locked into generic IT NAND; 6-way rivalry |
| 1Tb NAND Spot | $24.90 | -4% WoW / -19% QoQ (+194% YoY) | Weak PC and smartphone component orders hitting spot clearance |
| 16Gb DDR5 Spot | $60.20 | Flat WoW (+150% YoY) | DRAM contracts still projected +8% in Q4 2026 and +5% in Q1 2027 |
| SK hynix Q3 2026 Results | 104.6155 trillion KRW revenue | 83.3338 trillion KRW operating profit (80% margin) | Over 50% of 2027–2028 capacity under long-term agreements with 14 customers |
Why did 512Gb NAND spot prices collapse to $14.30—nearly half of the ~$27 October contract benchmark—while DDR5 held firm at $60.20 and SK hynix posted an 80% operating margin? The answer lies in manufacturing line rigidity. Roughly 20% to 30% of global NAND wafer capacity sits on older-generation process nodes that cannot be converted to manufacture enterprise solid-state drives (eSSD) for AI servers or advanced HBM stacks. As PC and smartphone OEMs slowed orders, six competing suppliers—including Chinese memory manufacturers—fought for volume on those legacy nodes. Bank of America consequently lowered its Q1 2027 IT NAND contract forecast to a 5%–10% sequential decline.
On November 16, 2026, Asian semiconductor stocks sold off across the board on those NAND headlines: Samsung Electronics dropped 4.47%, SK hynix fell 7.89%, and Kioxia declined 7.69%. Yet SK hynix’s third-quarter disclosure shows it has already crossed 100 trillion KRW in quarterly revenue and secured long-term agreements (LTAs) covering more than 50% of its 2027–2028 production capacity across 14 major customers, with management projecting tight advanced supply through 2030. Equating legacy PC NAND spot weakness with advanced HBM profitability conflates two physically separate supply chains.
4. Federal Reserve Warning: $800B+ Balance Sheet Debt, $3T+ Off-Balance-Sheet Risk, and Circular Financing
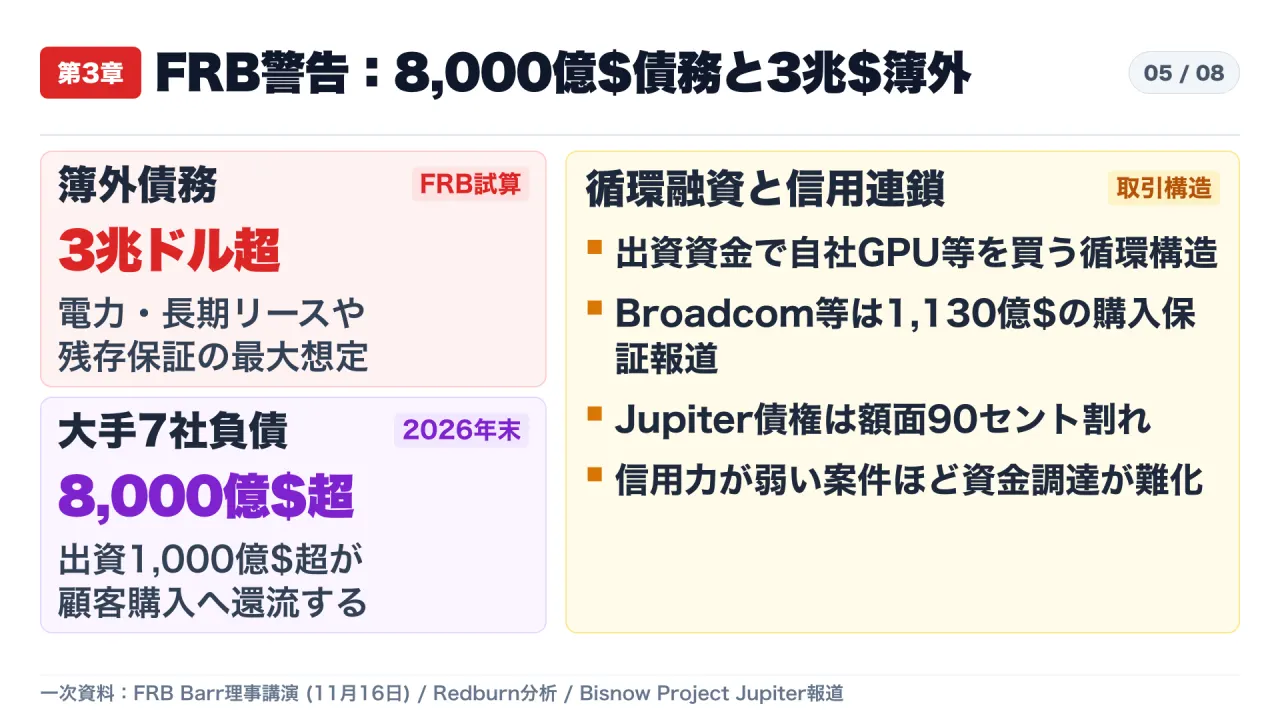
While semiconductor pricing explains part of the market’s nervousness, credit structure explains why equity and bond investors reacted so sharply to infrastructure headlines in November 2026. In a speech titled “Financial Stability and AI” delivered on November 16, 2026, Federal Reserve Governor Michael S. Barr outlined three financial amplification channels flagged in the Fed’s Financial Stability Report:
- Rapidly Expanding On-Balance-Sheet Debt: Seven major AI-linked corporations are projected to exceed $800 billion in on-balance-sheet debt by the end of 2026, marking a rapid transition from cash-funded capex to leveraged infrastructure expansion.
- More Than $3 Trillion in Off-Balance-Sheet Obligations: Governor Barr noted that power-purchase agreements, long-term data center and compute lease commitments, and residual value guarantees (RVGs) carry potential maximum nominal exposure exceeding $3 trillion.
- Circular Financing Loops Over $100 Billion: Hyperscalers and leading GPU vendors have invested more than $100 billion into frontier AI labs and neocloud operators, which in turn use that capital to purchase or lease chips and compute from their own investors.
Concrete company-level cases illustrate how these mechanisms transmit risk. On November 13, 2026, Redburn downgraded Broadcom to Neutral and cut its price target by 33%, from $595 to $398. Redburn highlighted that Broadcom’s fiscal 2028 AI revenue forecast of $230 billion relies heavily on up to 15 GW of deployment tied to Anthropic and OpenAI, accompanied by reported customer purchase backstops totaling $113 billion (up to $63 billion for Anthropic and $50 billion for OpenAI) and roughly $43 billion in disclosed AI rack residual value guarantee exposure.
At the project-finance level, Bisnow reported on the 2.4 GW “Project Jupiter” data center campus in New Mexico, backed by $3 billion in equity from Blue Owl and $18 billion in bank debt. Following a one-year delay in power and permitting approvals, Oracle notified partners that it would defer full lease payments, prompting portions of the syndicated project debt to trade below 90 cents on the dollar in secondary markets. When power schedules slip, non-cancelable obligations and credit spreads collide.
5. The 2028 Earnings Cliff, 5.8 GW Power Delays, and Three Misreading Traps
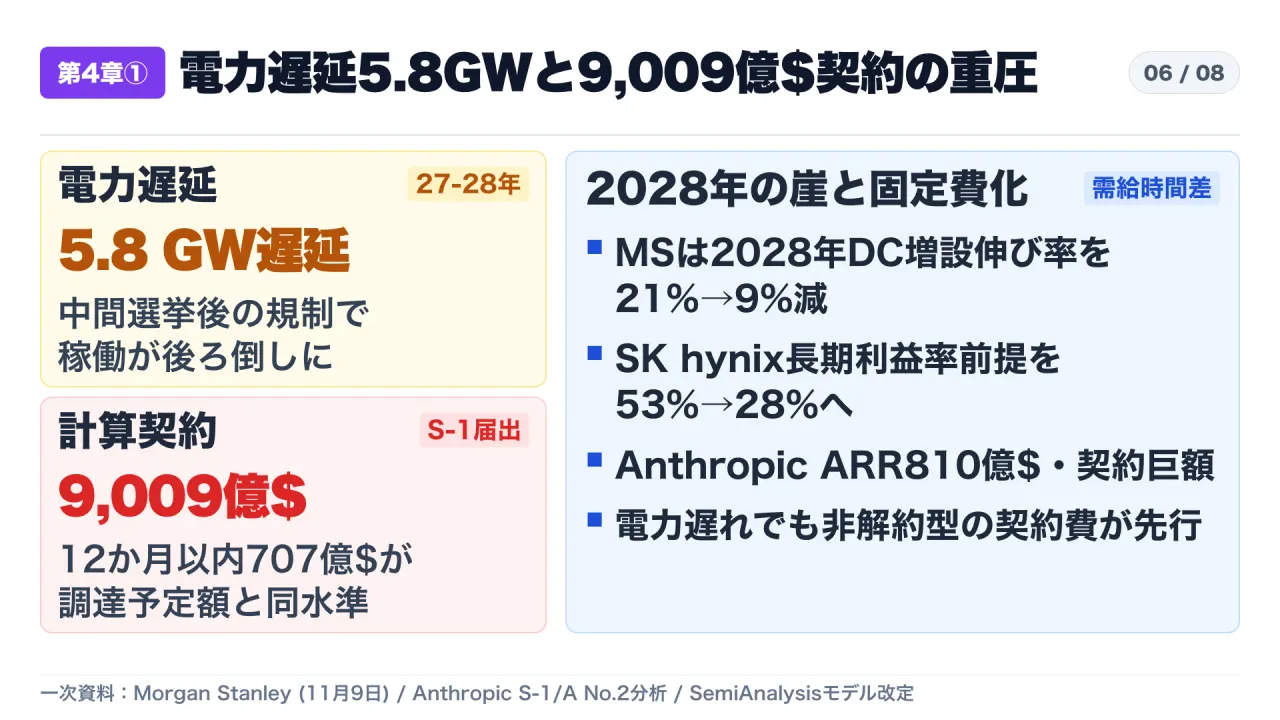
Physical power bottlenecks are now pulling 2028 capacity timelines into 2029. In a November 9, 2026 note, Morgan Stanley lowered its 2028 global data center capacity growth forecast from 21% to 9% after tracking roughly 5 GW of projects pushed out by a year. Although Morgan Stanley raised its near-term 2027 operating profit estimate for SK hynix, it slashed SK hynix’s target price by 38% (from 2.6 million KRW to 1.6 million KRW) and cut its 2029–2035 average operating margin assumption from 53% to 28%—warning of a potential “2028 earnings cliff” as delayed power meets rising supply.
On the demand side, Anthropic’s Form S-1/A No. 2 filing dated November 10, 2026 revealed $900.9 billion in total non-cancelable compute commitments, including $451.6 billion due through the end of 2030 and $70.7 billion due within the next 12 months. Even with Q3 revenue of $17 billion and an annualized run rate near $81 billion, that 12-month $70.7 billion obligation approaches the roughly $90 billion combined proceeds expected from its IPO and private placements. Fixed compute bills keep ticking even when physical power connections slip.
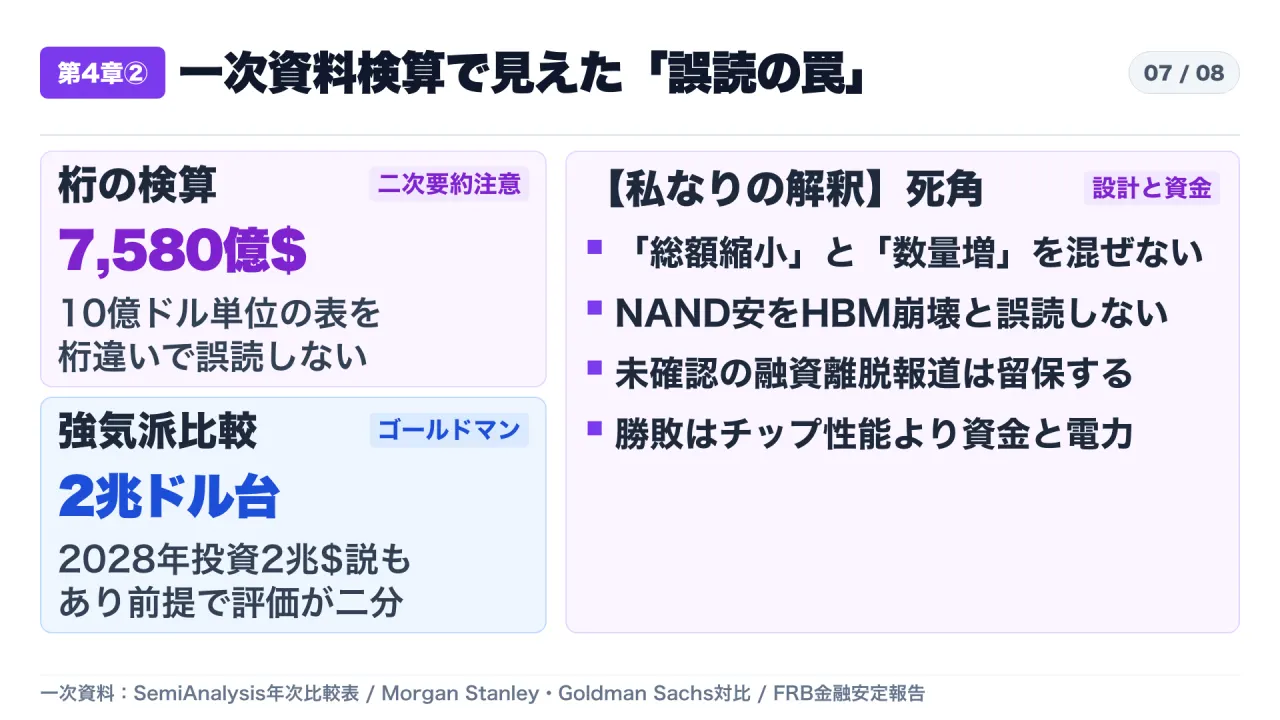
Reviewing the underlying tables also exposes three recurring analytical traps that distort commentary:
- Unit-Scale Misreading in Annual Tables: SemiAnalysis annual capex tables are denominated in billions of dollars. Reading “758” for 2028 as $75.8 billion instead of $758 billion—or “923” for 2030 as $92.3 billion instead of $923 billion—creates an order-of-magnitude error.
- Divergent Macro Baselines Among Tier-1 Banks: On the very same day as the cautious revisions, Goldman Sachs maintained projections of roughly $1.3 trillion in 2027 and $2 trillion in 2028 AI infrastructure spending and argued that Korean memory equities were undervalued. Analysts are split on whether 2028 is a structural cliff or a temporary power-grid digestion pause.
- Separating Confirmed Disclosures From Unverified Rumors: Unconfirmed market chatter regarding individual banks exiting syndications should be kept strictly separate from verified primary disclosures such as the Fed’s $800 billion / $3 trillion figures, SEC S-1/A filings, and audited quarterly earnings.
6. Three Boundary Indicators to Monitor Next
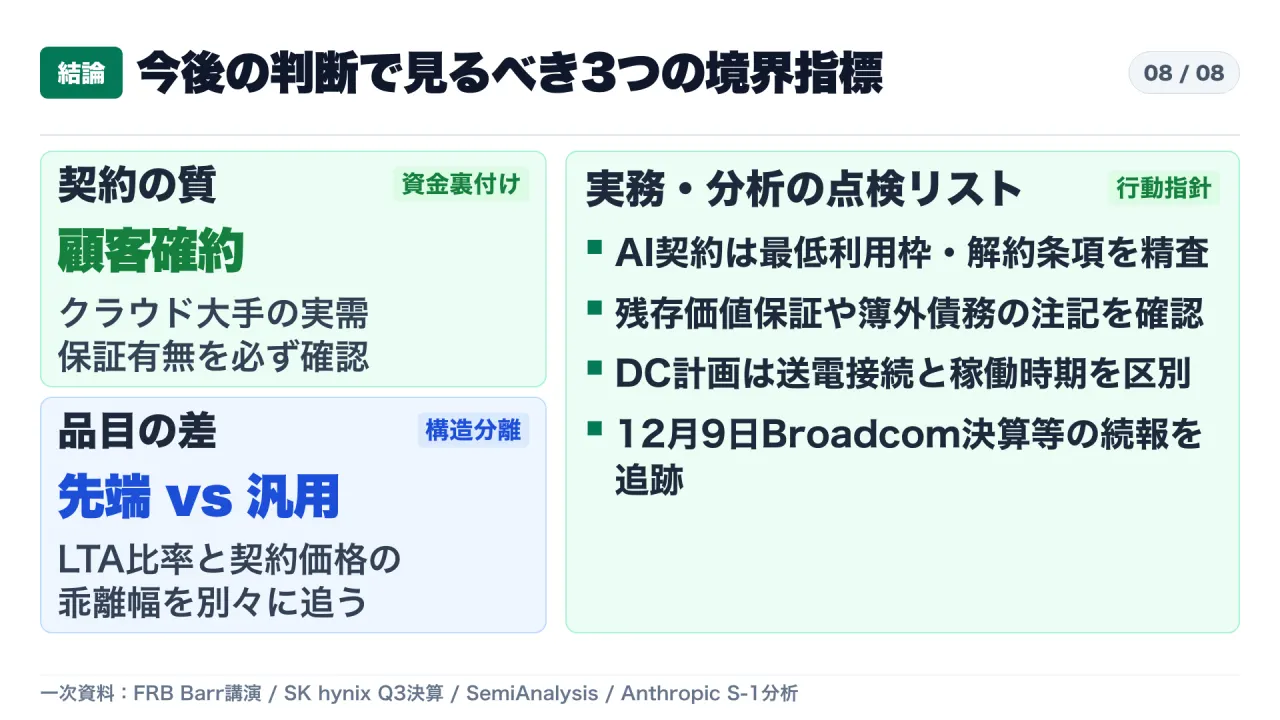
Without offering investment advice or price targets, technology buyers, infrastructure planners, and industry analysts can track three concrete boundary indicators to distinguish durable buildouts from fragile commitments:
- Counterparty Credit Quality vs. Off-Balance-Sheet Guarantees: Verify whether a data center or compute project is backed by direct, unconditional demand from a cash-generative hyperscaler, or whether it depends on vendor residual value guarantees, purchase backstops, and circular equity loops.
- LTA Coverage vs. Commodity Spot Exposure: Separate memory and component exposure into legacy commodity lines (such as generic IT NAND, where six-way competition drives spot volatility) versus capacity-constrained advanced nodes (such as HBM and server DDR5 with >50% LTA coverage).
- Contracted Minimum Spend vs. Grid Energization Timelines: In enterprise AI procurement and cloud commitments, audit non-cancelable minimum usage clauses against actual software monetization ramps and verified utility interconnection dates. As an immediate milestone, Broadcom’s Q4 earnings report scheduled for December 9, 2026 will provide fresh disclosure on how vendor financing and residual value guarantees are evolving.
Primary Sources and References
- S1: Federal Reserve Board — Governor Michael S. Barr “Financial Stability and AI” (November 16, 2026)
- S2: Coincamps — SemiAnalysis Cuts 2028 AI Accelerator Spending Forecast and Nvidia Outlook (November 13, 2026 model revision)
- S3: XenoSpectrum — SemiAnalysis AI Accelerator Spending Forecast Annual Comparison (November 17, 2026)
- S4: VLSI.kr — NAND Spot Drops 20%, DDR5 Holds USD 60: Memory Divergence (Bank of America November 13, 2026 report)
- S5: Seoul Economic Daily — NAND Spot Prices Slide 20% as Memory Rally Shows Cracks (November 16, 2026)
- S6: SK hynix Newsroom — SK hynix Announces 3Q26 Financial Results (October 28, 2026)
- S7: VLSI.kr — Morgan Stanley Cuts SK hynix Target by 38%: The Debate Is the 2028 Earnings Cliff
- S8: VLSI.kr — Broadcom Target Cut to $398 From $595 — Redburn Asks Who Pays for the AI Buildout
- S9: VLSI.kr — Anthropic’s Filing in 5 Facts: $900.9 Billion of Compute Commitments and a Four-Chip Pool
- S10: Bisnow — Oracle Delays Raise Concerns On Debt-Heavy AI Data Center Deals (Project Jupiter)