Multi-Agent Breakdown: 96.98% Partial Score Drops to 17.65% Resolution and 4.4x Cost
Why a November 2026 benchmark of 145 long-horizon tasks shows top multi-agent systems failing end-to-end delivery, reversing unit economics, and degrading lightweight workers when strong models plan poorly.
Japanese Edition: Read the original Japanese article on Substack
Video Episode (Japanese Audio): Watch on YouTube
Enterprise engineering teams and automation architects increasingly assume that splitting complex work across multiple AI agents—having a high-capability planner delegate subtasks to parallel workers—naturally improves both delivery quality and cost efficiency. However, primary data from the preprint paper WorkflowArena: Benchmarking Executable Workflow Orchestration in LLM-Based Multi-Agent Systems, published on November 9, 2026 by researchers from Einsia.AI, Tsinghua University, and Navers Lab (arXiv abstract / arXiv HTML full text), reveals severe structural limits in autonomous multi-agent delegation.
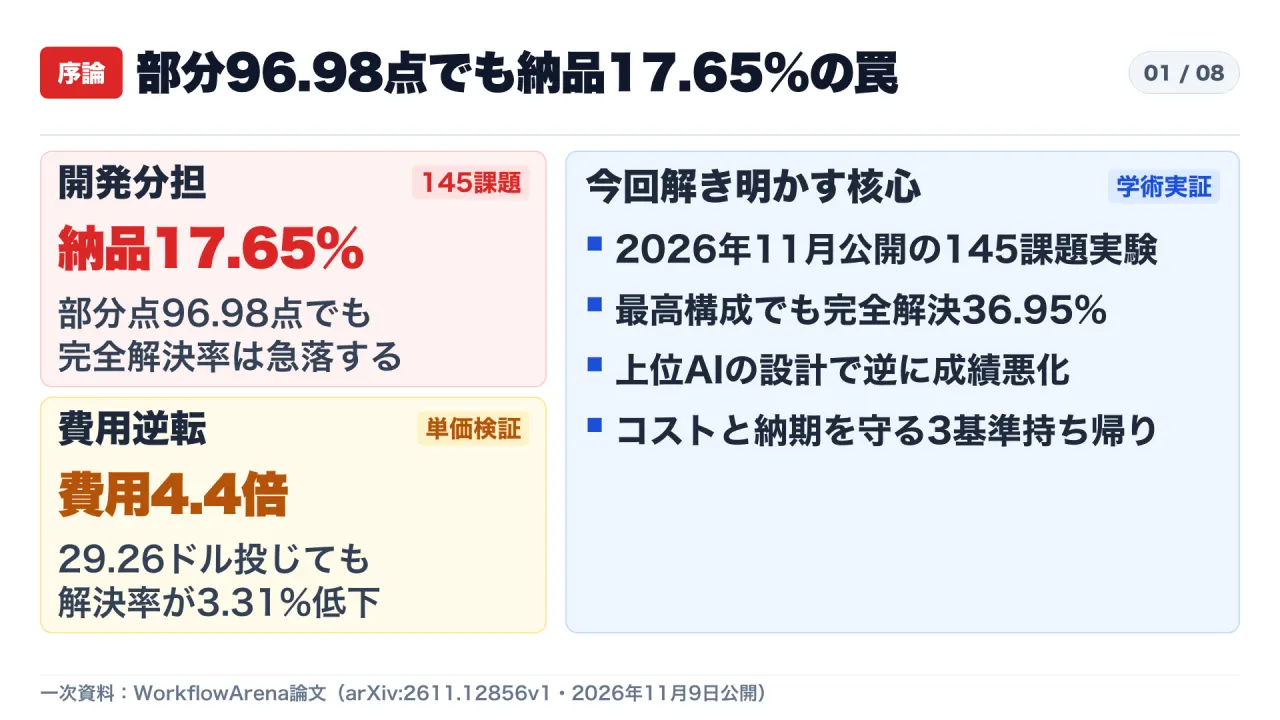
Across 145 tasks spanning eight domains with a strict 14,400-second (four-hour) wall-clock budget, even the highest-scoring configuration achieved a full end-to-end Resolved Rate of only 36.95%. Even more strikingly, in software engineering (SWE), a high-effort configuration achieved a 96.98 continuous partial score while delivering an end-to-end Resolved Rate of just 17.65%. In legal workflows (LAW), the 25-configuration average continuous score reached 70.7 points, yet the average Resolved Rate collapsed to 2.9%.
Meanwhile, unit-cost verification exposes a stark economic inversion: a frequent-delegation configuration costing $29.26 per task—4.4 times the $6.66 per task cost of a batch-parallel frontier configuration—delivered a 3.31 percentage point lower Resolved Rate (30.80% versus 34.11%). Worse still, workflow transfer experiments across 32 hard tasks demonstrated that handing a static workflow plan designed by a strong standalone model to lightweight execution models degraded worker performance by an average of 2.53 points compared to letting those workers plan dynamically on their own.
This analysis walks through the 25-configuration benchmark results, API unit-cost calculations, delegation log telemetry, workflow transfer experiments, and explicit unconfirmed boundaries to outline three operational guardrails every engineering and governance team should adopt before scaling multi-agent automation.
1. Benchmark Design: Measuring Orchestration Under Real Constraints
Traditional multi-agent benchmarks either lock agents into developer-hardcoded orchestration pipelines or grade only the final scalar answer of short-horizon tasks. WorkflowArena takes a fundamentally different approach by measuring whether a foundation model acting as an autonomous orchestrator can decide how many worker agents to spawn, how to pass context, and how to integrate partial outputs inside a live execution environment.
| Dimension | Primary Specification (arXiv:2611.12856v1, November 9, 2026) |
|---|---|
| Authors & Institutions | Zheng Jiang and 12 co-authors across Navers Lab, Einsia.AI, and Tsinghua University |
| Task Coverage | 8 domains, 17 task types, 145 tasks total (SWE 17, OPS 18, SCI 16, MATH 24, FIN 16, LAW 22, CDN 14, 3D 18) |
| Wall-Clock & Worker Limits | Shared 14,400-second (4-hour) budget per task; up to 16 parallel worker agents per workflow invocation |
| Verification Mechanism | Automated deterministic program verifiers for 6 domains (SWE, OPS, SCI, MATH, FIN, LAW); independent model rubric grading for 2 domains (CDN, 3D) |
| Dual Evaluation Metrics | Binary Resolved Rate (1 only when every requirement passes) and 0–100 Continuous Score (partial progress) |
Two mechanics in WorkflowArena explain why strong component outputs still fail end-to-end delivery. First, every minute the orchestrator spends designing workflows, writing instructions, and coordinating handoffs consumes the exact same four-hour wall-clock budget allocated to execution. Second, grading is enforced by a Hidden Verifier completely invisible to the agents during runtime. If any dependency across integrated modules, schemas, or legal clauses breaks—even by a single unaligned interface—the binary Resolved Rate drops to zero regardless of how high the partial score looks.

Consider a practical operational analogy: five specialist chefs can each prepare an exceptional salad, soup, fish course, entree, and dessert. Yet if nobody coordinates serving temperatures, seasoning balance, or plate dimensions across the kitchen, the complete banquet fails inspection at the pass. In enterprise software and knowledge work, local excellence does not guarantee system-level acceptance.
2. Eight-Domain Results: The Chasm Between Partial Credit and Delivery
Across 25 configurations combining nine base models with five reasoning-effort levels (low, medium, high, xhigh, max), no single configuration dominated every domain. More importantly, Appendix F of the paper quantifies the average gap between Continuous Score and Resolved Rate across all 25 configurations, revealing an extraordinary divergence across real-world enterprise domains.
| Domain (Code & Count) | Avg. Gap: Continuous vs. Resolved (25 Configs) | Key Empirical Observations (Table 1, Table 10, Appendix F) |
|---|---|---|
| Formal Mathematics (MATH, 24) | 11.23 pts | Peak Resolved Rate 95.83%. Type checking and formal axioms align tightly with partial scores |
| Content Design (CDN, 14) | 32.71 pts | Requires rubric score >= 75 or >= 90 plus mandatory critical-item pass |
| Scientific Research (SCI, 16) | 34.73 pts | Top batch-parallel configuration (max) reached 56.25% Resolved Rate (94.71 continuous) |
| Enterprise Operations (OPS, 18) | 38.33 pts | Requires >= 90% goal accuracy, >= 90% procedure accuracy, and zero constraint violations |
| 3D Production (3D, 18) | 47.25 pts | Continuous score peaked at 71.82 while peak Resolved Rate stopped at 27.78% |
| Finance & Accounting (FIN, 16) | 61.18 pts | Peak Resolved Rate 18.75%. Multi-entity and multi-currency consolidation checks caused frequent failures |
| Software Engineering (SWE, 17) | 66.16 pts | Top high config scored 96.98 continuous yet 17.65% resolved; 9 of 10 rival configs scored 0.00% |
| Legal Practice (LAW, 22) | 67.76 pts | 25-config average 70.7 continuous vs. 2.9% resolved (best single config only 9.09%) |
The software engineering and legal results should serve as an immediate warning for organizations deploying multi-agent pipelines in production. In SWE, the top batch-parallel system at high reasoning effort achieved a near-perfect 96.98 continuous score, yet failed full regression verification on more than four out of five tasks (17.65% resolved; even at max effort, it reached only 29.41%). Meanwhile, across two frequent-delegation model families spanning ten configurations, nine out of ten configurations posted 0.00% full resolution in software engineering despite earning continuous scores between 71.19 and 78.43 points (only a single low configuration resolved 5.88%).
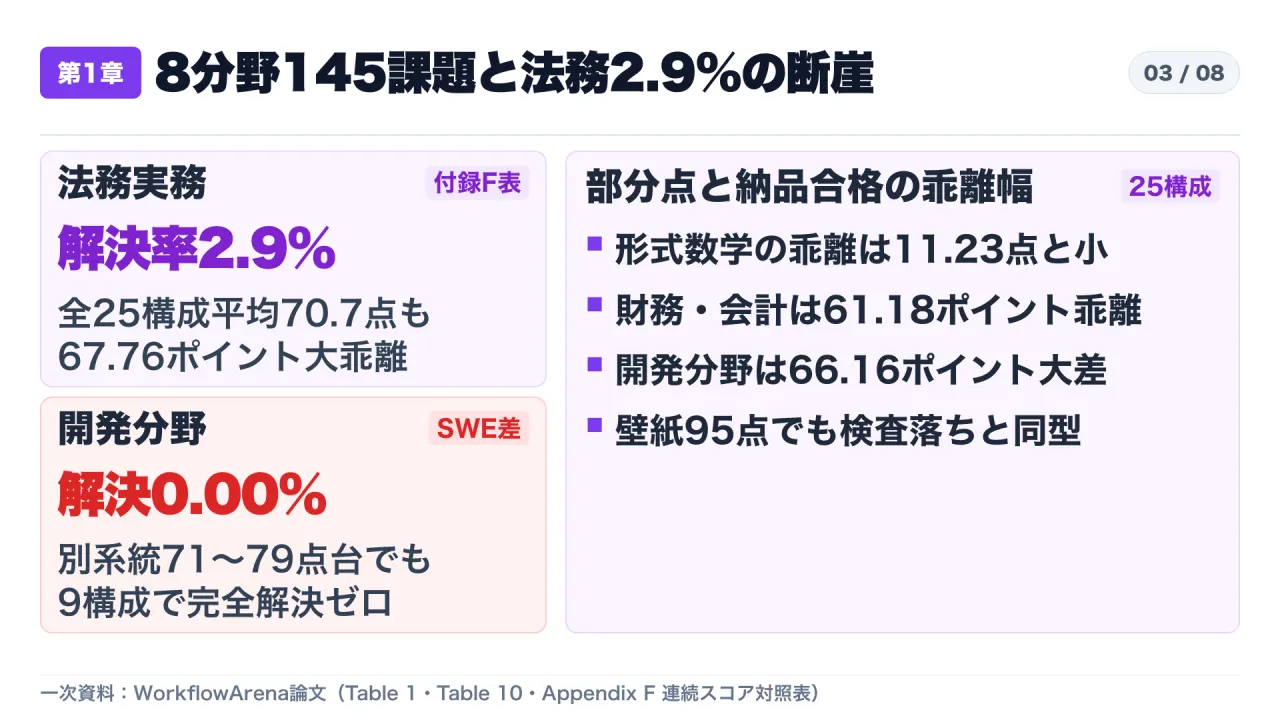
In residential construction, this is equivalent to scoring 95 out of 100 on wallpaper, flooring, and lighting individually, only to fail final building inspection because electrical outlets sit behind built-in cabinetry. Human reviewers inspecting individual agent outputs often see fluent, intelligent work and overestimate readiness—only to discover during end-to-end integration that the assembled deliverable cannot ship.
3. Cost-Performance Inversion: Paying 4.4x More for Lower Resolution
Section 4.3 (Resource Consumption Analysis) and Appendix Table 8 (API Unit Pricing) allow a direct verification of compute economics per task. Across the evaluated models, uncached input token prices ranged from $0.10 to $10.00 per million tokens, while output token prices ranged from $0.50 to $50.00 per million tokens—a price spread exceeding 100-fold. When combined with repeated multi-agent delegation loops, this pricing spread produces sharp cost-performance inversions.
| Configuration Tier (Reasoning Effort) | Est. Cost per Task | Full Resolved Rate (145 Tasks) | Cost-Efficiency Comparison (Section 4.3) |
|---|---|---|---|
Batch-Parallel Frontier (high) |
$6.66 | 34.11% | Consumed avg. 7.36M tokens; sits on both the token-efficiency and cost-efficiency frontier |
Frequent-Delegation Tier (xhigh) |
$29.26 | 30.80% | 4.4x higher cost ($29.26 / $6.66 = 4.39x) with 3.31 percentage points lower resolution |
Frequent-Delegation Efficient (low) |
$3.61 | 27.59% | Roughly one-eighth the cost of the $29.26 tier while trailing by only 3.21 points |
Scaling reasoning effort within the same model family also yields sharply uneven marginal returns. For a mid-tier batch-parallel model, raising effort from high to max multiplied token consumption by 3.2x and lifted Resolved Rate by 7.95 percentage points (from 25.26% to 33.21%). Conversely, pushing an efficient frequent-delegation model from low to xhigh multiplied token usage by 1.9x yet improved Resolved Rate by only 1.91 percentage points (from 27.59% to 29.50%).
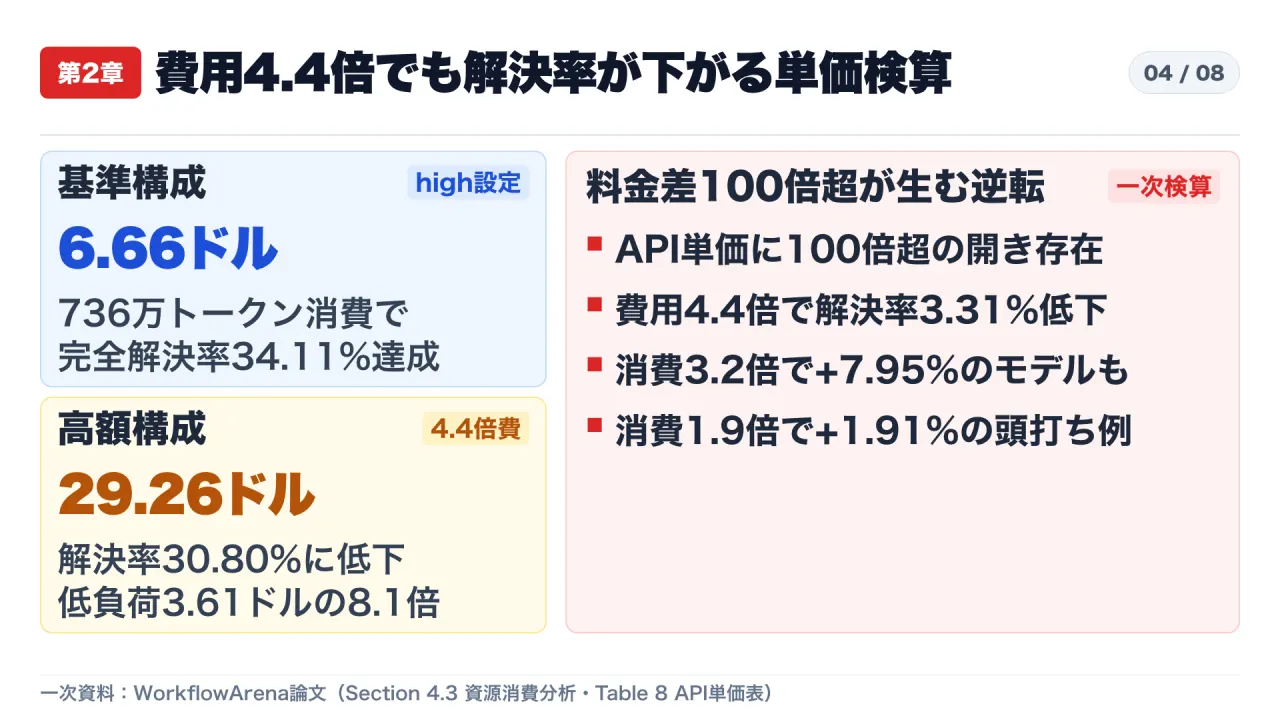
From an enterprise budgeting perspective, paying four times the hourly rate for an expensive specialist consultant who burns calendar time in fragmented check-ins—and ultimately ships fewer completed deliverables than a cohesive, lower-cost team—is an operational trap. Without measuring cost per fully verified deliverable, higher API bills can easily mask deteriorating business outcomes.
4. Delegation Habits and the Split Between Planning and Execution
Why do strong standalone capability and higher compute budgets fail to guarantee reliable orchestration? Sections 4.4 and 4.5 of the paper uncover two structural mechanisms: distinct delegation habits across model architectures, and a measurable separation between solving a task directly and designing a workflow for other agents to execute.
Contrasting Delegation Signatures at high Effort
- Batch-Parallel Orchestrators (Top 2 Models): Invoked workflows sparingly—averaging 0.86 and 0.76 calls per task—while dispatching large parallel batches averaging 5.55 and 6.14 workers per call. Single-invocation runs accounted for 70% and 68% of tasks with workflow calls, and large swarms of nine or more workers appeared in 24% and 30% of those tasks.
- Frequent-Delegation Orchestrators (Main 2 Models): Invoked workflows repeatedly—averaging 2.09 and 1.94 calls per task—with small batches averaging 1.72 and 1.69 workers per call. Roughly 99% of invoked workflows stayed at four workers or fewer, and single-call runs represented only 32%.
Cross-Model Workflow Transfer Experiment (Section 4.5 / Table 2)
To isolate planning capability from hands-on execution capability, the researchers selected 32 challenging tasks across all eight domains and prohibited two frontier max-effort planner models from editing files directly. Instead, those planners produced workflows for four lightweight execution models whose standalone Resolved Rates ranged from 6.08% to 16.48%.
| Lightweight Executor (Standalone Resolved) | Self Dynamic Control | Frequent-Delegation Static Plan | Frequent-Delegation Dynamic Plan | Batch-Parallel Static Plan | Batch-Parallel Dynamic Plan |
|---|---|---|---|---|---|
| Executor A (16.48%) | 35.75 | 29.69 (-6.06) | 33.80 (-1.95) | 45.04 (+9.29) | 46.61 (+10.86) |
| Executor B (13.32%) | 25.08 | 24.87 (-0.21) | 29.22 (+4.14) | 30.37 (+5.29) | 25.35 (+0.27) |
| Executor C (10.84%) | 20.39 | 22.07 (+1.68) | 24.25 (+3.86) | 28.04 (+7.65) | 27.46 (+7.07) |
| Executor D (6.08%) | 18.37 | 12.85 (-5.52) | 17.69 (-0.68) | 21.79 (+3.42) | 25.24 (+6.87) |
| 4-Executor Mean | 24.90 | 22.37 (-2.53) | 26.24 (+1.34) | 31.31 (+6.41) | 31.17 (+6.27) |
Two critical operational findings emerge from Table 2:
First, a strong solo problem-solver is not automatically a competent workflow architect. Although the frequent-delegation planner achieved a 27.34% standalone Resolved Rate, handing its Static workflow blueprints to the four lightweight executors lowered scores on three out of four executors—dragging the four-model mean down by 2.53 points (from 24.90 to 22.37, with Executor A dropping 6.06 points and Executor D dropping 5.52 points). By contrast, the batch-parallel frontier planner improved every single executor across both modes, raising average scores by +6.41 points (Static) and +6.27 points (Dynamic).
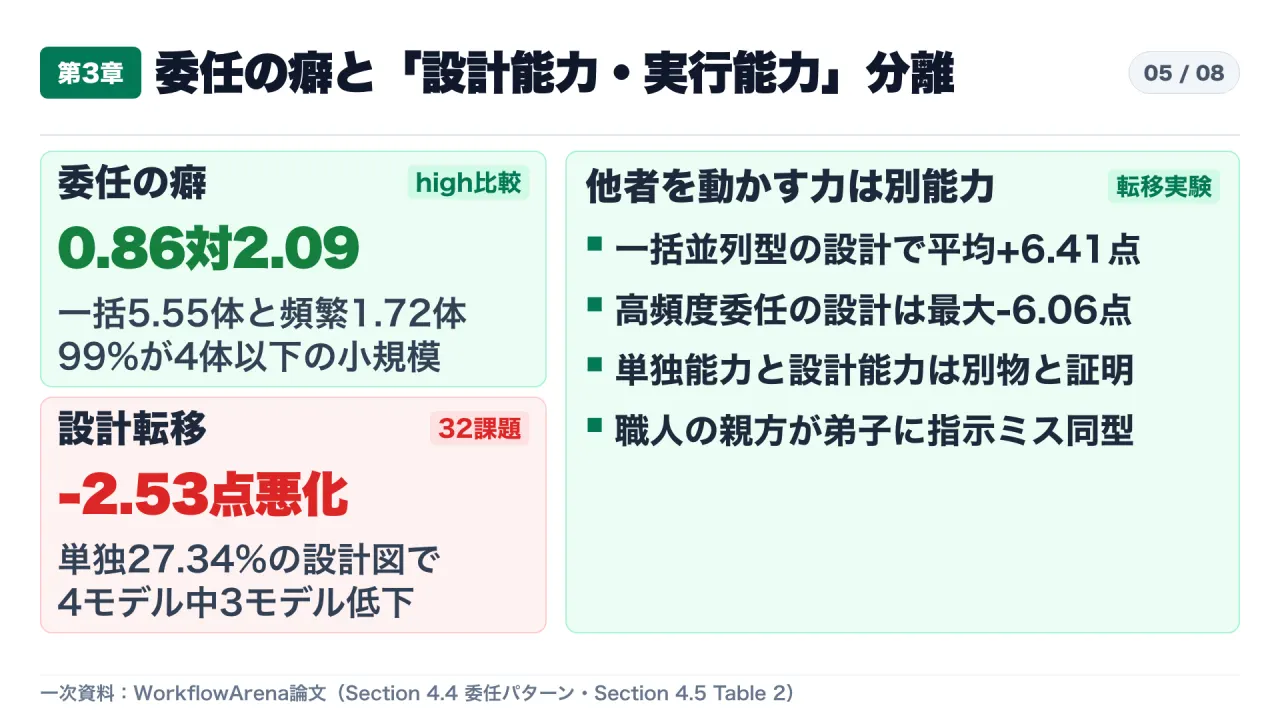
Second, dynamic mid-flight re-intervention can stall lightweight executors. On Executor B, receiving a fixed Static blueprint from the batch-parallel planner boosted performance from 25.08 to 30.37 (+5.29 points). Yet switching to Dynamic control—where the top planner intervened mid-execution to revise plans—collapsed the gain to 25.35 (+0.27 points), performing even worse than the rival planner’s dynamic run (29.22).
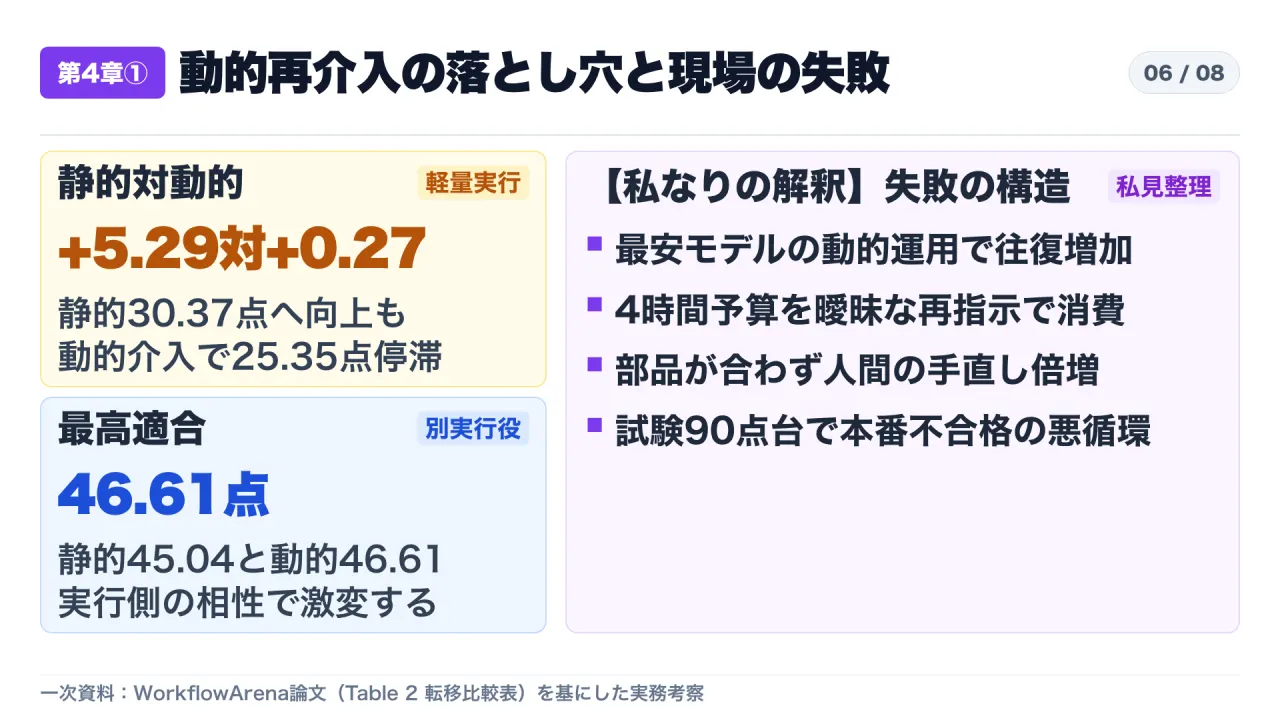
In craft organizations, a master artisan who produces flawless work solo often writes overly implicit instructions for apprentices—omitting critical prerequisites and causing worse output than if the apprentices organized the work themselves. Furthermore, repeatedly rewriting specs mid-shift for junior workers exhausts the shared time budget and breaks downstream alignment across deliverables.
5. Unconfirmed Boundaries and Three Operational Guardrails
Rigorous engineering decisions require separating verified empirical measurements from questions the primary dataset leaves unanswered:
- Unconfirmed Boundary 1 (Resolved Rate and Domain Breakdown in Transfer Tests): Table 2 in Section 4.5 reports 0–100 Continuous Scores across the 32 hard tasks, rather than binary Resolved Rates or per-domain transfer breakdowns. Whether the +6.41 continuous score lift translates linearly into higher end-to-end delivery rates in high-cliff domains like SWE and LAW remains unverified in the published tables.
- Unconfirmed Boundary 2 (Combined API Cost of Hybrid Planner-Executor Pairs): While Section 4.3 provides detailed token and dollar estimates for single-architecture runs ($6.66 vs. $29.26), the paper does not publish a full per-pair API cost matrix for hybrid planner-plus-executor runs. Whether a frontier planner paired with lightweight workers actually lowers total cost per resolved task below a standalone frontier configuration must be benchmarked on internal workloads.
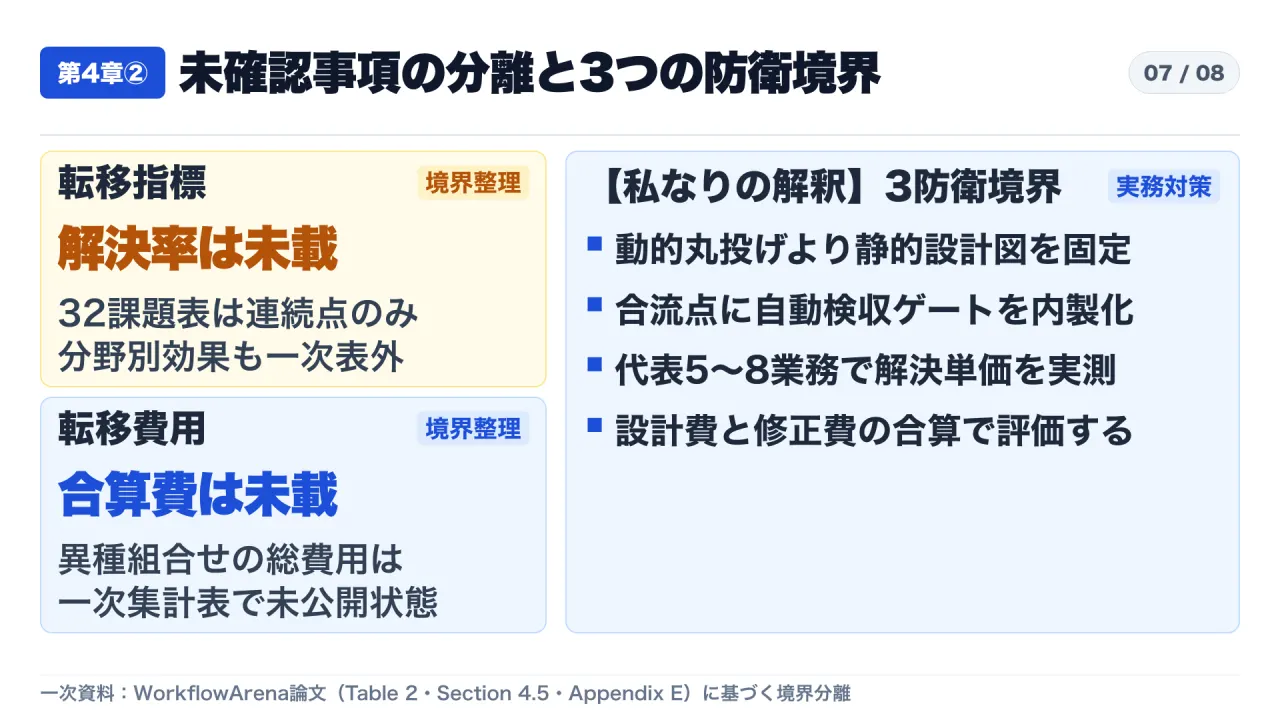
With those boundaries clearly separated, engineering leaders and operations teams deploying multi-agent workflows should standardize three concrete defense boundaries immediately:
- Lock Static Blueprints and Interface Contracts Before Execution When routing subtasks to lower-cost execution models, avoid granting unconstrained dynamic re-planning loops. Pre-define task boundaries, input/output schemas, and ownership interfaces in a static workflow contract so workers do not burn wall-clock budgets on ambiguous mid-flight rewrites.
- Place Deterministic Integration Gates at Every Merge Point A 96.98 partial score in software engineering or a 70.7 score in legal review holds zero production value if end-to-end verification fails. Build automated deterministic gates—type checks, regression suites, schema validators, and cross-document consistency assertions—at every convergence point so defective partial artifacts never propagate downstream.
- Measure Total Cost per Passed Deliverable on 5 to 8 Representative Tasks Do not rely on aggregate 145-task benchmark averages or token-cost estimates alone. Sample five to eight representative internal workflows (such as five production code changes and three multi-document contract reconciliations) and measure total end-to-end cost—including planner tokens, worker tokens, retry loops, and human rework hours—divided strictly by fully accepted deliverables.