Why High-Impact Engineers Get Underrated in the AI Era: DORA Metrics, "Tokenmaxxing," and the 20-Hour Flaky Test Dilemma
Drawing on 17 enterprise case studies from The Pragmatic Engineer and DORA’s 2026 field research, this architectural analysis reveals why vanity PR counts and AI token consumption penalize the engineers who quietly save their teams.
By Consul Oji | Enterprise Tech & AI Deep-Dive
Watch / Listen to the Full Episode (Japanese Audio): Why Engineers Who Help Their Teams Are Hard to Evaluate in the AI Era
Executive Summary: The Vanity Metric Trap in High-Velocity AI Environments
Consider a common dilemma in contemporary software engineering organizations. Engineer A uses generative AI tooling to submit twenty small pull requests across a single sprint, adding minor feature flags, documentation adjustments, and isolated helper scripts. Engineer B submits a single pull request, having spent thirty hours diagnosing and permanently eliminating a nondeterministic flaky test in the continuous integration (CI) pipeline that had been intermittently failing, burning ten minutes of developer time daily for six teammates across twenty working days.
Under traditional management regimes prioritizing easily countable throughput, Engineer A appears prolific, while Engineer B appears stagnant. Yet in terms of systemic enterprise value, Engineer B reclaimed twenty hours of wasted engineering capacity every single month, unblocked build queues, and restored confidence in the deployment harness.

This disconnect highlights a fundamental organizational pathology: the conflation of measurement for systemic improvement with appraisal for individual compensation. As artificial intelligence compresses the marginal cost of code generation, code volume has decoupled from organizational value. When organizations track crude activity proxies, they trigger Goodhart’s Law: when a measure becomes a target, it ceases to be a good measure.
To navigate this transition, technical leaders must examine the intersection of two foundational bodies of research: enterprise developer productivity benchmarks published by The Pragmatic Engineer and developer experience platform DX, alongside 2026 empirical investigations into AI development workflows conducted by Google Cloud’s DevOps Research and Assessment (DORA) team. These analyses demonstrate that in an era of abundant machine-authored code, the highest-leverage engineering contributions are found in code review, verification, system stabilization, and cross-functional mentorship.

1. The 2026 Landscape: Tokenmaxxing Leaderboards and the Verification Tax
The macroeconomic environment of software engineering tightened considerably between 2023 and 2026. As documented in early reporting from The Pragmatic Engineer, tech companies responded to cost pressures by formalizing stricter performance evaluations and accelerating low-performer exits. By early 2026, this pressure converged with enterprise mandates to adopt generative AI, prompting management to incorporate explicit “AI utilization” criteria into engineering review rubrics.
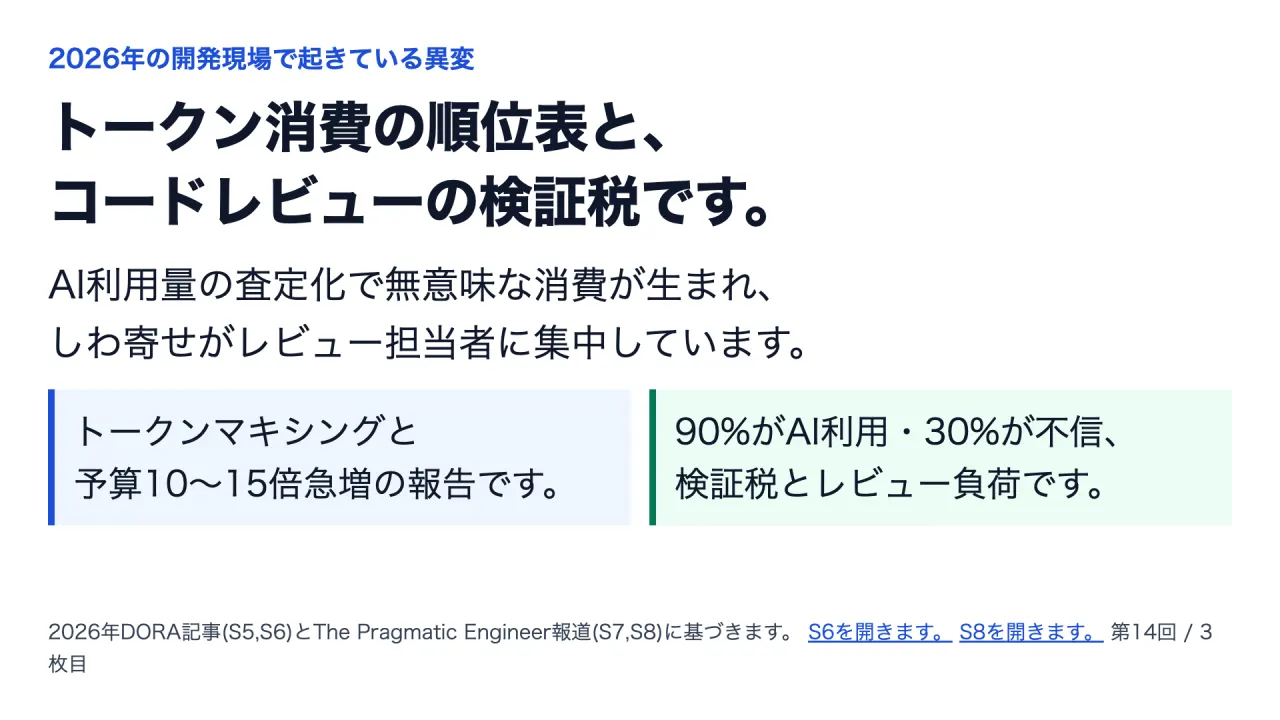
This evaluation mandate catalyzed an acute distortion that Google Cloud’s DORA research team identified in June 2026 as tokenmaxxing. In an attempt to visibly demonstrate AI fluency, competitive engineering departments established internal leaderboards that tracked cumulative LLM tokens consumed per developer.
Engineers, fearful of being categorized as legacy practitioners or penalized in compensation reviews, began routing trivial or synthetic tasks through autonomous coding agents. Telemetry revealed agents executing loops over non-production repositories, generating massive refactorings that no human intended to merge, solely to artificially inflate token leaderboard scores. Simultaneously, The Pragmatic Engineer published field research across fifteen enterprise engineering departments, revealing that organizational AI token expenditure had exploded by 10x to 15x over a six-month window. Individual developers consumed USD 500 per day or upwards of USD 1,400 in a single autonomous session using tools such as Claude Code. Just as software engineering spent decades dismantling the myth that lines of code (LOC) represent productivity, the industry recreated the identical failure mode under AI token metrics.
While code generation speed increased exponentially, aggregate software delivery stalled due to what DORA identified in March 2026 as the Verification Tax. Drawing from the 2025 DORA report covering approximately 5,000 respondents and a qualitative study of 1,110 Google software engineers, DORA found that while 90% of developers utilize AI tools and over 80% report subjective productivity gains, approximately 30% harbor little to no trust in AI-generated output. Hours previously required to author code were transferred into auditing syntax, investigating hallucinated API parameters, constructing regression assertions, and iteratively refining prompts.
Crucially, this cognitive load spills directly into peer review. In July 2026, following the enterprise deployment of frontier models such as Claude Opus 4.5 and GPT-5.4, The Pragmatic Engineer reported that the principal bottleneck in software engineering migrated definitively from writing code to reviewing code. An author can dispatch an autonomous agent to generate a 1,200-line pull request within minutes. However, peer reviewers must parse every line, verifying architectural coherence, thread safety, and edge-case behavior. Faced with an unmanageable influx of synthetic diffs, senior engineers encounter cognitive exhaustion, while others resort to rubber-stamping approvals. Consequently, DORA’s empirical data revealed that as unmanaged AI adoption accelerates, software throughput and delivery instability rise simultaneously.
2. Universal Principles from Google and LinkedIn: GSM, QUANTS, and Metric Triage
Forward-thinking engineering organizations decouple developer productivity measurement from individual performance appraisal, returning to foundational principles established by leading research teams.

In Software Engineering at Google (Chapter 7: Measuring Engineering Productivity), researchers Ciera Jaspan and Collin Green outline the framework developed by Google’s Developer Intelligence team. Google establishes that productivity can never be captured by a single scalar value. Instead, measurement programs must balance three dimensions in perpetual tension:
- Speed: Duration required to complete an engineering workflow.
- Ease: Cognitive friction, tooling ergonomics, and clarity experienced by the engineer.
- Quality: Structural integrity, maintainability, and customer value of the resulting artifact.
The authors present a vivid cautionary example: if leadership designates review turnaround speed as the sole key performance indicator, the optimal strategy is abolishing code review entirely. Review latency drops to zero, achieving unprecedented velocity metrics while systematically destroying system reliability. To safeguard against this collapse, Google structures measurement across five structural components under the QUANTS acronym: Quality of code, Attention from engineers, Intellectual complexity, Tempo/velocity, and Satisfaction.
Google’s primary methodological contribution is the Goal-Signal-Metric (GSM) framework. Most engineering leaders succumb to the streetlight effect──searching for lost keys under the lamp because the light is better, rather than in dark bushes where they fell. In management, this manifests as tracking pull request counts, commits, or token consumption simply because Git forges and API gateways emit those metrics automatically. GSM mandates a strict directional hierarchy:
- Goal: Articulate the organizational objective in plain language without referencing measurement tools (e.g., “Ensure engineers safely iterate without fear of breaking core services”).
- Signal: Identify observable real-world phenomena indicating the goal is being realized (e.g., “Engineers spend less time investigating unrelated test failures”).
- Metric: Construct a specific quantitative or qualitative proxy capturing the signal (e.g., “Median weekly hours spent rerunning flaky CI pipelines, paired with quarterly sentiment surveys”).
Google’s methodology establishes that when automated system telemetry contradicts qualitative engineer surveys, the quantitative telemetry is almost always the component that is flawed. In one documented case, automated build logs reported massive developer wait times, which survey data refuted; investigation revealed background automation scripts triggering headless builds that the metrics pipeline erroneously logged as humans waiting at terminals.
The imperative to protect metrics from gaming is demonstrated by LinkedIn’s developer productivity team. As documented by Gergely Orosz and Abi Noda, LinkedIn Senior Tech Lead Grant Jenks managed a composite Developer Experience (DX) Index synthesized from tooling performance and sentiment surveys. Despite its analytical power, LinkedIn enforced an iron rule: the DX Index was never tracked as a temporal line chart, its internal weighting remained intentionally dynamic, and it was strictly forbidden from being placed into Objectives and Key Results (OKRs) or individual performance appraisals. The moment a composite index is embedded into managerial compensation, teams optimize the metric rather than developer experience.
Corporate engineering leaders have implemented structural safeguards:
- Uber: Deployed “Code Inbox,” utilizing Risk Profiles to automatically classify pull requests by complexity and blast radius, ensuring senior human attention is allocated strictly to high-risk architectural diffs while low-risk changes proceed through streamlined paths.
- Shopify: Eliminated competitive AI leaderboards, deploying centralized utilization dashboards equipped with automated circuit breakers that terminate runaway background agent loops.
- Salesforce: Replaced raw token accounting with Agentic Work Units (AWUs), evaluating AI systems based on verified, end-to-end task completions.
- Starburst: Bypassed token consumption metrics entirely, evaluating AI tooling strictly through classical DORA lead times and incident recovery metrics (MTTR).
3. The Economics of Invisible Support: The 20-Hour Flaky Test and the Expertise Paradox
To demonstrate why activity-based evaluations fail, it is necessary to examine the concrete unit economics of background engineering maintenance and team-enabling contributions.

Consider the structural impact of an engineer resolving a nondeterministic test harness:
- Baseline friction: A team comprises 6 engineers. An unstable CI test fails intermittently on unrelated pull requests. Each engineer loses an average of 10 minutes daily checking failure logs, triggering manual reruns, and waiting for queue re-entry.
- Monthly drain: 6 engineers x 10 minutes daily x 20 working days monthly = 1,200 minutes = 20 engineering hours per month lost across the team.
- Intervention cost: An engineer steps away from direct feature delivery and spends 30 dedicated hours diving into race conditions, isolating network timeouts, and establishing deterministic mocks.
- Economic payback: At a cost of 30 hours, the intervention permanently eliminates the 20-hour monthly drain. The team achieves full break-even in 1.5 months. Across an annual horizon, the fix recovers 240 hours of focused engineering attention.
Reclaiming twenty hours of developer time does not return liquid cash to corporate reserves; it reclaims cognitive capacity. If recovered hours are squandered in administrative overhead, the financial return is diluted. Furthermore, if the test fix introduces regressions requiring ongoing maintenance, the break-even horizon recedes. Nevertheless, reporting this work as “repaired one test script” in an appraisal review completely obscures its economic value. When articulated as “invested 30 engineering hours to recover 20 hours per month of blocked capacity across 6 teammates with zero recurrences over the subsequent observation window,” the contribution stands as high-leverage architectural stewardship.
This dynamic is equally pronounced in mentorship. DORA’s 2026 investigations uncovered what researchers termed the Expertise Paradox. Because generative AI rapidly outputs plausible code, junior developers are frequently bypassed past the “productive struggle”──the iterative debugging through which fundamental mental models are forged. When edge cases inevitably erupt in distributed production environments, engineers who leaned exclusively on AI generation lack the architectural comprehension required to resolve them. In survey responses, developers remarked that utilizing AI in unfamiliar technical domains felt like “the blind leading the blind.”
To mitigate this systemic decay, DORA recommended formalizing senior-junior pairing protocols, where senior engineers inspect AI-generated proposals alongside junior staff, interrogating design trade-offs and structural invariants. Evaluating this mentorship cannot be achieved by counting tickets, Slack replies, or internal Wiki edits. The true outcome of effective mentorship is observed in behavioral autonomy: can the mentored engineer independently diagnose, verify, and resolve that class of architectural challenge during the subsequent operational cycle?
Conversely, technical leadership must avoid the inverse trap: uncritically praising all maintenance and refactoring. Rewriting low-traffic legacy modules that present zero operational risk or indulging in aesthetic code reorganization while customer delivery stalls is equally pathological. The objective is identifying the acute organizational bottleneck and directing engineering effort toward removing it.
4. An Actionable 3-Tier Evaluation Architecture for Modern Engineering Organizations
Restructuring an enterprise-wide compensation framework requires extensive governance. However, engineering managers and team leads can immediately implement a robust, lightweight evaluation structure within their local teams.

Instead of tracking pull request volumes, ticket velocities, or token expenditures, engineering teams should evaluate monthly performance documentation through three foundational questions:
- What concrete operational outcome improved? The engineer specifies the systemic friction that was resolved: reduced review wait times, stabilized build pipelines, eliminated flaky failures, or accelerated onboarding flows.
- How was that improvement verified? The engineer supplies comparative baseline evidence: telemetry graphs showing pipeline failure rates dropping from 14% to 0%, before-and-after build durations, or direct confirmation from affected service owners.
- Who was helped, or who co-delivered the result? The engineer identifies the collaborators involved: teammates who assisted in defining specifications, or specific colleagues who were unblocked, paired with, or mentored.
Critically, every quantitative claim must be paired with operational context. If a team experienced a dip in feature velocity because two engineers were executing a complex database migration during an on-call rotation with diminished holiday staffing, that operational context must be documented. Context prevents raw numbers from masquerading as definitive evaluations.

Measurement protocols often collapse under administrative burden. A sustainable structure follows this economic budget:
- Weekly individual log: Each engineer spends 5 minutes at week’s end recording a three-line summary answering the three diagnostic questions. Across four weeks for six engineers, this consumes 120 minutes = 2.0 team hours per month.
- Monthly retrospective: The engineering manager and six engineers gather for a dedicated 30-minute session to evaluate team friction, review tooling bottlenecks, and refine logging procedures. 7 participants x 30 minutes = 210 minutes = 3.5 team hours per month.
- Aggregate investment: The team invests exactly 5.5 hours per month across the entire organization.
An absolute operational boundary must govern this process: the monthly 30-minute team retrospective must focus exclusively on improving collective workflow mechanisms and tooling friction; individual compensation, rankings, and performance tiers must never be introduced into this forum. Individual appraisals remain strictly confined to private 1-on-1 management channels.
Furthermore, leadership must apply metric triage: if maintaining this 5.5-hour operational cadence fails to produce actionable insights within two consecutive months, the practice should be discarded. As Google’s productivity team observed: if measuring a phenomenon does not alter operational behavior or decision-making, it is not worth measuring. Most critically, psychological safety must be preserved. Data gathered to surface organizational friction must never be weaponized during subsequent compensation reviews. When engineers are penalized for honestly reporting broken build scripts or slow review cycles, the organization’s true bottlenecks are driven underground.

Conclusion & 3 Strategic Directives for Engineering Leadership
As generative AI and autonomous agents accelerate code authoring, the fundamental challenge of software engineering remains human and organizational. Machines produce infinite lines of syntactically valid code, but cannot assess whether an architectural trade-off serves long-term business resilience, nor can they support a burned-out colleague through a production crisis.
Crude volume metrics──measured in pull request volume, commit velocity, or AI token expenditure──provide an illusion of control while systematically penalizing the engineers who preserve system integrity. Engineering leadership must establish a culture where system maintenance and peer elevation are visible, measurable, and rewarded.
Engineering leaders should implement three concrete directives:
- Audit internal dashboards for Goodhart contamination: Review all engineering metrics currently exposed to executive leadership. Immediately retire individual pull request leaderboards, commit rankings, and AI token consumption scorecards.
- Institute the Three Diagnostic Questions in performance 1-on-1s: Shift regular status conversations from “How many tickets did you close?” to “What improved, how did you verify it, and who did you unblock?”
- Execute the Organizational Invisibility Audit: Convene engineering leads and ask a single defining question: “What is the single most critical task in our organization that absolutely must be done, but currently possesses no legitimate home on our official evaluation rubric?”
The answers to that question will reveal the true pillars of your engineering organization──and the exact contributions that your management systems must urgently protect.
Primary Sources & References
- Measuring Developer Productivity: Real-World Examples (Gergely Orosz & Abi Noda, January 2024)
- The Scoop #40: Performance reviews, equity refreshers and cost cutting (Gergely Orosz, March 2023)
- Software Engineering at Google, Chapter 7: Measuring Engineering Productivity (Ciera Jaspan & Collin Green)
- About The Pragmatic Engineer (Gergely Orosz Background & Experience)
- DORA | Balancing AI tensions: Moving from AI adoption to effective SDLC use (Jessica Baolin & Nathen Harvey, March 2026)
- DORA | Finding balance in the era of tokenmaxxing (Evan Conaway, June 2026)
- The Pulse: token spend breaks budgets – what next? (Gergely Orosz, April 2026)
- The Pulse: New trend - concern about massive increase in code review load (Gergely Orosz, July 2026)