Did Japan's Cash Ratio Drop Because Households Bought Stocks? ── Dissecting ¥2,519T in Japanese Household Assets by Net Transactions vs. Market Revaluation in BOJ Flow of Funds
An empirical macroeconomic analysis of the Bank of Japan’s Flow of Funds Accounts (Q2 2026 preliminary): Why the 9.1-percentage-point decline in cash and deposits reflects 94% asset price revaluation rather than net capital deployment from cash into equities.
Japanese Edition (Original Article): Read on note YouTube Podcast Edition (Full Audio & Visual Analysis): Watch on YouTube
Core Conclusion: The Cash Ratio Fell by 9.1 Percentage Points, but Statistics Reveal No Evidence of Cash Reallocation into Equities
Let us state the empirical conclusion directly. According to the preliminary Flow of Funds Accounts for the second quarter of 2026 (April–June) released by the Bank of Japan (BOJ), total financial assets held by Japanese households reached ¥2,519 trillion as of end-June 2026. Of this total, currency and deposits accounted for 44.9%. At end-December 2022, currency and deposits stood at 54.0%, representing a decline of 9.1 percentage points over a 3.5-year observation period.
However, this decline cannot be interpreted as empirical evidence that Japanese households “depleted bank deposits to buy equities.” Over the cumulative 14 quarters spanning from Q1 2023 through Q2 2026, Japanese households:
- Sold a net cumulative ¥12.0 trillion of shares and other equities (net selling);
- Bought a net cumulative ¥34.6 trillion of investment trusts (net buying); and
- Actually expanded their holdings of currency and deposits by ¥14.9 trillion (net inflow).
According to independent accounting calculations, out of the total expansion of approximately ¥361 trillion across household equity and investment trust balances, cumulative net trading transactions accounted for only approximately ¥23 trillion (a net positive inflow driven entirely by investment trusts offsetting equity sales). The remaining approximately 94% of balance growth was generated entirely by the “reconciliation account” (調整額)──market price appreciation and asset revaluations.
The primary driver behind the contraction in Japan’s household cash ratio was not an exodus from cash into risk assets, but the extraordinary expansion of non-cash asset values driven by stock market gains.
This publication is designed for professionals, corporate strategists, economists, and analysts who encounter headlines such as “Japanese household asset allocation shifts” or “from savings to investment” in media reports and internal presentations, and who require verifiable empirical rigor to guide corporate decisions. It provides an objective breakdown for those who lack the time to dissect multi-thousand-row central bank balance sheets directly, or who wish to avoid conflating aggregate macroeconomic balance sheet shifts with individual consumer behaviors.
Upon finishing this analysis, readers will master three concrete analytical capabilities:
- Decomposing asset allocation ratio movements into net trading transactions (capital flows) versus reconciliation adjustments (unrealized asset price revaluations);
- Reconciling preliminary releases with revised vintages and aligning observation timestamps across disparate statistical publications; and
- Rigorously separating conclusions that macro-level sector aggregates support from micro-level behavioral claims that the statistics cannot prove.
Disclaimer: This analysis is prepared strictly for objective economic research, statistical auditing, and financial reporting analysis. It does not contain investment recommendations, trading endorsements, or securities advice. The empirical data utilized is restricted exclusively to the Bank of Japan’s Flow of Funds Accounts, the BOJ Comparative Analysis of Flow of Funds in Japan, the United States, and the Euro Area, the BOJ Outlook for Economic Activity and Prices, and the Ministry of Internal Affairs and Communications Consumer Price Index.
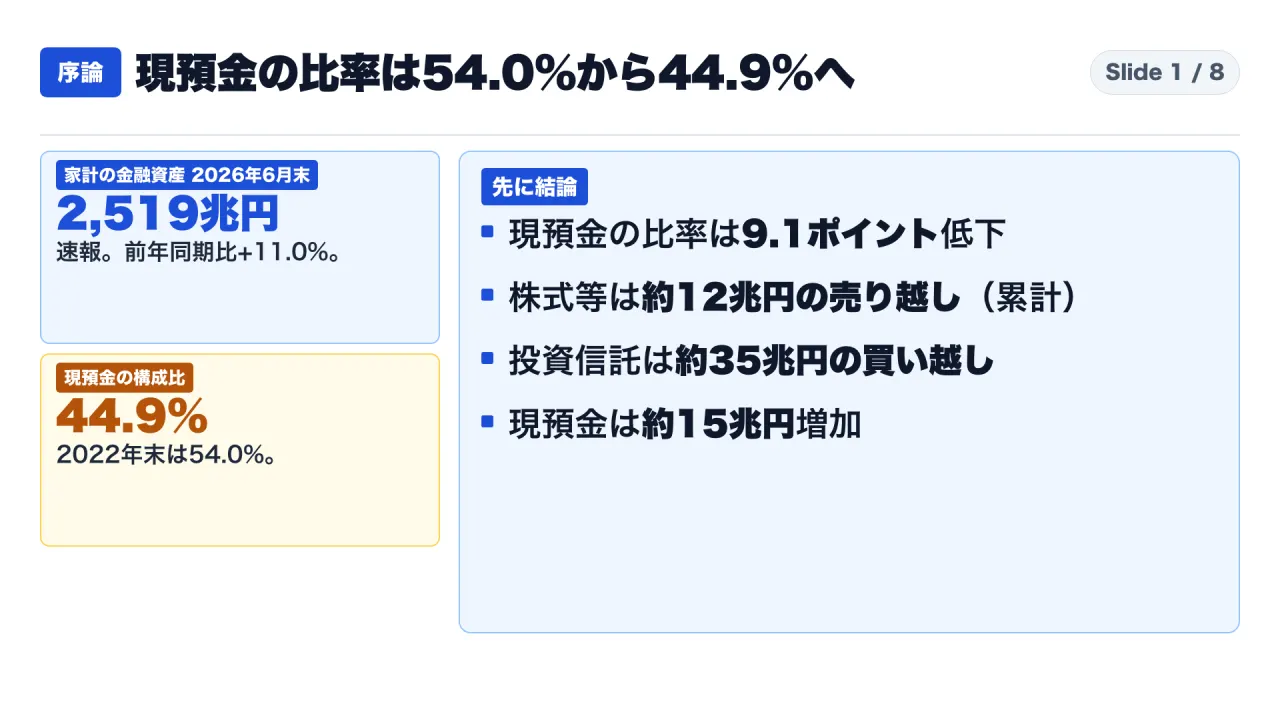
Figure 1 summarizes the empirical findings of this entire investigation: the 9.1-percentage-point decline in cash ratio, the cumulative net trading balance, and the simultaneous expansion of absolute cash holdings.
Analytical Methodology: Distinguishing Empirical Facts, Official Statements, Independent Calculations, and Interpretations
To maintain strict scientific hygiene, every paragraph and finding in this analysis is categorized under one of four explicit methodological designations:
- [Fact]: Figures, data series, and textual statements published verbatim in official statistical documentation released by the Bank of Japan (BOJ) or the Statistics Bureau of Japan (MIC).
- [BOJ Statement]: Official explanatory language drafted by the Bank of Japan articulating its statistical definitions, economic forecasts, or monetary policy perspectives, reproduced without editorial spin.
- [Independent Calculation]: Quantities calculated independently by the author from published primary data. These do not represent official central bank aggregate lines. Formulas, underlying figures, and reconciliation identities are explicitly disclosed.
- [Author Interpretation]: Analytical deductions, logical syntheses, and contextual evaluations derived by the author from the source evidence, clearly delineated from official central bank declarations.
Methodological Constraints and Boundary Conditions
This investigation operates under documented data constraints. The international comparative figures for Japan, the United States, and the Euro Area, as well as selected historical consumer price indexes, were compiled from published PDF document tables. Time-series data series were queried directly from the Bank of Japan Time-Series Data Search database without alteration, with conversion from hundred million yen (1億円) to trillions of yen (1兆円 = 10,000 hundred million yen) executed by the author. Account-specific vehicle classifications (such as the tax-exempt New NISA framework) are aggregated anonymously within macro sector accounts and cannot be isolated within this dataset.
Conceptual Framework: Standardizing Flow of Funds Terminology
Before examining the balance sheets, we establish precise definitions for the technical terminology of the Flow of Funds Accounts:
- Flow of Funds Accounts (資金循環統計): A comprehensive statistical matrix published quarterly by the Bank of Japan documenting financial transactions, assets, and liabilities across all institutional sectors of the economy. In this article, “Households” (家計) refers strictly to the macroeconomic aggregate of the household sector, not individual persons or single families.
- Outstanding Amount / Stock (残高): The total market or book valuation of assets held at a specific calendar date. The ¥2,519 trillion recorded at end-June 2026 represents a stock measurement.
- Component Ratio / Asset Share (構成比): The percentage proportion of an individual asset category relative to total financial assets held by that sector.
- Percentage Points (ポイント): The arithmetic difference between two percentage figures. The shift from 54.0% to 44.9% represents a decline of 9.1 percentage points. This must never be described as a “9.1% decline,” which would represent an entirely different calculation (a contraction of the ratio itself by approximately 17%, calculated as 44.9 / 54.0 = 0.83). Percentage points provide the unambiguous standard.
- Net Transactions / Transaction Value / Flow (取引額 / フロー): Purchases minus sales over a defined observation interval. A positive value indicates net purchases (or net deposit inflows); a negative value indicates net sales (or net withdrawals).
- Reconciliation Account / Adjustments (調整額): Defined in BOJ technical documentation as the divergence between the change in outstanding amounts (stock change) and net transaction values (flow) over an observation period. It captures market price changes, foreign exchange rate revaluations, and classification adjustments. In short:
Stock Change - Net Transactions = Reconciliation Adjustment. - Preliminary vs. Revised Estimates (速報 / 確報): The initial quarterly release is a provisional estimate subject to retrospective revisions as primary data sources mature. Data for Q2 2026 represents a preliminary estimate.
Section 1: Household Financial Assets Reached ¥2,519 Trillion (Preliminary) ── Currency and Deposits Remain the Dominant Class at 44.9%
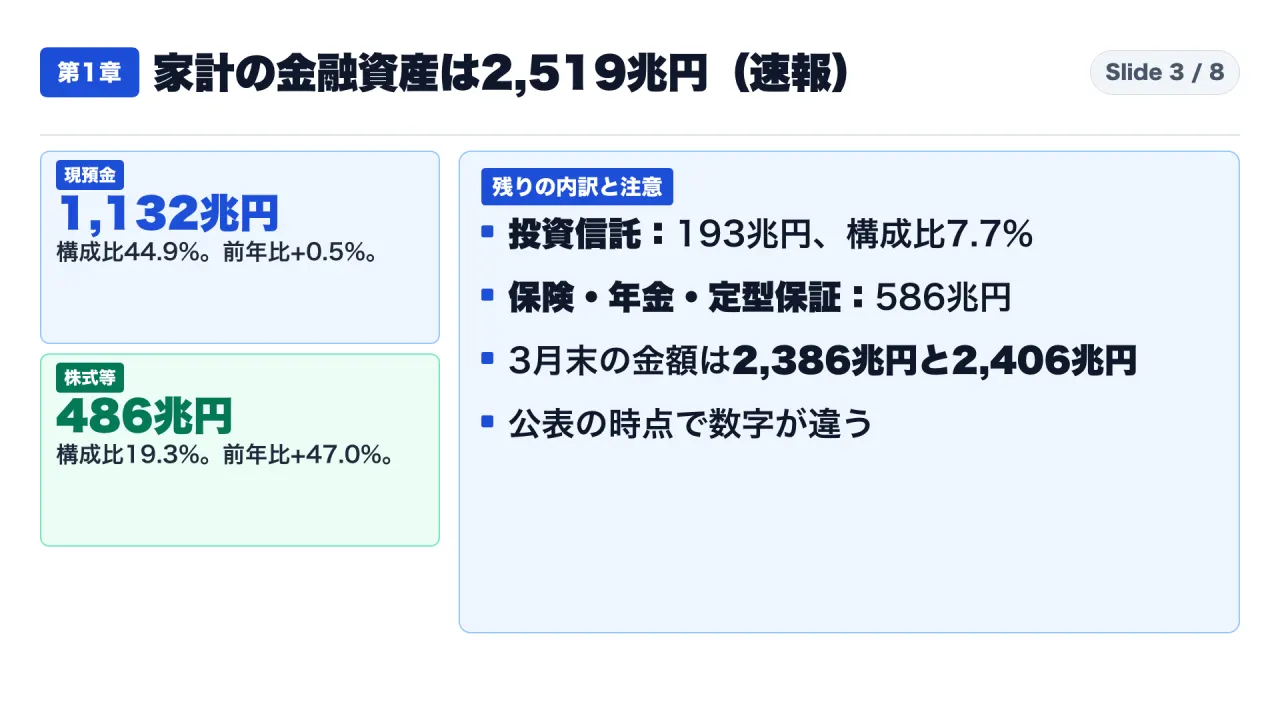
[Fact] According to the Bank of Japan Reference Charts for the Flow of Funds Accounts (released September 17, 2026; Q2 2026 preliminary release), Japanese household financial assets totaled ¥2,519 trillion as of end-June 2026, marking an increase of 11.0% compared to the same period in the prior year.
The asset breakdown stood as follows:
- Currency and deposits: ¥1,132 trillion (44.9% asset share)
- Insurance, pensions, and standardized guarantees: ¥586 trillion (23.3%)
- Shares and other equities: ¥486 trillion (19.3%)
- Investment trusts: ¥193 trillion (7.7%)
[Fact] Year-on-year growth rates across asset categories reveal dramatic disparities:
- Currency and deposits: +0.5%
- Shares and other equities: +47.0%
- Investment trusts: +36.8%
- Insurance, pensions, and standardized guarantees: +3.2%
The growth rates of shares and other equities (+47.0%) and investment trusts (+36.8%) were extraordinary compared to fixed-income and deposit categories.
[Author Interpretation] When looking solely at balance growth, it is easy to assume that capital was actively shifted out of deposits into equities and investment trusts. However, stock balances expand through two distinct mechanics: fresh capital purchases (cash inflows) and market price appreciation (unrealized capital gains). Analyzing outstanding balances alone cannot determine which mechanism drove the expansion. We resolve this ambiguity in Section 2.
The Presence of Divergent Estimates for the Same Benchmark Date
[Fact] A forensic comparison of BOJ releases reveals that household financial assets at end-March 2026 were recorded at ¥2,386 trillion in the “Comparative Analysis of Flow of Funds in Japan, the US, and the Euro Area” (published August 31, 2026). However, in the Q2 2026 preliminary reference charts (published September 17, 2026), the identical end-March 2026 benchmark was revised upward to ¥2,406 trillion.
[Independent Calculation] The retrospective revision discrepancy between the two publications equals:
2,406 - 2,386 = ¥20 trillion.
[Author Interpretation] The source documents do not detail the exact line-item source of this ¥20 trillion adjustment. Analysts must recognize that preliminary Flow of Funds releases remain subject to retroactive historical adjustments. Comparing numbers across disparate publication releases without verifying revision vintages introduces severe analytical distortion. The end-June 2026 figure of ¥2,519 trillion must be treated with the same understanding.
Section 2: The Currency and Deposits Ratio Plunged 9.1 Percentage Points ── Yet Households Were Net Sellers of Equities Over 14 Quarters
Empirical Verification of Ratio Changes
[Independent Calculation] Using the raw time-series database of the Bank of Japan, we compute the asset composition at end-December 2022:
- Household currency and deposits: ¥1,116,707.8 billion
- Total household financial assets: ¥2,066,709.5 billion
- Cash and deposits ratio: 54.0%
At end-June 2026:
- Household currency and deposits: ¥1,131,594.3 billion
- Total household financial assets: ¥2,519,128.9 billion
- Cash and deposits ratio: 44.9%
- Net change: -9.1 percentage points.
Over the same interval:
- Shares and other equities rose from 11.2% to 19.3% (+8.1 percentage points);
- Investment trusts rose from 4.2% to 7.7% (+3.5 percentage points).
The following table presents the underlying time-series balances from the Bank of Japan (in hundred million yen / 億円, with equivalent trillion yen conversions):
| Asset Category | End-Dec 2022 (¥100M) | End-June 2026 (¥100M) | Difference (¥100M) | Change in Trillions |
|---|---|---|---|---|
| Currency and Deposits | 11,167,078 | 11,315,943 | +148,865 | +¥14.9T |
| Shares and Other Equities | 2,316,062 | 4,856,251 | +2,540,189 | +¥254.0T |
| Investment Trusts | 867,200 | 1,933,357 | +1,066,157 | +¥106.6T |
| Total Household Assets | 20,667,095 | 25,191,289 | +4,524,194 | +¥452.4T |
This balance table illustrates a crucial principle: For currency and deposits, market valuation does not change. Therefore, the change in outstanding stock (+148,865 hundred million yen, or +¥14.9 trillion) matches the cumulative net transactions over this period exactly.
In sharp contrast, for shares and other equities (+¥254.0 trillion) and investment trusts (+¥106.6 trillion), the expansion in outstanding balances diverges completely from transaction flows. That massive divergence represents the reconciliation adjustment.
Across all financial assets, household wealth expanded by ¥452.4 trillion (from ~¥2,067 trillion to ¥2,519 trillion). Currency and deposits grew by ¥14.9 trillion (from ~¥1,117 trillion to ¥1,132 trillion). Non-cash assets expanded by approximately ¥437.5 trillion. The cash ratio fell not because bank balances shrank, but because non-cash assets expanded at an overwhelmingly faster rate.
Transaction Flows: Equities Were Sold on Net
[Independent Calculation] Summing the quarterly net transactions (flows) for the household sector across the 14 quarters from Q1 2023 through Q2 2026 yields the empirical truth. Positive values denote net purchases (or deposit accumulation); negative values denote net sales (or cash withdrawals). The values are presented in hundred million yen (億円):
| Observation Quarter | Shares & Equities Flow (¥100M) | Investment Trusts Flow (¥100M) | Currency & Deposits Flow (¥100M) |
|---|---|---|---|
| Q1 2023 | +122 | +5,581 | -104,975 |
| Q2 2023 | -33,217 | +16,373 | +116,430 |
| Q3 2023 | +1,951 | +20,503 | -44,340 |
| Q4 2023 | -2,074 | +3,774 | +145,010 |
| Q1 2024 | -17,841 | +32,445 | -91,098 |
| Q2 2024 | +6,646 | +30,168 | +84,931 |
| Q3 2024 | +694 | +25,335 | -106,455 |
| Q4 2024 | -23,842 | +18,800 | +179,768 |
| Q1 2025 | +13,898 | +34,600 | -149,146 |
| Q2 2025 | -18,918 | +22,061 | +66,395 |
| Q3 2025 | -27,897 | +21,094 | -42,368 |
| Q4 2025 | -1,865 | +28,505 | +178,151 |
| Q1 2026 | -15,845 | +47,143 | -142,366 |
| Q2 2026 | -2,176 | +39,628 | +58,928 |
| Cumulative 14-Quarter Total | -120,364 (-¥12.0T) | +346,010 (+¥34.6T) | +148,865 (+¥14.9T) |
The cumulative totals reveal the actual behavior of Japanese households:
- Shares and other equities recorded cumulative net sales of ¥12.0 trillion (-120,364 hundred million yen);
- Investment trusts recorded cumulative net purchases of ¥34.6 trillion (+346,010 hundred million yen);
- Currency and deposits recorded cumulative net additions of ¥14.9 trillion (+148,865 hundred million yen).
Households were net buyers of direct equities in only 5 out of 14 quarters (Q1 2023, Q3 2023, Q2 2024, Q3 2024, and Q1 2025). In the remaining 9 quarters, households were net sellers.
In contrast, investment trusts experienced uninterrupted net purchases across all 14 consecutive quarters, accelerating from ~¥0.56 trillion per quarter in early 2023 to ~¥4.71 trillion in Q1 2026 and ~¥3.96 trillion in Q2 2026.
Currency and deposits exhibited seasonal cyclicality──contracting during bonus payout allocation periods and tax payment windows (Q1 and Q3) and expanding strongly in bonus deposit receipt months (Q2 and Q4)──while maintaining a positive cumulative upward trend (+¥14.9 trillion).
Decomposing Balance Expansion: Transactions vs. Reconciliation Adjustments
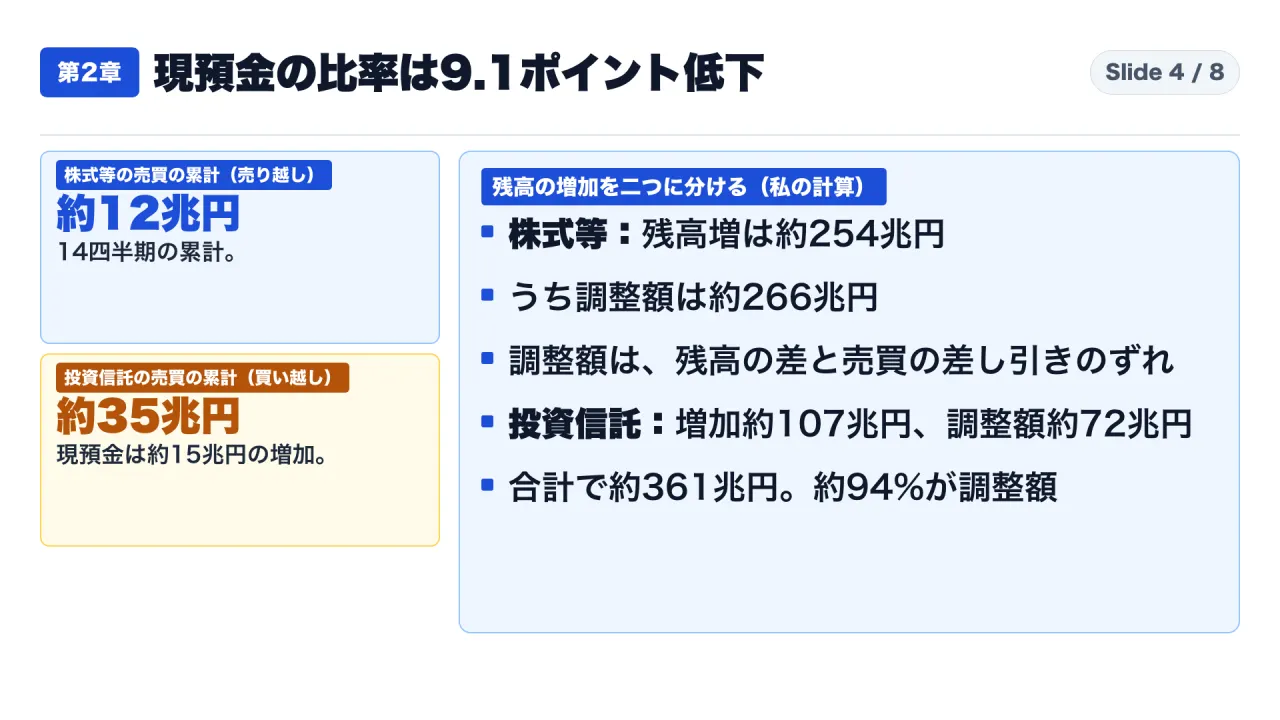
[Independent Calculation] Between end-December 2022 and end-June 2026, household equity balances increased by approximately ¥254.0 trillion. Since cumulative net transactions were negative ¥12.0 trillion, the reconciliation adjustment equals:
254.0 - (-12.0) = ¥266.0 trillion.
For investment trusts, balances expanded by approximately ¥106.6 trillion. Net transactions accounted for ¥34.6 trillion, leaving a reconciliation adjustment of:
106.6 - 34.6 = ¥72.0 trillion.
Combining equities and investment trusts:
- Total balance expansion:
254.0 + 106.6 = ¥360.6 trillion(~¥361 trillion); - Total cumulative net transactions:
34.6 - 12.0 = +¥22.6 trillion(~¥23 trillion); - Total reconciliation adjustments:
266.0 + 72.0 = ¥338.0 trillion(~¥338 trillion).
Reconciliation adjustments accounted for approximately 93.7% (~94%) of the total balance growth across household equity and investment trust assets.
[Independent Calculation] To isolate the effect of asset price appreciation, we execute a counterfactual simulation: What would the cash ratio be if reconciliation adjustments were zero?
Deducting the ¥338 trillion in equity and investment trust reconciliation adjustments from total household financial assets of ¥2,519 trillion yields a counterfactual baseline of approximately ¥2,181 trillion.
Dividing household currency and deposits (¥1,131.6 trillion) by this counterfactual total yields:
1,131.6 / 2,181 ≈ 51.9%.
Compared to 54.0% at end-December 2022, the cash ratio would have contracted by only 2.1 percentage points. Thus, of the total 9.1-percentage-point decline, approximately 7.0 percentage points are explained entirely by paper gains from market price appreciation.
[Fact] In the single quarter of Q2 2026 (April–June), household equity net transactions were negative ¥0.2 trillion (-2,176 hundred million yen). Yet according to the BOJ preliminary reconciliation table, equity reconciliation adjustments were positive ¥61.0 trillion, driving an outstanding balance increase of ¥60.8 trillion. Over those three months, virtually 100% of household equity balance expansion was pure price revaluation.
A simplified mathematical analogy demonstrates this mechanism:
Suppose an investor holds 100 shares worth ¥100. The investor sells 10 shares (net transaction = -10). The market price of the remaining 90 shares rises by 20%. The ending balance is:
90 × 1.2 = 108.
The balance change is +8.
The reconciliation adjustment is 8 - (-10) = +18.
Even though the investor was a net seller, their total portfolio value expanded because market appreciation overwhelmed net sales. This exact structural dynamic operated across Japan’s aggregate household sector at macro scale.
[Author Interpretation] Confirmed net capital deployment was concentrated in investment trusts. However, macro Flow of Funds tables do not delineate whether these investment trusts hold domestic equities, foreign equities (such as global index trackers), or foreign currency assets.
Section 3: Japan-US-Europe International Comparison: Structural Cash Biases and the Imperative to Align Timestamps
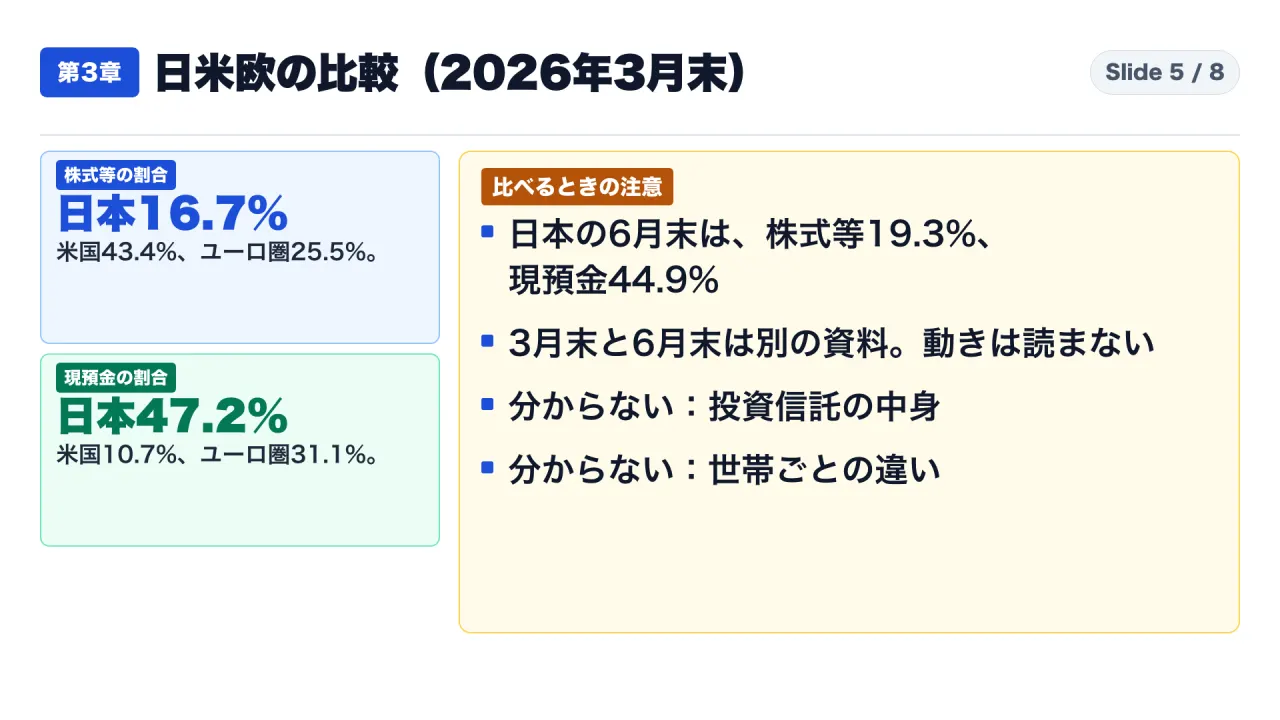
[Fact] According to Chart 2 of the Bank of Japan’s “Comparative Analysis of Flow of Funds in Japan, the United States, and the Euro Area” (published August 31, 2026; data benchmarked as of end-March 2026), household financial asset allocations compare as follows:
| Asset Category | Japan (End-March 2026) | United States (End-March 2026) | Euro Area (End-March 2026) |
|---|---|---|---|
| Currency and Deposits | 47.2% | 10.7% | 31.1% |
| Shares and Other Equities | 16.7% | 43.4% | 25.5% |
| Investment Trusts | 6.9% | 13.3% | 12.1% |
| Insurance, Pensions & Guarantees | 24.5% | 25.7% | 26.5% |
[Independent Calculation] The share allocated to insurance, pensions, and standardized guarantees is remarkably uniform across all three economic blocs, ranging from 24.5% in Japan to 26.5% in the Euro Area──a spread of only 2.0 percentage points.
In contrast, the structural divergence is concentrated in currency and deposits and equities:
- Japan’s currency and deposits share (47.2%) exceeds that of the United States (10.7%) by 36.5 percentage points;
- The United States’ equity share (43.4%) exceeds that of Japan (16.7%) by 26.7 percentage points.
[Author Interpretation] Japan retains a structural overweight in cash and deposits and an underweight in equities compared to Western counterparts. However, this comparison reflects the end-March 2026 benchmark.
The Pitfall of Comparing Disparate Timestamps
Within Japan, the equity share was 16.7% at end-March 2026 and 19.3% at end-June 2026. The March international comparison was built upon a Japanese asset base of ¥2,386 trillion, whereas the June preliminary table revised March to ¥2,406 trillion.
Writing that “Japan’s household equity allocation surged by 2.6 percentage points between March and June” is methodologically invalid because it conflates two different statistical publication vintages and differing base denominators.
To preserve analytical integrity:
- Always compare figures within the identical release benchmarked to the exact same calendar date;
- When comparing figures across separate publications, explicitly disclose both the publication release date and the reference observation timestamp.
What Macro Flow of Funds Statistics Do Not Reveal
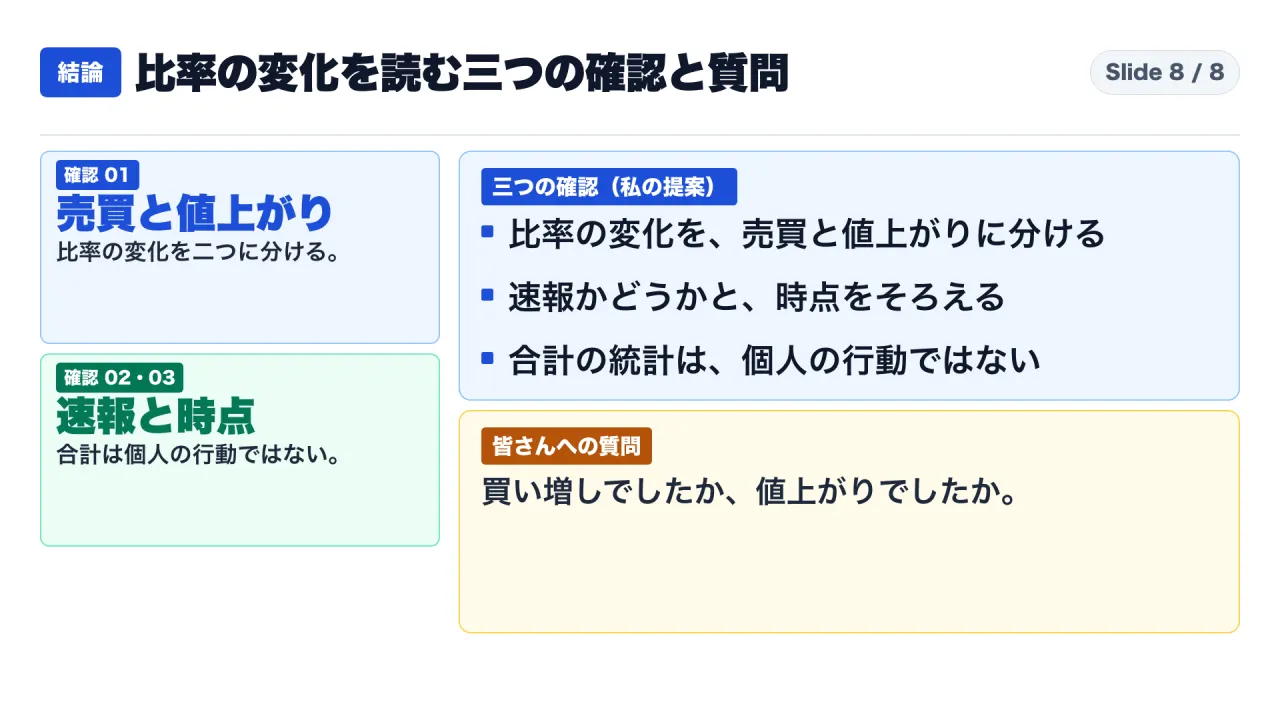
[Author Interpretation] Based on the data available in the Flow of Funds Accounts, three analytical questions cannot be answered:
- The asset composition of investment trusts: Investment trusts are reported as a single aggregated line. The data does not disclose whether funds are deployed into domestic equities, overseas equities, or foreign-currency bonds.
- Distributional differences across household cohorts: Flow of Funds measures macroeconomic sector totals. It does not provide visibility into demographic differences, income quintiles, or retail wealth distribution.
- The macroeconomic drivers of equity price appreciation: While statistics quantify the magnitude of reconciliation adjustments, explaining the corporate earnings, currency movements, or foreign capital flows driving stock prices lies beyond the scope of flow-of-funds balance sheets.
Cross-border national capital movements are examined through balance of payments and International Monetary Fund reports in separate analyses; this document is strictly bounded to household balance sheets.
Macro Context: Cash Asset Growth vs. Inflation ── Growth Lags CPI, but Measurement Methodologies Differ
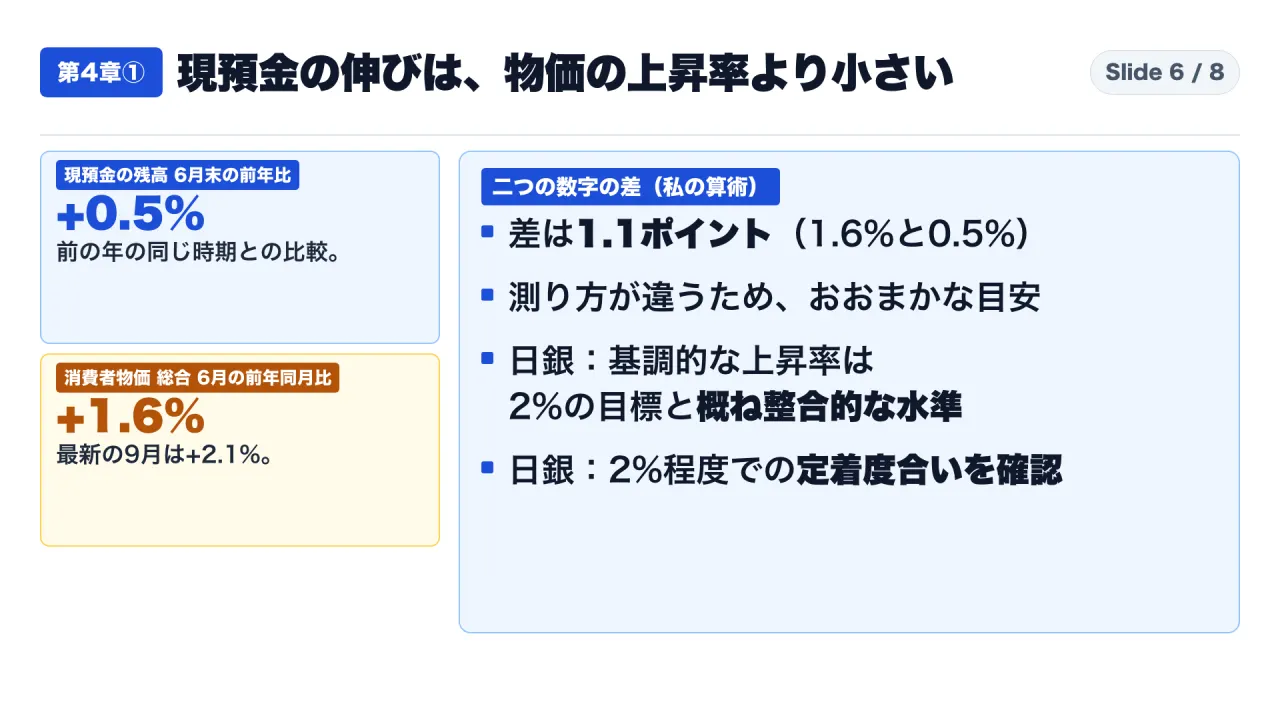
[Fact] As of end-June 2026, household currency and deposits increased by 0.5% year-on-year. During the identical month (June 2026), the nationwide headline Consumer Price Index (CPI) rose by 1.6% year-on-year (Ministry of Internal Affairs and Communications Statistics Bureau, 2025 base). By September 2026, nationwide headline CPI inflation accelerated to 2.1% year-on-year.
[Independent Calculation] Comparing the June 2026 metrics yields an arithmetic gap of:
1.6 - 0.5 = 1.1 percentage points.
[Author Interpretation] Extreme caution is required when interpreting this gap. Currency and deposit growth measures the year-on-year percentage change in end-of-quarter outstanding balances (stock), whereas CPI measures the change in monthly average consumer prices (flow index). Subtracting one from the other provides a broad heuristic, not a methodologically pure measurement of real purchasing power erosion.
[BOJ Statement] In its October 2026 Outlook for Economic Activity and Prices, the Bank of Japan stated that the underlying trend of consumer prices is generally consistent with the 2% “price stability target.” The BOJ further noted that from the perspective of achieving the price stability target in a sustainable and stable manner, it is critical to confirm the degree to which inflation settles at approximately 2%. This analysis quotes the central bank’s perspective without editorial endorsement.
Author’s Synthesis: Ratio Shifts Driven by Market Appreciation, Bound by Analytical Limitations
To summarize the empirical findings:
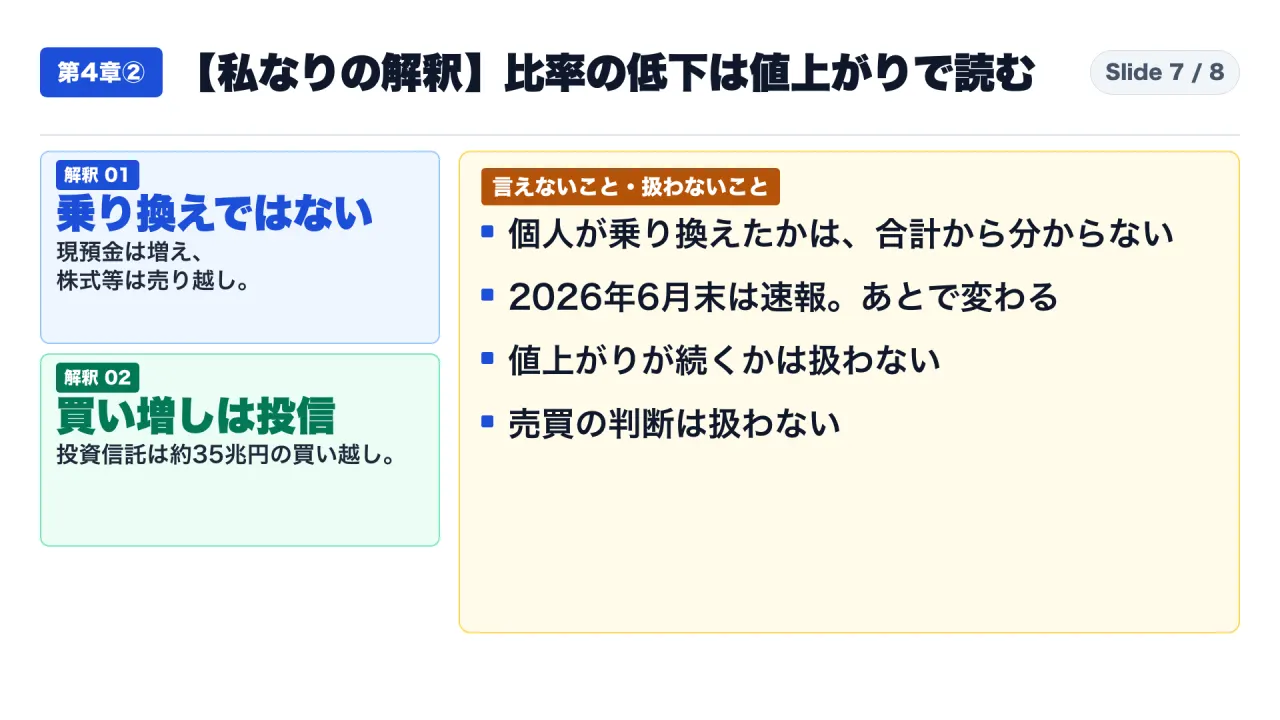
- The decline in the cash ratio was driven by market revaluation, not cash reallocation. Household cash holdings expanded in absolute terms (+¥14.9 trillion), while direct equities were net sold (-¥12.0 trillion). Approximately 94% of balance growth across equities and investment trusts was generated by reconciliation adjustments.
- Fresh retail capital deployment was channeled into investment trusts. Households accumulated ¥34.6 trillion in investment trusts across 14 consecutive quarters of net purchases, while divesting from direct single-stock equities.
- Inflation comparisons provide directional context rather than direct subtraction. Deposit growth (+0.5%) trailed CPI inflation (+1.6%), but differing measurement methodologies preclude simple real-return deductions.
Methodological Boundaries and Constraints
Any executive or operational use of these statistics must account for the following analytical boundaries:
- Preliminary vintage risk: End-June 2026 figures are preliminary estimates subject to retroactive historical adjustments. The end-March 2026 baseline shifted from ¥2,386 trillion to ¥2,406 trillion between publication releases.
- Aggregation limits: Cumulative transactions and reconciliation adjustments measure the macroeconomic aggregate of all Japanese households over 14 quarters. They cannot confirm whether specific individuals shifted funds from savings accounts into brokerage accounts.
- Reconciliation account composition: Reconciliation adjustments encompass market price changes, foreign exchange shifts, and classification changes. They do not exclusively represent stock price inflation.
- Timestamp mismatches: International comparisons reflect end-March 2026 data and cannot be merged with Japan’s end-June 2026 figures.
- Absence of account-type isolation: Flow of Funds data does not isolate specific account frameworks such as the New NISA. The specific macroeconomic footprint of NISA cannot be isolated from this dataset alone.
- Scope exclusion: Future market price trajectories, macroeconomic forecasts, and buy/sell trading decisions are strictly outside the scope of this analysis.
- Editorial audit trail: Background research revealed third-party media reports citing household cash ratios that diverged from published BOJ tables. Only verified figures published directly in BOJ releases were incorporated into this analysis; unverified third-party figures were rejected.
Practical Engineering & Executive Decision Playbook: A Step-by-Step Audit Protocol for Asset Allocation Data
This playbook is designed for professionals and corporate strategists tasked with evaluating financial decks or executive briefing materials that cite macroeconomic shifts in asset allocation:
- Verify the publication vintage and release date on the document cover. Confirm whether figures represent preliminary (速報) or revised (確報) data. In this study: Q2 2026 preliminary release, published September 17, 2026.
- Extract outstanding stock balances alongside component shares. Record both the denominator and numerator. In this study: Currency and deposits stood at ¥1,132 trillion, representing 44.9% of ¥2,519 trillion in total assets.
- Align flow (transactions) and stock (balances) series across identical sectors and observation windows. Query the BOJ Time-Series Data Search database for matching stock and flow codes across identical time horizons.
- Compute the reconciliation adjustment independently.
Apply the identity:
Reconciliation Adjustment = Ending Stock - Beginning Stock - Cumulative Flow. For equities:254.0 - (-12.0) = +¥266.0 trillion. - Decompose component ratio movements into capital flow vs. asset revaluation effects. Articulate the decomposition explicitly: “Although cumulative transactions recorded net sales of ¥12 trillion, positive reconciliation adjustments of ¥266 trillion expanded total balances.”
- Harmonize timestamps across disparate sources. When citing international comparisons or inflation figures, append the release date and observation benchmark directly alongside every figure.
- Never extrapolate macroeconomic aggregates to individual customer or employee behaviors. Macro-level household sector totals do not explain the financial decisions of specific client segments, corporate employees, or demographic cohorts.
Real-World Audit Scenario
Consider an internal seminar presentation asserting: “Japan’s household cash ratio fell by 9.1 percentage points. This proves households are reallocating bank savings into equities, so our firm must launch equity investment products immediately.”
Applying this audit protocol reveals two critical flaws:
- First, the assertion regarding behavioral motivation contradicts the empirical record. Household currency and deposits expanded by ¥14.9 trillion, while direct equities were sold on net. The claim that “households shifted cash into stocks” is statistically false.
- Second, the conclusion (“therefore our firm must launch investment products”) is a subjective commercial strategy proposal, not a finding derived from central bank statistics. Distinguishing empirical facts from strategic interpretations prevents costly corporate misallocations.
Fallback Procedure for Data Mismatches
When statistical codes yield figures conflicting with reference charts, audit the publication release date and check for retroactive revision notices. If discrepancies cannot be resolved, flag the figures as “Unverified” rather than using questionable numbers to support executive decisions.
Frequently Asked Questions & Analytical Misconceptions
Q1: Did the cash ratio decline because household cash balances shrank? No. Between end-December 2022 and end-June 2026, household currency and deposits expanded by approximately ¥15 trillion (+148,865 hundred million yen). The cash ratio contracted because non-cash asset values expanded by approximately ¥438 trillion, heavily diluting the share of cash.
Q2: Did the introduction of the New NISA drive massive retail capital into equities? Macro Flow of Funds data cannot confirm or refute specific account-type effects. At the macroeconomic aggregate level, households were cumulative net sellers of direct equities (-¥12 trillion) while accumulating investment trusts (+¥35 trillion). Account-specific tax designations are not isolated in flow-of-funds accounts.
Q3: If equities experienced cumulative net selling, does that mean all equity investors were selling? No. Net transaction flows represent the aggregate sum of all buying and selling across millions of households. Net selling indicates that total sales exceeded total purchases in yen terms; it does not indicate uniform behavior across all individual investors.
Q4: Are preliminary Flow of Funds figures unreliable? Preliminary figures are provisional estimates subject to retrospective revision as primary data matures. The revision of end-March 2026 balances from ¥2,386 trillion to ¥2,406 trillion illustrates this reality. Preliminary figures are fully usable provided analysts disclose release dates and preliminary designations.
Q5: Is the reconciliation adjustment entirely composed of stock market price increases? No. The Bank of Japan defines the reconciliation account as changes resulting from market price fluctuations, foreign exchange rate shifts, and statistical classification adjustments. While equity market appreciation constitutes the dominant component, it is not the sole factor.
Q6: If inflation is accelerating, are bank deposits eroding in purchasing power? While nominal deposit growth (+0.5% year-on-year) trailed headline CPI inflation (+1.6% in June 2026 and +2.1% in September 2026), these metrics measure fundamentally different mathematical constructs (quarter-end stock vs. monthly average flow). Subtracting them provides an informative macro heuristic, not an exact individual purchasing power measurement.
Final Verification Checklist
When analyzing asset allocation data in news reports, corporate decks, or research papers, execute this six-point checklist:
- Have you verified whether figures represent preliminary or revised estimates, noting the exact release date?
- Have you decomposed balance changes into net transaction flows versus reconciliation adjustments (price revaluations)?
- Did you express ratio changes in “percentage points” rather than conflating them with “percentage decline”?
- Are observation timestamps and publication vintages harmonized across all comparative tables?
- Have you avoided extrapolating aggregate macroeconomic sector totals to individual household behaviors?
- Are independently calculated numbers explicitly marked with formulas and underlying values disclosed?
Concluding question for readers: When evaluating shifts in your own asset allocation, have you calculated whether portfolio changes were driven by fresh capital contributions or unrealized market appreciation? Share your analytical methodology in the comments below.
Primary Sources & Verifiable Citations
- Bank of Japan, Flow of Funds Accounts Reference Charts (Q2 2026 Preliminary Release, September 17, 2026): https://www.boj.or.jp/statistics/sj/sjexp.pdf
- Bank of Japan, Time-Series Data Search: Household Sector Financial Assets Outstanding (FFAS430A100, FFAS430A330, FFAS430A318, FFAS430A900): https://www.stat-search.boj.or.jp/api/v1/getDataCode?format=csv&lang=jp&db=FF&code=FOF_FFAS430A100,FOF_FFAS430A330,FOF_FFAS430A318,FOF_FFAS430A900&startDate=202201&endDate=202602
- Bank of Japan, Time-Series Data Search: Household Sector Financial Transactions / Net Flows (FFAF430A100, FFAF430A330, FFAF430A318): https://www.stat-search.boj.or.jp/api/v1/getDataCode?format=csv&lang=jp&db=FF&code=FOF_FFAF430A100,FOF_FFAF430A330,FOF_FFAF430A318&startDate=202301&endDate=202602
- Bank of Japan, Flow of Funds Accounts Full Preliminary Release (Q2 2026): https://www.boj.or.jp/statistics/sj/sjall.pdf
- Bank of Japan, Comparative Analysis of Flow of Funds in Japan, the United States, and the Euro Area (August 31, 2026): https://www.boj.or.jp/statistics/sj/sjhiq.pdf
- Bank of Japan, Outlook for Economic Activity and Prices (October 2026 Release): https://www.boj.or.jp/mopo/outlook/gor2610a.pdf
- Statistics Bureau, Ministry of Internal Affairs and Communications, Consumer Price Index (September 2026 Release): https://www.stat.go.jp/data/cpi/sokuhou/tsuki/pdf/zenkoku.pdf