Why Enterprise AI Spend Exploded 5.4x to $176.8B—Debunking the "$1.70 ROI" Myth and Surviving the 2.5x Token Budget Overrun
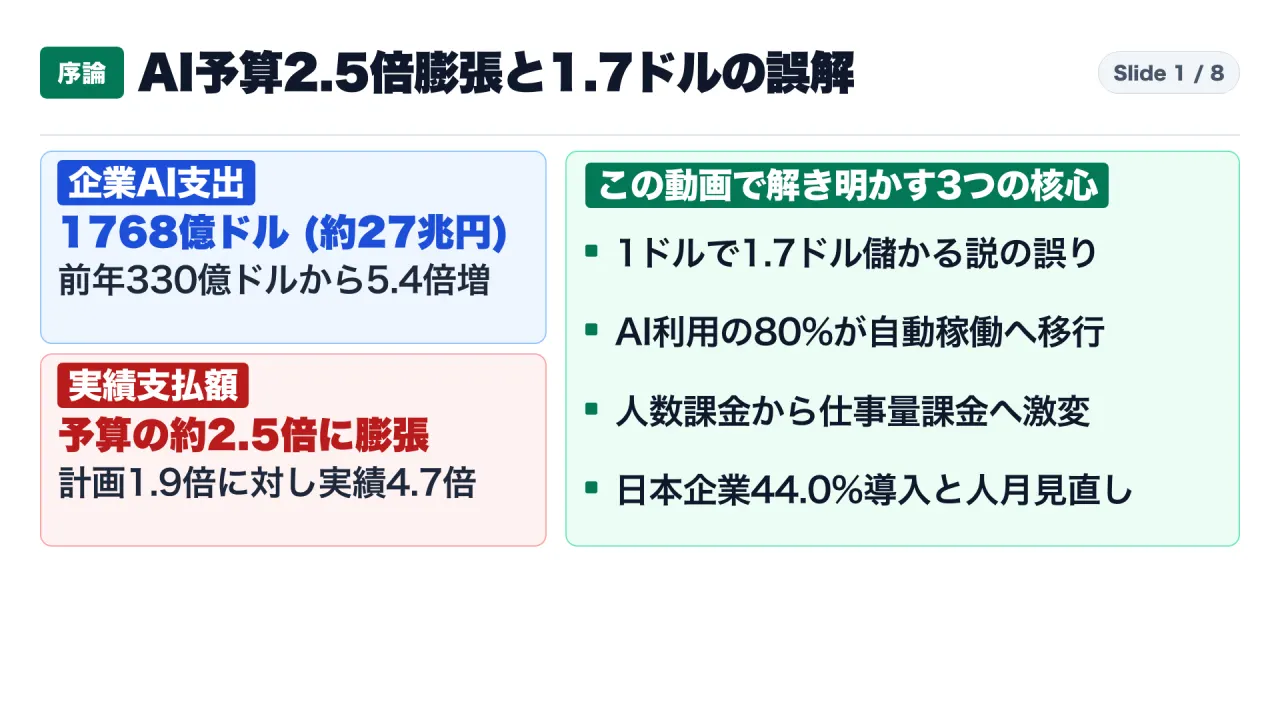
Across corporate IT departments, a dangerous financial misconception is circulating: that investing $1.00 into generative AI automatically yields a $1.70 productivity dividend. In reality, that $1.70 figure represents the AI vendor revenue multiple—$176.8B in enterprise deployment spend versus $102.5B in model training costs—unveiled by Menlo Ventures’ 2026 State of Enterprise AI report. As autonomous agents take over 80% of inference volume (130.9 trillion weekly tokens on OpenRouter), enterprise AI bills are exploding to 2.5x initial forecasts (4.7x actual spend versus 1.9x planned). Drawing on Menlo Ventures, Ramp’s transaction index of 85,000 businesses (Anthropic 60.5% vs OpenAI 35.1% despite OpenAI’s -42.4% price cut), Japan’s IPA DX Trend 2026 (44.0% adoption), METI/MIC AI Operator Guidelines v1.2, and NTT DATA x INSEAD research, this deep dive provides an authoritative blueprint to contain token runaway, transition away from legacy man-month billing, and enforce automated verification gates.
By Consul Oji | Published: November 12, 2026 | Watch / Listen to the Full Briefing on YouTube
1. Executive Summary & Target Audience: Navigating the 2026 Enterprise AI Shift
Technology executives frequently encounter the claim that “every dollar invested in AI generates $1.70 in bottom-line return.” Relying on this figure to justify internal business cases leads directly to budgetary failure. Once multi-step autonomous agents are deployed, monthly API bills routinely swell to 2.5 times initial forecasts.
Target Audience & Core Operational Pains
- CIOs, CTOs, and IT Planning Directors: Managing consumption-metered cloud budgets, struggling to forecast monthly API volatility, and seeking defensible investment justification for executive boards.
- Enterprise Software Buyers, SIer Account Leads, and Engineering Managers: Navigating the collapse of traditional time-and-materials billing as AI agents compress development cycles.
- Digital Transformation Leaders: Moving beyond employee desktop experimentation (summarization and drafting) into unattended production automation.
Three Operational Defenses
- Financial Safeguards: Replace false ROI assumptions with concrete per-task ceilings (maximum 3 retries, $1.50 cap per execution) and two-tier model routing.
- Mechanically Verifiable Workflows: Target domains with automated pass/fail verification harnesses (isolated code sandboxes, accounting reconciliation, or regulatory checklists).
- Tiered Governance Framework: Implement an enterprise AI registry aligned with METI/MIC Guidelines Version 1.2, dividing agent actions into Level 1 (autonomous sandboxed execution), Level 2 (single-click human authorization), and Level 3 (restricted critical execution).
2. Foundational Concepts: Autonomous Agents and Token-Based Consumption Economics
Understanding why enterprise cloud budgets are destabilizing requires separating the operational paradigms of 2025 and 2026:
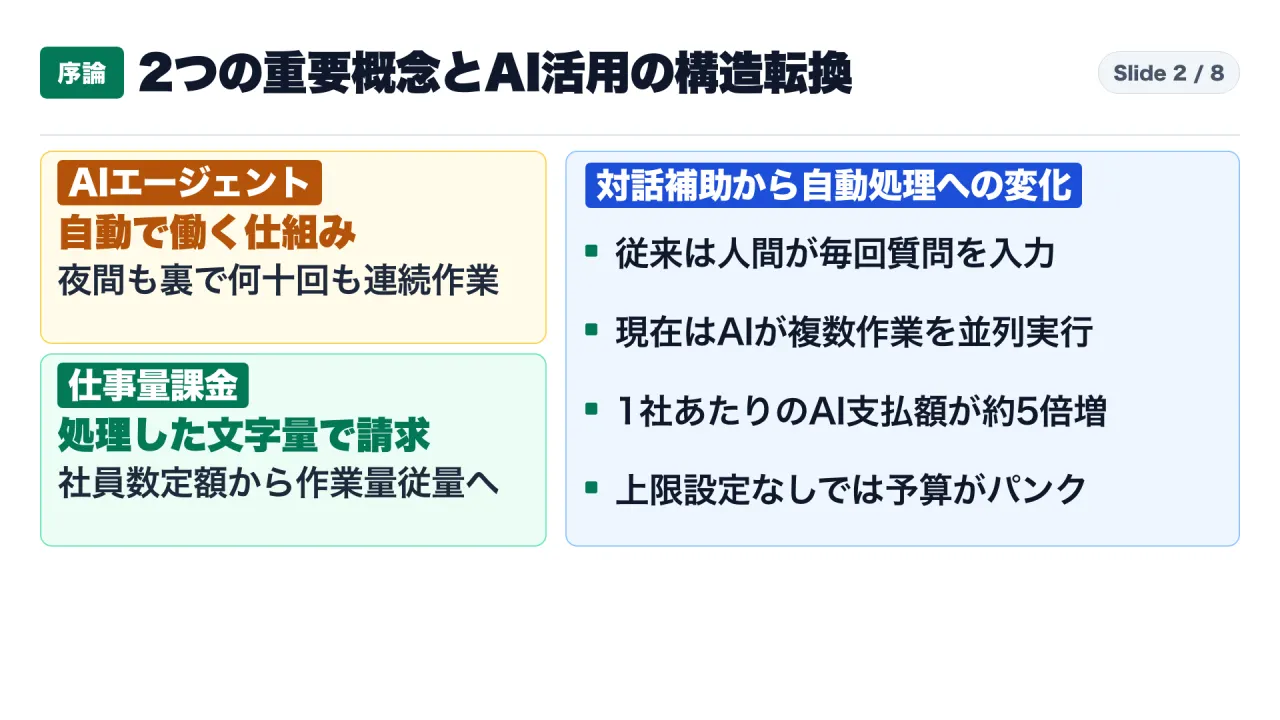
Concept 1: Autonomous AI Agents
Earlier generative AI implementations were synchronous chatbots: an employee submitted a prompt, received an answer, and the model ceased computing. In contrast, an autonomous AI agent operates asynchronously. Given an operational objective, the agent independently plans steps, inspects files, drafts solutions, runs tests, and iterates without ongoing human intervention (S4).
Concept 2: Workload-Driven Token Metering
Legacy SaaS was governed by predictable seat licensing: 100 employees required 100 monthly licenses. Autonomous agents operate on workload-driven token metering, billed on total input and output tokens consumed.
Analogy: Under SaaS, an enterprise purchased fixed-price lunch passes for its workforce. Under agent automation, the organization unleashes hundreds of automated assistants into an a la carte dining facility with an open corporate card. The assistants consume dishes around the clock, and the organization is billed per dish consumed.
When unconstrained agents encounter ambiguous instructions or edge-case errors, their default behavior is to retry continuously, burning millions of tokens in minutes.
3. Part 1: Deconstructing the “$1.70 Return” Myth—Inside the $176.8B Market and 80% Agent Workloads
Auditing Research Scope and Institutional Context
- Research Scope: Menlo Ventures surveyed approximately 400 enterprise decision-makers managing over $4 billion in AI budgets, publishing findings on November 3, 2026 (
S1). - Data Integration: Combines survey responses, public SEC filings, and network telemetry from OpenRouter.
- Commercial Portfolio Disclosure: Menlo Ventures holds investment stakes in Anthropic, OpenRouter, Eve, Commure, and Pinecone. This analysis integrates independent transaction data from Ramp (85,000 businesses;
S2) and public Japanese data from IPA (S3).
The 100-Fold Market Surge: $1.7B to $176.8B
According to Menlo Ventures, annual enterprise AI deployment spending charted a rapid trajectory:
- 2023: $1.7 billion (initial experimentation)
- 2024: $8.5 billion (5.0x growth; chatbot pilots)
- 2025: $33.0 billion (3.9x growth; coding assistants and enterprise RAG)
- 2026 (September Annualized Run-Rate): $176.8 billion (5.4x growth, a 104x increase from 2023).
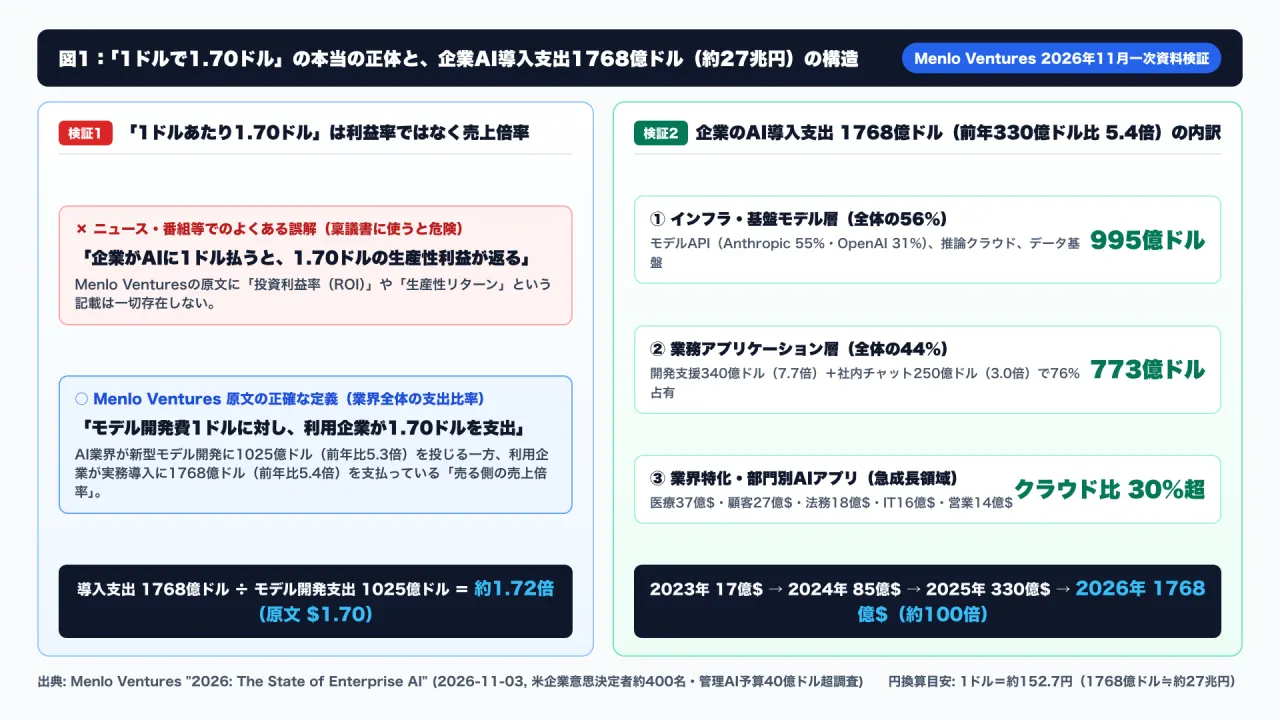
Of this $176.8 billion total, $99.5 billion (56%) represents infrastructure and foundation models, while $77.3 billion (44%) represents vertical and horizontal applications. Enterprise AI now represents over 30% of total public cloud infrastructure spend, up from 6% in 2025.
| Year | AI Spend | YoY Growth | Prevailing Modality | Metering Model | Primary Friction Point |
|---|---|---|---|---|---|
| 2023 | $1.7B | Baseline | Web chat trials | Ad-hoc API credits | Data leakage concerns; bans |
| 2024 | $8.5B | 5.0x | Internal RAG portals | Per-seat subscriptions | Shelfware; low adoption |
| 2025 | $33.0B | 3.9x | Code assistants | Seats + metered overages | Inability to quantify macro ROI |
| 2026 | $176.8B | 5.4x | Autonomous agents | Pure token metering | Bills reaching 2.5x budgets |
Growth in 2024-2025 was driven by seat expansion. The 2026 explosion was driven by workload depth—autonomous agents consuming tens of millions of tokens per task.
The Audited Origin of the “$1.70” Metric
Media reports frequently stated: “Enterprises earn $1.70 in productivity for every $1.00 spent on AI.” However, the term “ROI” does not appear in the Menlo report, nor does the phrase “productivity return.” The verbatim passage states:
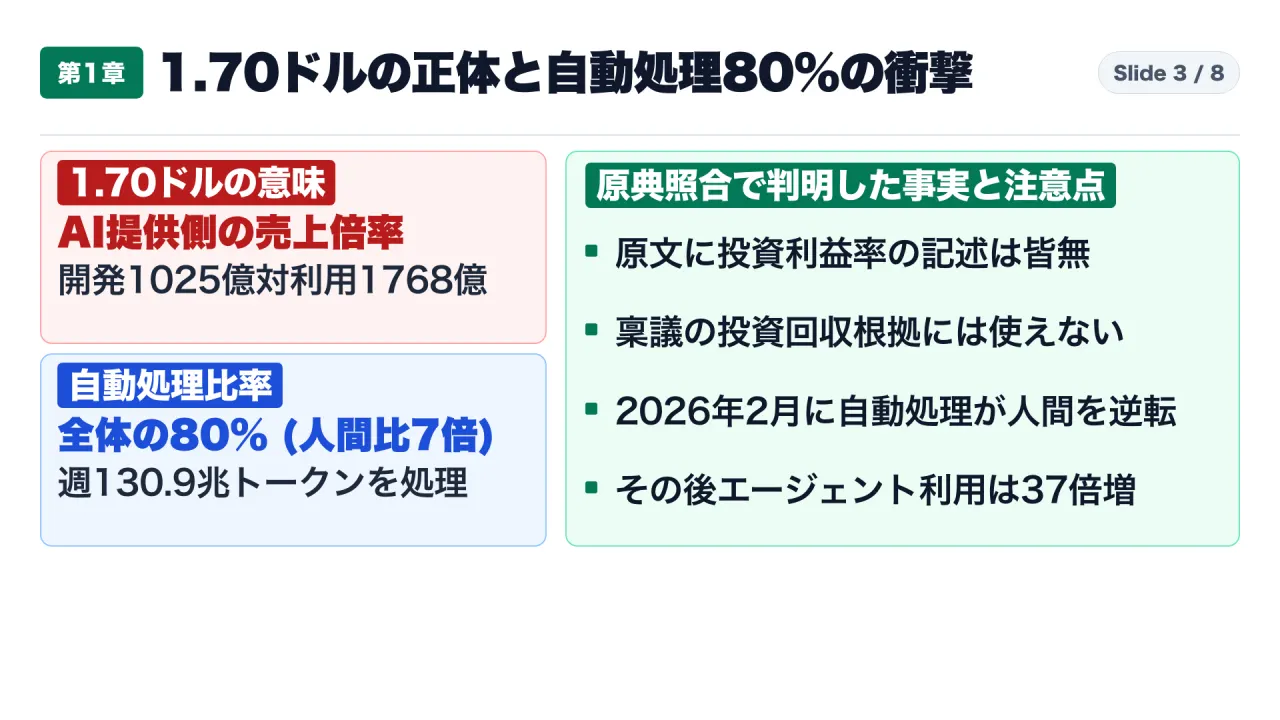
“For every $1 the industry spends building AI models, enterprises spend about $1.70 putting them to work. Spend on building models grew 5.3x to $102.5B in 2026, and spend on using AI grew 5.4x to $176.8B, 1.7x as much.” (
S1)
The arithmetic represents an industry-wide macro ratio:
- Enterprise Deployment Spend (Numerator): $176.8 billion
- Vendor Model Training CapEx (Denominator): $102.5 billion
- Ratio: $176.8B / $102.5B = 1.724… (reported as 1.70x)
| Dimension | Media Misconception | Audited Text Reality (S1) |
|---|---|---|
| $1.00 Baseline | $1.00 spent by an enterprise client on AI | $1.00 ($102.5B total) invested by vendors in model R&D |
| $1.70 Figure | $1.70 generated in corporate profit/savings | $1.70 ($176.8B total) paid by enterprises for inference/apps |
| Metric Type | Enterprise ROI (170% capital return) | Macro industry revenue-to-CapEx multiple |
| Procurement Use | Invalid: Cannot justify internal payback | Demonstrates market scale and commercial adoption |
OpenRouter Telemetry: Agents Dominate 80% of Token Volume
Telemetry from OpenRouter (routing over 160 trillion weekly tokens) demonstrates the mechanics behind this expansion:
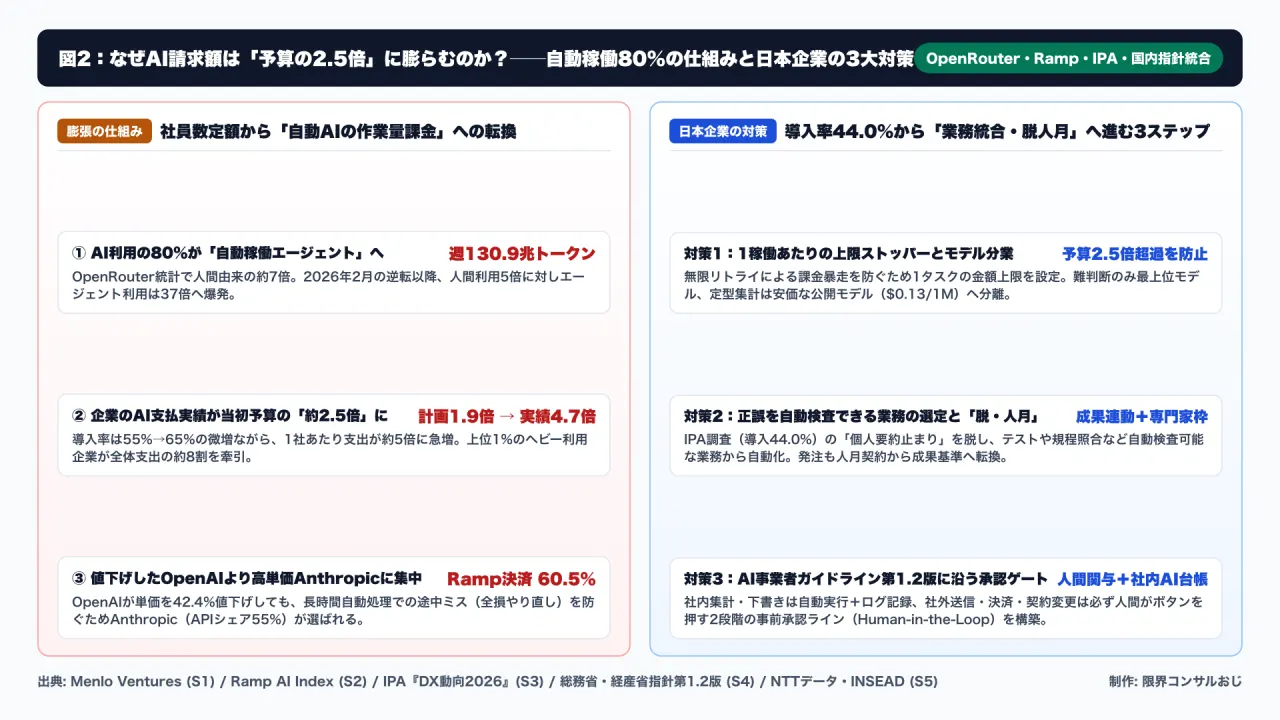
- 80% Agent Workload Share: 80% of weekly tokens (130.9 trillion tokens) are consumed by autonomous agents, outnumbering direct human chat inputs by 7 to 1.
- Inflection Timeline:
- November 2025: Claude Opus 4.5 release triggered a 3x weekly spike in agent token consumption.
- Early February 2026: Opus 4.6 and GPT-5.3-Codex releases caused agent volume to permanently surpass human conversational volume.
- The Divergence: Following this crossover, human chat volume expanded 5x, while autonomous agent volume expanded 37x.
Why One Prompt Generates Millions of Tokens
- Compounding Context Ingestion: A 30-step agent loop resubmits cumulative execution history, file reads, and error outputs at each step, ballooning context input tokens.
- Sub-Agent Fan-Out: Modern orchestrators spawn multiple sub-agents in parallel (researchers, implementers, auditors), multiplying concurrency.
- Self-Healing Iteration: Agents instructed to “iterate until tests pass” run continuous retry loops, consuming tokens around the clock.
4. Part 2: The Anatomy of a 2.5x Budget Explosion—Seat Subscriptions vs. Workload Consumption
The Budget Gap: 1.9x Projected vs. 4.7x Actual
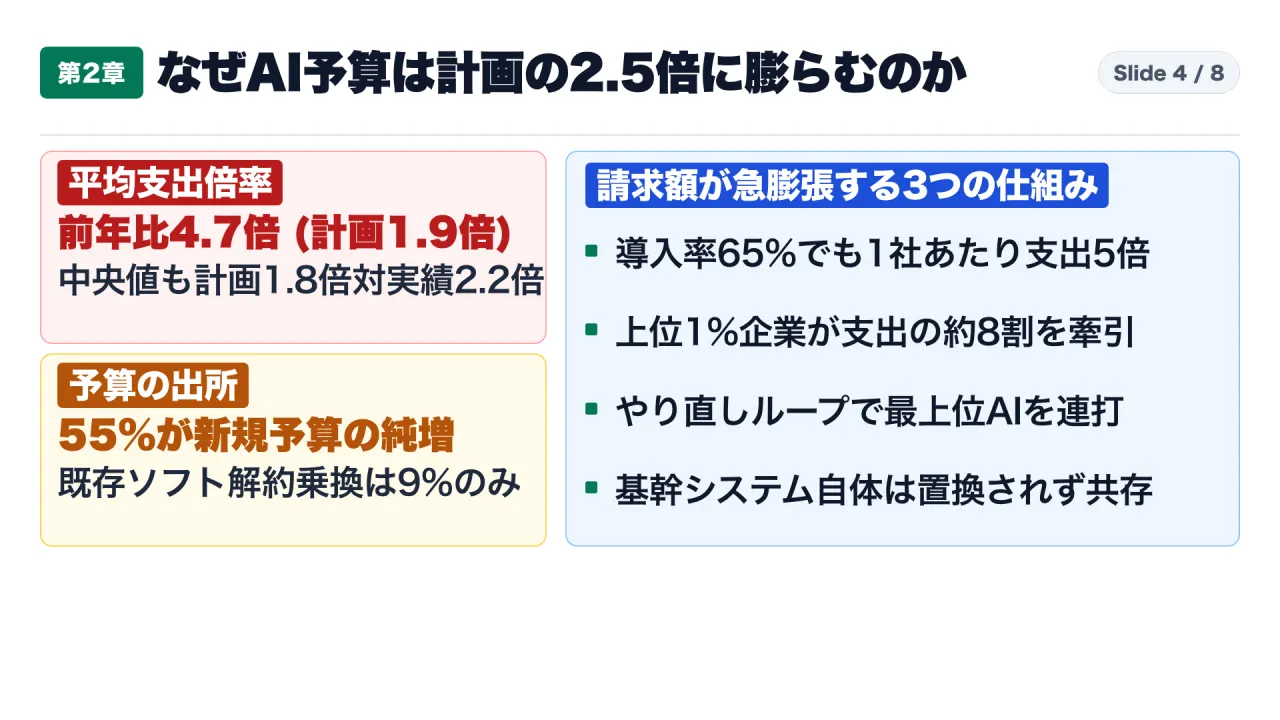
- Mean Acceleration: Enterprises planned a 1.9x budget increase in 2026, but realized an average 4.7x increase—an overrun factor of 2.47x (~2.5x).
- Median Acceleration: Planned at 1.8x; actual spending reached 2.2x.
- Penetration vs. Intensity: Enterprise generative AI adoption grew modestly from 55% in 2025 to 65% in 2026 (a 10-point gain). Spend per enterprise increased nearly fivefold. Ramp telemetry (
S2) confirms this concentration: the top 1% of enterprise spenders drive approximately 80% of total AI spending.
The Infinite Loop Hazard: A Real-World Failure Mode
The runaway budget dynamic is illustrated by a common failure pattern: An automated document processing pipeline is configured to parse receipts and invoices. The instructions dictate: “Extract line items; if OCR confidence is low, retry with the frontier reasoning model until extraction succeeds.”
When encountering a faded receipt, the unconstrained script re-submits the image hundreds of times to the highest-tier model, attempting subtle prompt variations. Within two hours, a routine task consumes an entire month of API credits. Adding a simple constraint—“Halt if retries exceed 3 attempts or task cost reaches $0.50”—resolves the vulnerability.
The SaaS Displacement Reality
Despite speculation that agents would dismantle enterprise SaaS, Menlo Ventures found:
- Net-New Enterprise IT Budget: 55%
- Reallocated from Other Non-Software IT: 23%
- Reallocated from Existing SaaS Budgets: 22%
- Incumbent vendor AI add-ons captured 13%
- Direct SaaS Displacement: Only 9% ($12.6 billion).
| Architecture Layer | Core Function | Representative Systems | 2026 Dynamic (S1) |
Replacement Barrier |
|---|---|---|---|---|
| System of Record | Audited corporate truth | Core ERP, CRM, HRIS, Git | Displacement limited to 9% | Multi-decade database schemas and audit rules |
| User Interface | Manual web forms | Legacy dashboards, data entry | Primary area being bypassed | Agent APIs interact with data directly |
| System of Action | Agent orchestration | Coding agents ($34B), Chatbots ($25B) | Captured 78% of new/reallocated budgets | Converts manual labor into software compute |
Enterprise SaaS is not disappearing; it is becoming a foundational database layer upon which autonomous Systems of Action execute.
Enterprise Diagnostic: 5 Budget Safeguard Questions
- Does any active funding proposal rely on the “$1.70 ROI” macro ratio?
- Do all agent pipelines enforce hard programmatic limits (maximum 3 retries, $1.50 cap per task)?
- Are cloud accounts configured with velocity alerts notifying managers if daily spend exceeds 150% of forecast?
- Are routine text parsing tasks strictly delegated to low-cost or open-weight models?
- Do agent frameworks prune historical context rather than resubmitting intermediate error traces?
5. Part 3: Why Anthropic Commands 60% of Enterprise Spend—Bipolar Consolidation and the 3 Laws of Agent Success
The Price Elasticity Paradox in Frontier Models
In standard markets, steep price cuts drive market share gains. In enterprise AI inference, the opposite occurred during late 2026.
| Metric / Benchmark | Anthropic (Claude) | OpenAI (GPT) | Google (Gemini) | Open-Weight Ecosystem |
|---|---|---|---|---|
Enterprise API Spend Share (Menlo S1) |
55% (up from 40% in 2025) | 31% (up from 27% in 2025) | 9% (down from 21% in 2025) | Spend: 4%; Token Share: 19% ($0.13/M tokens) |
Corporate Settlement Share (Ramp S2: Oct 23 week) |
60.5% (surged from 51.3% in Sept) | 35.1% (fell from 44.2% in Sept) | ~4.4% (combined providers) | Negligible on corporate cards |
MoM Token Price Change (Ramp S2) |
-15.7% (sustained premium) | -42.4% (deep price cuts) | Moderate cuts | Ultra-low commodity pricing |
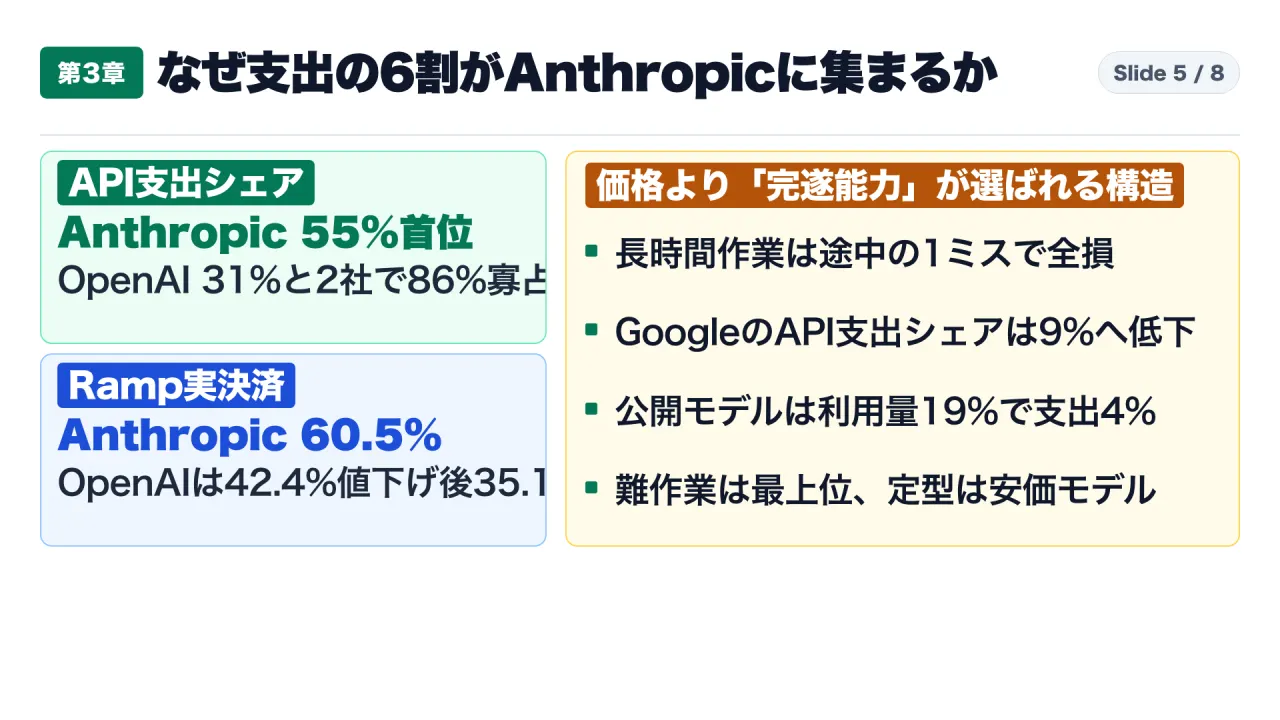
OpenAI cut per-token prices by 42.4%, yet Anthropic grew its share of corporate payment volume from 51.3% to 60.5%. Anthropic and OpenAI together capture 86% of survey spend (Menlo) and 95.6% of verified card payments (Ramp).
The Mathematics of Multi-Step Reliability
In a 20-step autonomous workflow:
- A model with 98% step accuracy achieves an overall completion probability of
0.98^20 = 66.8%. - A model with 90% step accuracy achieves an overall completion probability of
0.90^20 = 12.2%.
If an agent fails at step 18, all preceding compute is lost, and the task restarts. In autonomous workflows, a cheaper model with lower reliability costs significantly more in total compute to achieve a verified result.
Concurrently, open-weight models (Kimi K3, DeepSeek V4) handle 19% of total tokens on OpenRouter, but represent only 4% of spending due to an average price of $0.13 per million tokens. Advanced architectures deploy a two-tier model strategy: open-weight models handle high-volume extraction, while frontier models handle planning and verification.
Application Sizing and The Three Laws of Agent Success
Of the $77.3 billion enterprise application market:
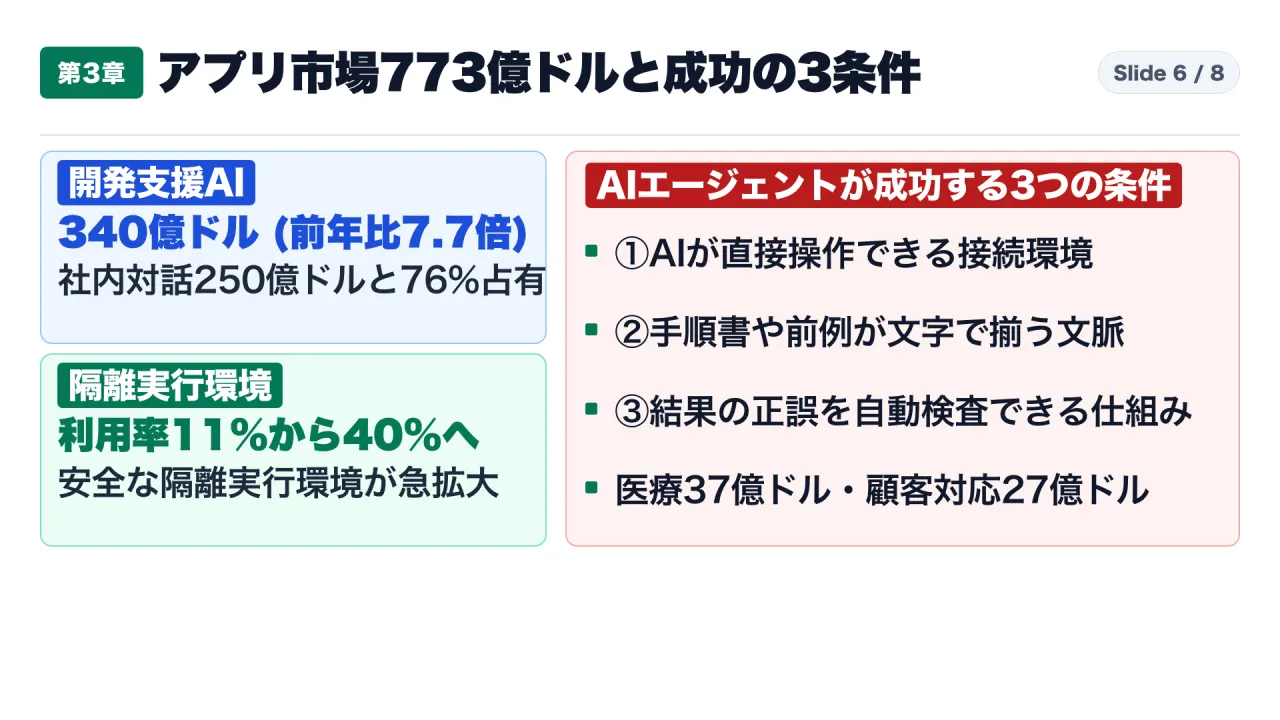
- Core Segments (76% = $59.0B): Coding ($34.0B, 7.7x growth) and Enterprise Chatbots ($25.0B, 3.0x growth).
- Functional Sectors: Healthcare ($3.7B, 2.5x), Customer Support ($2.7B, 4.3x), Legal ($1.8B, 2.8x), IT/DevOps ($1.6B, 2.3x), Sales ($1.4B, 3.6x), Finance ($1.3B, 5.5x), Marketing ($1.2B, 1.8x), HR ($0.9B, 2.0x).
Menlo Ventures identifies The Three Laws of Autonomous Agent Success:
- Law 1: Direct Actionability: Programmatic access to read and write state (Git, terminals, APIs).
- Law 2: Structured Context: Codified operating guidelines and past records.
- Law 3: Deterministic Verifiability: Automated harnesses to confirm correctness objectively.
Software development grew 7.7x because code can be compiled and evaluated in automated test suites; reflecting this, isolated code sandbox adoption expanded from 11% in 2025 to 40% in 2026 (S1). Finance expanded 5.5x because ledger balancing is mathematically verifiable. In contrast, marketing copy and HR evaluations lack automated verification mechanisms, requiring manual human review.
| Domain | Scale (S1) |
YoY | Law 1: Actionability | Law 2: Context | Law 3: Verifiability | Recommended Automation Entrypoint |
|---|---|---|---|---|---|---|
| 1. Software Engineering | $34.0B | 7.7x | High (Git, CLI, CI) | High (Code, specs) | Very High (Sandboxes at 40%, tests) | Unit tests, migrations, bug fixes |
| 2. Enterprise Knowledge | $25.0B | 3.0x | High (Wiki, Slack, Jira) | High (Policies, docs) | Moderate (Source citation checks) | Employee helpdesk, doc search |
| 3. Healthcare | $3.7B | 2.5x | Med-High (EHR systems) | High (Clinical rules) | High (Billing code rules, drug logic) | Clinical notes, billing audit |
| 4. Customer Support | $2.7B | 4.3x | High (Ticketing, DBs) | High (FAQs, policies) | High (Policy compliance rules) | Order tracking, policy returns |
| 5. Legal Affairs | $1.8B | 2.8x | Med-High (Docs, Word) | High (Playbooks) | High (Clause presence, redlines) | First-pass NDA reviews |
| 6. IT / DevOps | $1.6B | 2.3x | High (Monitoring, logs) | High (Runbooks) | High (Network reachability probes) | Incident triage, account provisioning |
| 7. Sales Operations | $1.4B | 3.6x | High (CRM, email) | Medium (Transcripts) | Moderate (CRM field completeness) | Meeting CRM logging, account briefs |
| 8. Finance / Accounting | $1.3B | 5.5x | High (ERP, bank APIs) | High (Tax, rules) | Very High (Debit/credit parity, 3-way match) | Invoice-to-PO matching |
| 9. Marketing | $1.2B | 1.8x | Medium (CMS, social) | Medium (Style guides) | Low (Copy quality is subjective) | Multi-draft generation, style checks |
| 10. Human Resources | $0.9B | 2.0x | Medium (ATS, HRIS) | Medium (Handbooks) | Low (Appraisals require empathy) | Interview scheduling, benefits FAQ |
6. Part 4: The 44.0% Adoption Reality in Japan—The Breakdown of “Man-Month” Contracts and METI/MIC Governance Guidelines
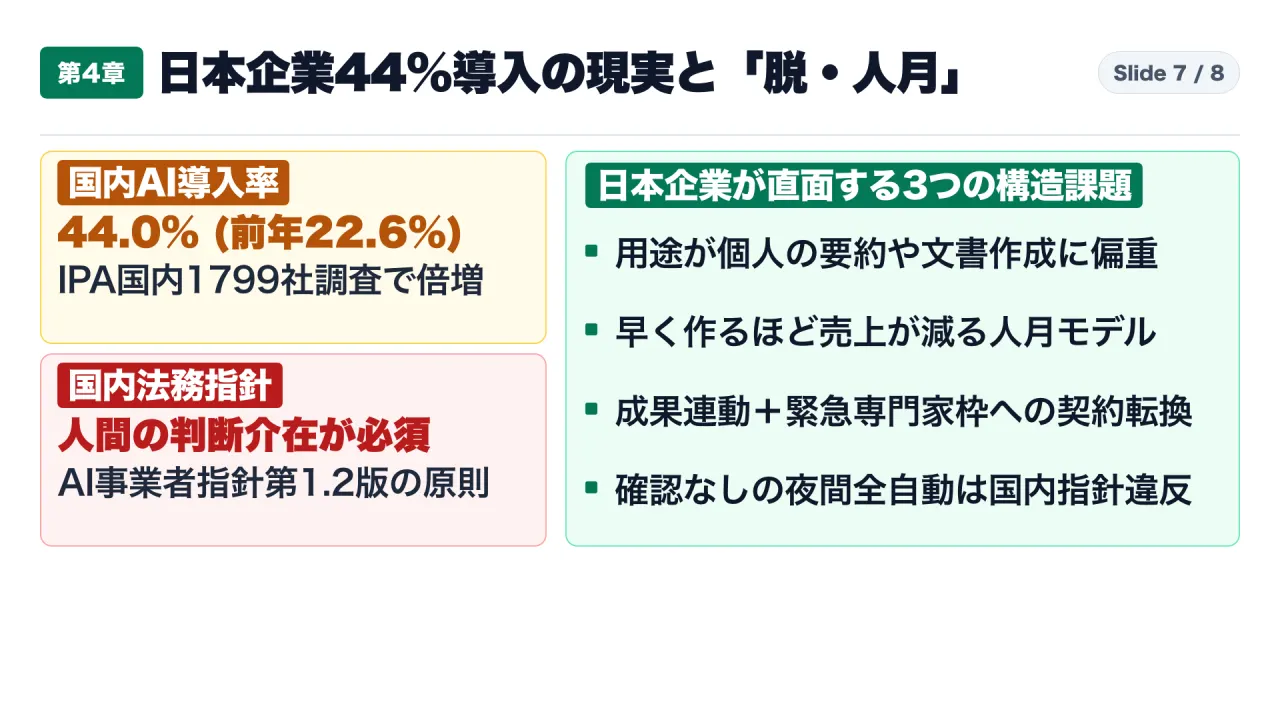
The Domestic Adoption Reality: IPA DX Trend 2026
Japan’s Information-technology Promotion Agency (IPA) surveyed 1,799 domestic corporations in DX Trend 2026 (S3, Figure 3-5):
- Adoption Rate: 44.0%, nearly doubling from 22.6% in 2024.
- The Qualitative Divide: Most Japanese usage remains limited to individual desktop tasks (translating documents, summarizing meetings, and drafting emails). End-to-end autonomous agent pipelines remain rare.
The Breakdown of the Man-Month (Nin-Getsu) IT Contract
In Japan’s IT services sector, software has long been procured via the man-month (nin-getsu) model:
Total Project Price = Headcount * Months Allocated * Monthly Rate
When autonomous coding agents generate code, execute migrations, and build test suites, a modernization effort requiring 10 engineers over six months (60 man-months) can be completed by two engineers and an agent cluster in three weeks. This introduces a structural dilemma for system integrators: Using AI to compress delivery times by 70% reduces billable labor hours by 70%, undermining gross revenue.
Addressing this challenge, NTT DATA Group and INSEAD published joint research on April 2, 2026 (S5), stating:
“The utilization of AI directly impacts the sustainability of traditional man-month business models.”
The research outlines the necessary industry evolution: shifting from time-based billing to outcome-based valuation (charging for business value and project completion speed).
Contracting Template: Traditional Man-Month vs. Outcome-Based AI Model
| Dimension | Traditional “Man-Month” | “Hybrid Outcome + Retainer” | Advantage |
|---|---|---|---|
| 1. Fee Structure | Billed on labor time (e.g., 60 man-months) | Billed on verified deliverables (e.g., 50 microservices migrated) | Vendor earns higher margin via efficiency; client secures faster delivery |
| 2. Inference Fees | Hidden within overhead | Dedicated capped pass-through facility for AI compute and sandboxes | Ensures access to frontier models while capping client expenditure |
| 3. Acceptance | Subjective inspection of test sheets | 100% test pass rate in isolated sandboxes + zero critical vulnerabilities | Automated quality gate removing subjective sign-off debates |
| 4. Maintenance | Full-time on-site personnel retainers | “Senior Escalation Retainer” guaranteeing 2-hour expert response | Client avoids paying for idle hours; vendor deploys senior talent broadly |
Governance Mandates: METI/MIC AI Operator Guidelines v1.2
On March 31, 2026, METI and MIC released Version 1.2 of the AI Operator Guidelines (S4), establishing explicit rules for autonomous agents:
- Unintended Autonomous Actions: Warning against unmonitored external purchasing, file deletions, or unauthorized database mutations.
- Security Vulnerabilities: Highlighting risks where prompt injection causes agents to expose internal data.
Guidelines mandate:
- Human-in-the-Loop (HITL): Mandatory human review for irreversible actions.
- Principle of Least Privilege: Restricting agent credentials to minimal required scopes.
- Audit Logging: Chronological recording of all agent tool calls, data access, and decisions.
The 3-Tier Enterprise Permission Matrix
| Level | Scope & Capabilities | Human Oversight Gate | Programmatic Cost Stop | Compliance & Logging |
|---|---|---|---|---|
| Level 1: Autonomous (Read & Sandbox) | Document summarization; internal search; sandboxed code drafting and testing | Post-execution review only | Per-task cap: $0.75 or 3 retries; daily ceiling: $35.00 | Automated logging of model ID, timestamp, and token usage |
| Level 2: Authorized (Write & Send) | Updating internal databases; drafting customer emails; opening pull requests | Mandatory single-click human authorization on diff screen | Per-task cap: $3.50 or 5 retries; lock on anomaly | Diff recorded with authorizing employee ID |
| Level 3: Restricted (Critical Actions) | Payments over $100; live database deletions; modifying IAM security policies | Direct AI execution disabled at IAM level | Execution credentials withheld at API gateway | Immediate emergency alert upon attempted calls |
7. Strategic Conclusions: Audited Facts, Operational Interpretation, and Action Blueprints
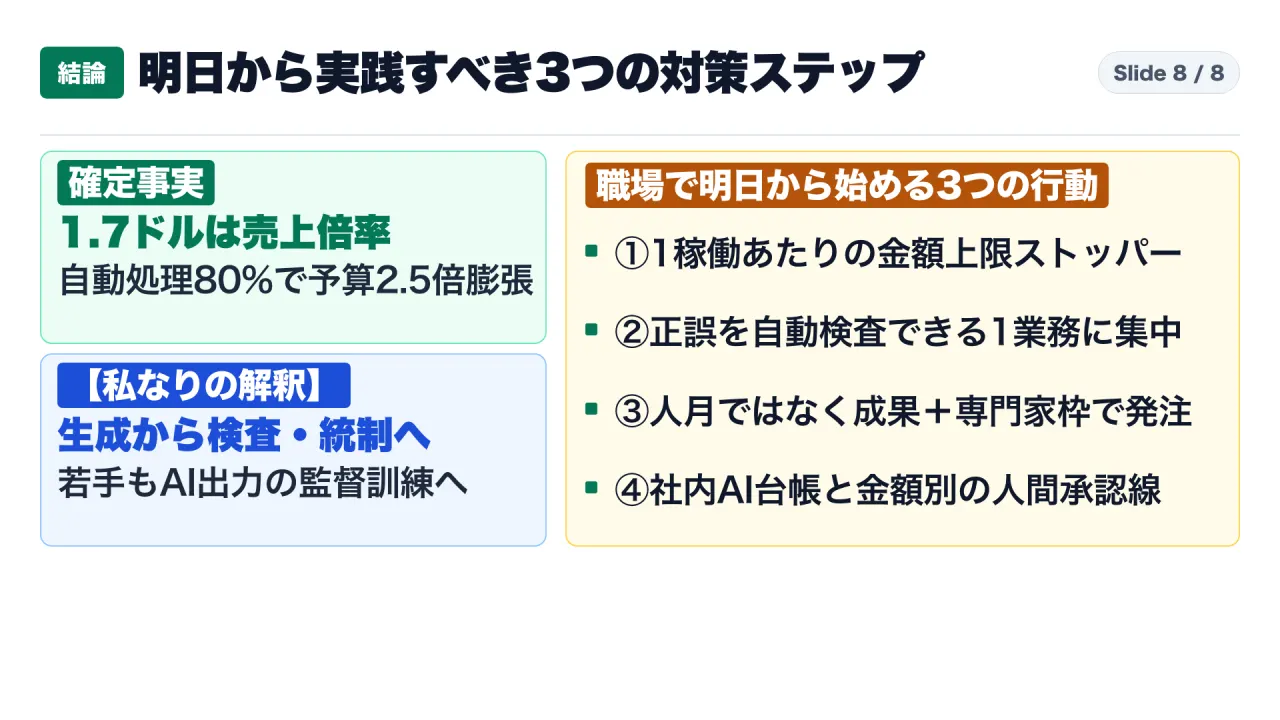
Summary of Audited Facts
- Market Scale & the 1.70 Ratio (
S1): Enterprise AI deployment spend surged 5.4x in 2026 to $176.8B ($99.5B infrastructure, $77.3B applications). The “$1.70 per $1.00” metric represents enterprise deployment spend ($176.8B) divided by vendor training CapEx ($102.5B)—not enterprise investment return. - Budget Overruns & Agent Dominance (
S1,S2): Actual enterprise spend grew 4.7x versus 1.9x planned (a 2.47x budget overrun). On OpenRouter, autonomous agents represent 80% of volume (130.9T tokens weekly), with the top 1% of enterprises driving 80% of total spend. - Model Consolidation & The Three Laws (
S1,S2): Anthropic commands 55% of survey spend and 60.5% of Ramp card transactions. High-stakes agent workflows prioritize completion reliability over discounted token pricing. The application market is led by Coding ($34B) and Chatbots ($25B), where Actionability, Context, and Verifiability are established. - Domestic Adoption & Contracting Evolution (
S3,S4,S5): Japanese adoption reached 44.0%, but remains focused on personal productivity. The rise of autonomous agents necessitates transitioning away from legacy man-month billing to outcome-based contracts (NTT DATA/INSEAD) governed by METI/MIC Guidelines Version 1.2.
Operational Interpretation: The Evolution of Professional Skills
Competitive differentiation has shifted: The era of prompt engineering is over. Organizational success now depends on the capacity to engineer automated verification harnesses, orchestrate multi-agent pipelines, and enforce programmatic financial brakes.
This structural shift transforms workforce training. Entry-level white-collar tasks are increasingly handled by Level 1 agents. Organizations must train junior professionals from their first year to act as verification auditors: reviewing execution traces, identifying edge-case failures, and managing automated systems.
Three Operational Action Mandates
Mandate 1: Programmatic Cost Ceilings and Two-Tier Routing
- Base procurement justifications on measured labor hours saved versus empirical token costs.
- Enforce hard programmatic caps: maximum 3 retries and a $0.50 to $2.00 ceiling per subtask.
- Route high-volume preprocessing to open-weight models ($0.13/M tokens), reserving frontier models for synthesis and verification.
Mandate 2: Restructure IT Contracts Around Outcomes
- Replace man-month headcounts with fixed deliverable pricing tied to automated acceptance criteria (100% test passage in isolated sandboxes).
- Establish capped pass-through facilities for AI compute alongside fixed retainers for senior architect escalation.
Mandate 3: Implement an Enterprise AI Registry and Tiered Governance
- Inventory all corporate AI endpoints, billing models, and database access permissions.
- Implement the 3-tier governance structure: unassisted Level 1 execution in sandboxes, single-click Level 2 authorization for state-changing writes, and strict prohibition of Level 3 critical actions.
8. Practical Implementation Appendix: ROI Calculation Model and Enterprise Defense Checklist
Funding Proposal Template: Strategic Context
According to Menlo Ventures’ 2026 State of Enterprise AI report, enterprise deployment spend reached $176.8 billion (expanding 5.4x year-over-year), representing 1.70x vendor foundation model CapEx. Telemetry indicates that 80% of tokens on open routing fabrics are generated by autonomous agents, with domestic adoption reaching 44.0% (IPA DX Trend 2026).
However, spending routinely exceeds initial forecasts by 2.47x (4.7x actual versus 1.9x planned) due to unmonitored automated loops. To capture operational efficiency while guaranteeing budgetary control, this initiative:
- Restricts agent execution strictly to mechanically verifiable workflows within isolated sandboxes;
- Enforces hard programmatic limits (maximum 3 retries, $1.50 per task ceiling);
- Implements a two-tier model architecture, routing bulk extraction to commodity models and reserving frontier models for architectural synthesis. This initiative targets a verifiable reduction of [X] engineering hours per month with a guaranteed maximum monthly inference expenditure of $[Y].
The 4-Variable Enterprise Token Budget Formulation
To forecast metered agent workloads accurately, apply this four-variable model:
Monthly Budget Ceiling = N * C_base * R_avg * B
- $N$: Monthly workload task volume (e.g., 1,000 document processing tasks).
- $C_{\text{base}}$: Base token cost per task derived from pilot telemetry (e.g., $0.35).
- $R_{\text{avg}}$: Average iteration multiplier under a maximum 3-retry cap (e.g., 1.4 runs).
- $B$: Safety buffer for month-end closing surges (1.5x).
Example:
1,000 tasks * $0.35 base * 1.4 average runs * 1.5 buffer = $735.00 / month
If manual execution previously required 25 minutes per document, and agent assistance compresses this to 3 minutes of human review, 1,000 documents yield 366 saved hours. Valued at $50 per hour, this generates $18,300 in capacity savings against a controlled $735 token cost—demonstrating verified operational return.
9. Comprehensive Enterprise FAQ: 7 Hard Questions on Pricing, Governance, and Workforce Shift
Q1: “If OpenAI cut token prices by 42.4%, why not standardize on a single low-cost provider to resolve the 2.5x budget issue?”
Mandating a single low-cost model increases net operational costs in multi-step workflows. Ramp payment data (S2) and Menlo telemetry (S1) show enterprises shifting toward Anthropic (60.5% of card spend) despite OpenAI’s price cut. In multi-step pipelines, compounding step reliability dominates total cost. If an agent with 90% per-step accuracy fails on step 14 of an eighteen-step workflow, all preceding compute is lost, triggering a restart. The winning architecture is disciplined two-tier routing: deploying low-cost models ($0.13/M tokens) for bulk text extraction, while reserving frontier models for planning and verification.
Q2: “Our organization is not a software development house. Outside of coding, where can we deploy autonomous agents with real returns?”
Focus on functional sectors showing rapid growth in the Menlo application breakdown (S1): Finance & Accounting ($1.3B, 5.5x growth), Customer Support ($2.7B, 4.3x growth), and Legal ($1.8B, 2.8x growth). These sectors fulfill Law 3 (Automated Verifiability): three-way invoice matching in finance, policy condition checking in support, and mandatory clause verification in legal agreements can all be checked programmatically.
Q3: “If we approach IT service contractors and propose moving from man-month billing to outcome-based contracts, won’t they resist?”
Forward-looking IT providers recognize that man-month contracts are unsustainable in the agent era, as documented by NTT DATA and INSEAD (S5). The key is aligning incentives: offer fixed milestone pricing for verified deliverables. If the contractor leverages AI to deliver in two months instead of six, they retain the full fee, expanding their margin. In exchange, the enterprise establishes a capped compute pass-through facility and retains senior architects on fixed escalation retainers.
Q4: “If we implement Human-in-the-Loop gates under METI/MIC Guidelines Version 1.2, won’t human approvals create administrative bottlenecks?”
Human oversight does not require monitoring every intermediate step. Guidelines target unmonitored execution of irreversible external actions (payments, data deletions, external messages). Divide workflows cleanly: allow agents to execute Level 1 internal operations autonomously in sandboxes through the night. The human operator engages only at Level 2 deployment, reviewing a unified diff screen and clicking “Approve.” Human effort is reduced from hours of manual drafting to seconds of verification.
Q5: “If agents handle preliminary research and routine coding, how do we prevent junior employees from losing foundational skills?”
This challenge is examined in the NTT DATA x INSEAD research (S5). The traditional model of junior apprenticeship—spending years manually writing boilerplate or drafting summaries—is economically obsolete. Organizations must transition to adversarial evaluation training: junior staff are given agent-generated designs or pull requests with intentionally seeded errors. Their job is to interrogate execution logs, locate defects, and explain why the model failed, building critical oversight capabilities.
Q6: “Can we run low-cost open-weight models ($0.13/M tokens) within an internal VPC without data leakage risks?”
Yes. Open-weight models (such as Kimi K3 or DeepSeek V4) allow organizations to run inference within private virtual private clouds (VPCs) on dedicated instances. Zero proprietary data leaves the corporate perimeter, satisfying data residency mandates. In-VPC models handle high-volume internal tasks (parsing logs, indexing internal documents), while sanitized metadata can be routed to external frontier commercial models only when complex reasoning is required.
Q7: “Our business units have procured fragmented AI tools across departments. What is our immediate first step?”
Avoid blanket bans, which drive usage into unmonitored shadow AI channels. In alignment with METI/MIC Guidelines Version 1.2 (S4), launch a one-week Enterprise AI Asset Inventory: audit current tools, billing structures, connected data repositories, per-task cost limits, and human approval gates. Consolidate fragmented spending into a centralized enterprise API gateway equipped with global rate limits, audit logging, and automated verification sandboxes.
10. Primary Sources and Audited References
- Menlo Ventures, 2026: The State of Enterprise AI (Published November 3, 2026): Tracks enterprise deployment spend ($176.8B), base model training CapEx ($102.5B), the 1.70:1.00 deployment-to-development ratio, OpenRouter telemetry (80% agent token share, 130.9T weekly tokens), budget overruns (1.9x planned vs. 4.7x actual = 2.47x overrun), model market share (Anthropic 55%, OpenAI 31%), and application sector growth: https://menlovc.com/perspective/2026-the-state-of-enterprise-ai/
- Ramp Economics Lab, Ramp AI Index (October 2026 Benchmark; Reporting Week Ending October 23, 2026): Commercial card and accounts payable transaction analysis across 85,000+ businesses, documenting corporate token settlement shares (Anthropic 60.5%, OpenAI 35.1%), price elasticity metrics (OpenAI -42.4% vs. Anthropic -15.7%), and spending concentration among the top 1% of enterprise users: https://ramp.com/data/ai-index
- Information-technology Promotion Agency, Japan (IPA), DX Trend 2026 (Published July 30, 2026): Domestic survey of 1,799 Japanese enterprises establishing generative AI adoption at 44.0% (up from 22.6% in 2024, Figure 3-5), while analyzing the concentration of domestic use cases in individual desktop productivity: https://www.ipa.go.jp/digital/chousa/dx-trend/rcu1hd0000017uk8-att/dx-trend-2026.pdf
- Ministry of Internal Affairs and Communications (MIC) and Ministry of Economy, Trade and Industry (METI), AI Operator Guidelines (Version 1.2) (Published March 31, 2026): Japanese regulatory framework defining risks associated with autonomous AI agents and establishing requirements for Human-in-the-Loop oversight, least privilege permissions, and chronological audit logging: https://www.soumu.go.jp/main_content/001064286.pdf
- NTT DATA Group and INSEAD, Joint Research on Workforce and Organizational Transformation in the IT Services Industry in the AI Era (Published April 2, 2026): Industrial research examining the obsolescence of legacy man-month (nin-getsu) contracting in system integration, the transition to outcome-based software valuation, and organizational frameworks for engineering workforce development: https://www.nttdata.com/global/ja/news/topics/2026/040201/
Video Briefing, Related Deep Dives, and Background
- Full Audio / Video Briefing (Japanese Narration with Architectural Visualizations): Why Enterprise AI Costs Swell to 2.5x Initial Budgets and How to Overcome the $1.70 ROI Fallacy
- Editorial Mission & Analytical Methodology: Why We Trace Frontier Tech Claims Back to Primary Source Telemetry
Recommended Reading on Enterprise AI Architecture & Cloud Infrastructure
- Deconstructing Enterprise Model Economics: Why Frontier Model Price Cuts Fail to Shift Enterprise Market Share
- The Architecture of Autonomous Governance: Designing Sandboxed Execution Environments for Corporate Agent Fleets